
Most traders find out about the eurusd vs gold correlation in the worst possible way: two positions in the account, sized as though they were two separate bets, and a single bad afternoon that takes both of them out together. The trade ticket said gold. The other trade ticket said EURUSD. The loss behaved as though there had only ever been one position, in slightly larger size than you would have chosen if anybody had asked you directly.
This is a survival problem rather than a strategy problem, which is why it sits here rather than in a chart-reading article. Nobody blows an account by being wrong once. People blow accounts by being wrong once in three places at the same time, having budgeted for being wrong once in one place.
So rather than repeat the usual line about gold and the dollar being inversely related, this article measures it, on a public data set anyone can download, and then does the arithmetic on what the measurement means for the size of your positions.
The EURUSD vs Gold Correlation, Measured on 6,946 Days
The London Bullion Market Association runs the auction that sets the global benchmark price for gold, and it publishes the full history of that auction free of charge. The record goes back to 1968 in dollars, and from 4 January 1999, the first business day of the euro, it also carries the same auction converted into euros. That is the useful part.
Because each day gives the same ounce of gold priced in both currencies, dividing one by the other recovers the exchange rate used at the moment the auction settled. No second data source, no vendor feed, no assumptions about what time anybody’s day closed. One file, one moment in the day, two currencies.
Running that from 5 January 1999 to 16 September 2026 gives 6,946 consecutive daily observations. Comparing the daily log change in the dollar gold price against the daily log change in that implied EURUSD rate produces a correlation of +0.3946.
Split it and it stays stubbornly in the same place. The last ten years measure +0.3988. The last five measure +0.3629. Taken one calendar year at a time, from 1999 through to the incomplete 2026, the correlation is positive in all 28 years without exception, ranging from a nearly invisible +0.009 in the euro’s first year to +0.741 in 2004. There is not a single year in the record where gold and the euro pulled against each other on balance.
That last point matters more than the headline number. A relationship that averages +0.39 but flips sign every few years is a curiosity. A relationship that has never once closed a year negative in twenty-eight tries is a structural feature of the thing you are trading, and you should size around it.
What a Correlation of 0.39 Actually Says
It is worth being precise here, because correlation is the most over-claimed number in retail trading.
Squaring it gives 0.156. In plain terms, about 15.6 per cent of gold’s day-to-day variation moves together with the euro, and roughly 84 per cent of it does not. Gold is not a proxy for the euro. Anybody who tells you the two are the same trade is overselling it by a wide margin.
Day by day, the two moved in the same direction on 4,542 of the 6,946 days, which is 65.4 per cent of the time. A coin would have given you 50. So the tilt is real, it is modest, and on any individual day it tells you close to nothing. If you were hoping for a trade signal, this is not one, and treating it as one would be a misuse of the number.
The reason to care is not prediction. It is accounting. You are not trying to forecast tomorrow. You are trying to work out how much risk is actually in your account right now, and a mild positive relationship between two positions changes that total quietly, without ever showing up on either trade ticket.
The Average Is Not Where the Damage Is
Here is the part that the headline correlation hides, and the reason a mild-sounding 0.39 is worth an article.
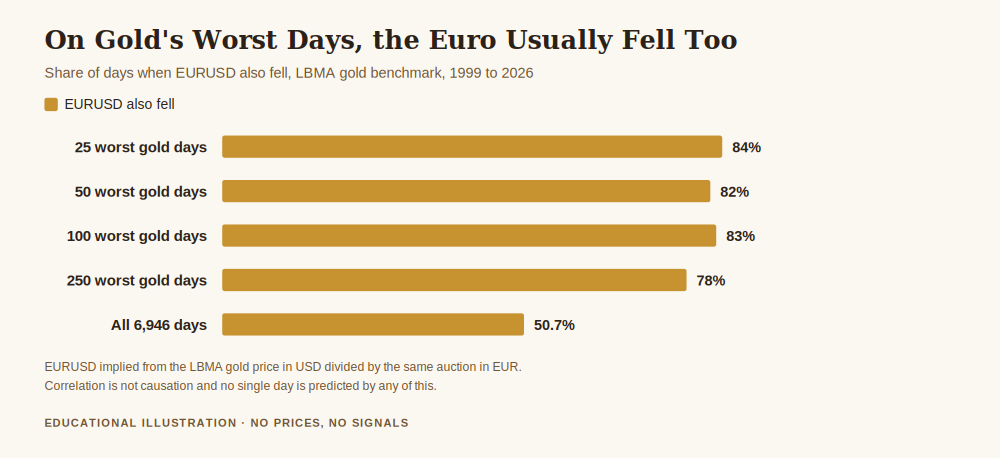
Take the 25 worst days for gold in the whole 6,946-day record and ask what EURUSD did on those same days. It fell on 21 of them, 84 per cent. Widen it to the 50 worst days and the answer is 82 per cent. The 100 worst, 83 per cent. The 250 worst, still 78 per cent.
Against that, on all 6,946 days taken together, EURUSD fell on 50.7 per cent. Essentially a coin toss.
So on an ordinary day, knowing gold is down tells you almost nothing about the euro. On the worst days of the last twenty-seven years, it tells you a great deal. The relationship tightens exactly when your account is already under pressure, which is the single worst behaviour a relationship between two of your positions can have.
This is not unique to gold and the euro. It is the general and unpleasant habit of correlations under stress, and it is why risk that looks diversified in calm conditions so often turns out not to be on the day it counts. The average across all days is the number that comforts you. The tail is the number that empties the account.
What This Does to Your Position Sizing
Now the arithmetic, which is simple enough to do on paper.
Suppose you hold two positions, each sized to risk the same amount, and suppose you have quietly assumed they are independent. Under that assumption, the combined risk is not double a single position. It is the square root of two, about 1.41 times one position, and that is precisely why diversification is worth having in the first place.
Feed the measured relationship in instead. The standard formula for combining two positions is the square root of the first variance plus the second variance plus twice the correlation times both standard deviations. With equal sizes and a correlation of 0.3946, that gives 1.67 times one position, not 1.41.
Which means you are carrying about 18.1 per cent more risk than your independence assumption told you. Not catastrophic. Not nothing either. If your rule is 1 per cent of the account per trade and you are running the two together, your real exposure on that pair is closer to 1.18 per cent of what you thought, every time, silently, forever.
For reference, if the two were perfectly correlated the combined figure would be 2.0, exactly the same as doubling one position. At zero it would be 1.41. At 0.39 you are roughly a third of the way from honest diversification toward simply trading larger.
The fix is not to refuse to hold both. The fix is to know the number and adjust the size deliberately rather than discover it afterwards. Our note on how much to risk per trade sets the per-trade budget, and position sizing for gold turns that budget into lots. Correlation is the step people skip between the two, and it is the step that decides whether the budget you wrote down is the budget you are actually running.
Long Gold and Long Euro Is Closer to One Trade Than Two
Why the two should be related at all is not mysterious. Gold is quoted in dollars. The euro is quoted in dollars. When the dollar weakens against everything, the dollar price of gold tends to rise and EURUSD tends to rise, because the common term in both is the dollar and it is the one that moved. That is a mechanical link before it is an economic one.
You can see the mechanical part in the volatility. Priced in dollars, gold’s daily moves over this period annualise to about 17.40 per cent. Priced in euros, the same ounce of the same metal annualises to about 16.16 per cent, roughly 7 per cent calmer, purely because part of what looks like gold moving is the dollar moving underneath it.
Which gives you a cleaner way to phrase the position you are holding. Buying gold in dollars is partly a view on gold and partly a short dollar position you did not consciously open. Adding a long EURUSD on top is adding a second short dollar position. Two tickets, one underlying opinion, sized as though there were two opinions. Our piece on what moves the price of gold walks through the other drivers that make up the remaining 84 per cent.
What This Argument Is Not
It is not a claim that gold and the euro move together. They move together a bit, most of the time, and more reliably when things are bad.
It is not a hedging instruction. Nothing here says to offset one position with the other, and the numbers above do not support any such rule.
It is not a forecast. A correlation computed over twenty-seven years describes what has happened. Relationships between assets do change, sometimes quickly, and the fact that this one has been positive in every calendar year since 1999 is evidence about the past rather than a guarantee about next Tuesday.
It is not causation either. The dollar explanation above is a plausible mechanism and a common one, and a measured correlation cannot prove a mechanism on its own.
Get the free Gold Empire survival sheet, a one-page guide to protecting your account through the kind of market this article describes, including the combined-risk arithmetic used above. One email, no spam, unsubscribe anytime.
Four Things to Check Before You Hold Both
Count the dollar, not the tickets. Write down every open position and mark which ones are, underneath, a view on the dollar. If more than one is, you have fewer independent bets than lines in your terminal.
Size the pair, not each leg. If your ceiling is 2 per cent across the book, do not put 1 per cent on gold and 1 per cent on EURUSD and call it done. At the measured relationship that pair behaves like about 1.18 per cent on a single view, so decide whether you want that much.
Assume the relationship tightens when it hurts. Plan for the tail figure, not the average. The number that matters on a bad day is 84 per cent, not 39.
Recompute it yourself occasionally. The file is public and the calculation takes a few minutes. A relationship you measured in 2019 is not evidence about the account you are running today.
Frequently asked questions
What is the eurusd vs gold correlation, in one number?
Measured on 6,946 daily observations of the LBMA gold benchmark from January 1999 to September 2026, the correlation between the daily change in dollar gold and the daily change in the implied EURUSD rate is +0.3946. It has been positive in every one of the 28 calendar years in that record.
Does that mean gold goes up when the euro goes up?
More often than not, and not reliably. The two moved in the same direction on 65.4 per cent of days, against 50 per cent for a coin toss. On any single day the relationship is far too weak to trade on, which is why this article treats it as a sizing input rather than a signal.
Is gold just a short dollar position?
Partly. About 15.6 per cent of gold’s daily variation moves with the euro, so roughly 84 per cent of what gold does has nothing to do with the dollar leg. The same ounce priced in euros is about 7 per cent less volatile than priced in dollars, which is one way of seeing how much of gold’s apparent movement is currency.
Should I stop holding gold and EURUSD at the same time?
This article does not tell you what to hold. It tells you that two equally sized positions at this correlation carry about 18.1 per cent more combined risk than they would if they were independent, so that you can set the size knowing that rather than finding out during a bad week.
Why use the LBMA auction instead of a broker’s chart?
Because it is a single published benchmark, set at one moment in the day, available in both dollars and euros from the same source, and free for anyone to download and re-check. A broker feed differs between brokers and cannot be audited by a reader.
Where did the figures in this article come from?
All of them are computed from the LBMA gold price history linked above, checked live before publication. The method: take the PM auction in dollars and in euros, derive the implied EURUSD rate by dividing one by the other, take natural log changes between consecutive auction days, and compute Pearson correlations over the stated windows. The combined-risk figures use the standard two-asset formula with equal position sizes. The annualised volatility figures use the standard deviation of daily log returns multiplied by the square root of 252. Assumptions are stated rather than hidden, and none of this is a price quote, a forecast or a performance claim.
Where Gold Empire Fits
Gold Empire is free to follow. Daily XAU/USD analysis on Telegram, with the reasoning stated before the trade rather than after it, losing days included. There is a free survival sheet for anyone who wants the capital protection material in one place, and an optional Kit for people who want the full method. Nothing here promises a profit and nothing here is a signal service.
Knowing how much risk is really in the account is the whole job. Risk management for gold trading is the pillar this article sits under, how much to risk per trade sets the budget this arithmetic spends, and what moves the price of gold covers the drivers that the dollar leg does not explain. The underlying data is published by the London Bullion Market Association, and the raw auction history used here is the published PM auction file. More about who writes this is on the about page.
About the author. Matthew writes Gold Empire and spends most of his attention on the boring mechanics that decide whether an account is still open in two years. He has a long-standing suspicion of any account that looks diversified on the screen and behaves like one position on the statement. Nothing in this article is a recommendation to trade, and no entry, stop or target discussed should be treated as a signal.
Disclaimer: This article is general educational content about correlation, position sizing and portfolio risk in retail trading. It is not financial advice, not investment advice and not a recommendation to buy, sell or hold any instrument, product or firm. Statistical relationships between markets change over time and past measurement is not a guide to future behaviour. Trading leveraged products carries a substantial risk of loss and most retail accounts lose money. Figures are calculations from the stated public data and stated assumptions, not predictions or performance claims.
One step first
Where should we send the Gold Survival Sheet?
Leave your email and we will send the free one page checklist, then take you straight to the Telegram channel.
No cost and no obligation. Educational only, not financial advice, and nothing here promises a return. Unsubscribe any time in one click.
Leave a Reply