GOLD EMPIRESurvive First, Then Grow

Blog

  • Why Are My Trades Being Rejected on MT5, and What the Code Is Telling You

    Why Are My Trades Being Rejected on MT5, and What the Code Is Telling You

    If you have ever clicked Buy, watched the dialog flash red and close, and then sat there with no position and no explanation, you have asked the question this article answers: why are my trades being rejected on MT5. The honest answer is that the platform did explain, in a number, and that number was on screen for about a second before the box disappeared.

    MetaTrader 5 does not refuse orders at random. Every request you send to the trade server comes back with a return code, and MetaQuotes publishes the whole list. There are 41 of them. Most describe success or a technical fault, and a small handful account for nearly every rejection a retail gold trader will meet. Learning those few is a twenty minute job that saves years of guessing, and more to the point, two of them are the account warning you about something that matters long before the balance does.

    Everything below is either read from the official code list or computed from published margin rules, with the arithmetic shown. There are no gold prices in this article, and nothing here is a view on where price is going.

    Why are my trades being rejected on MT5, in one sentence

    Because the trade server ran a check before accepting the order, the order failed that check, and the server sent back the code for the check it failed.

    That is worth sitting with, because it reframes the problem. A rejection is not the platform being broken or the broker being hostile. It is a pre trade test, and the test result is information you asked for without realising it. The platform is strict about this on purpose: an order that cannot be funded, or whose stop sits inside a forbidden distance, is better refused at the door than accepted and then unwound.

    The codes live in the trade server return code list in the MQL5 documentation, which is MetaQuotes’ own reference rather than a forum summary. If you only ever read one page about your platform, read that one.

    The six codes that cover almost everything

    Out of the 41 published codes, these are the ones that actually appear in a retail gold account, with the descriptions as the documentation words them.

    10019, TRADE_RETCODE_NO_MONEY. “There is not enough money to complete the request.” This is the big one, and the rest of this article is largely about it.

    10016, TRADE_RETCODE_INVALID_STOPS. “Invalid stops in the request.” Your stop loss or take profit sits closer to the current price than the symbol’s minimum allowed distance, or on the wrong side of it entirely. Gold often carries a wider minimum distance than a currency pair does, which is why the same stop distance that worked on EURUSD is refused on XAUUSD.

    10014, TRADE_RETCODE_INVALID_VOLUME. “Invalid volume in the request.” The lot size is below the symbol minimum, above its maximum, or not a multiple of the step. A size calculated to three decimal places on a symbol that steps in hundredths will be refused.

    10018, TRADE_RETCODE_MARKET_CLOSED. “Market is closed.” Gold has a daily break and a weekend. The chart still shows the last candle, which makes a closed market look like an open one.

    10015, TRADE_RETCODE_INVALID_PRICE and 10021, TRADE_RETCODE_PRICE_OFF. “Invalid price in the request” and “there are no quotes to process the request.” These cluster around the minutes when a release lands and the spread blows out. The price you clicked is already gone.

    10004, TRADE_RETCODE_REQUOTE. A requote rather than a flat refusal, and a normal response to a fast market on an execution model that offers you the new price instead of filling you at a stale one.

    Two more are worth recognising because they look like faults and are not. 10027, TRADE_RETCODE_CLIENT_DISABLES_AT, means autotrading is switched off in your own terminal, the button at the top. 10026 is the same thing disabled at the server end. Neither is a market problem, and 10027 in particular wastes a lot of people’s mornings.

    The code that is not a technical problem

    Five of those six are configuration or timing. Fix the stop distance, round the lot size, wait for the session, and they go away.

    10019 is different in kind. “Not enough money” is not a setting you got wrong, it is a statement about the state of your account relative to the position you already hold, and it tends to arrive at the exact moment people are least inclined to read it carefully, which is while an existing trade is going against them and they want to add.

    Here is the mechanism, in the order the platform applies it. Your equity is the balance plus or minus the profit on open positions. Your used margin is what the open positions have locked up. Free margin is equity minus used margin, and free margin is what a new order is checked against. Crucially, equity moves with the market, and used margin does not. So an adverse move does not merely cost you money on paper, it eats the capacity to do anything else.

    How far the market has to move before MT5 starts refusing you

    This can be computed exactly, so let us compute it rather than describe it.

    Take an account funded with twice the initial margin of a single gold position, which is a reasonable, not especially reckless, starting point. The initial margin as a share of the position’s notional value is one hundred divided by the leverage. At the European retail cap for gold of 20:1, that is 5 per cent.

    Free margin reaches zero when the loss on the open position equals the spare margin, which in this case is one times the initial margin. That means an adverse move of 5 per cent of notional at 20:1. From that point MT5 returns 10019 for anything new you try to open.

    Keep going and you reach the close out. Under the ESMA product intervention measures agreed on 27 March 2018, a provider must close a retail client’s positions when equity falls to 50 per cent of the initial required margin. On the same account that is an adverse move of 7.5 per cent of notional.
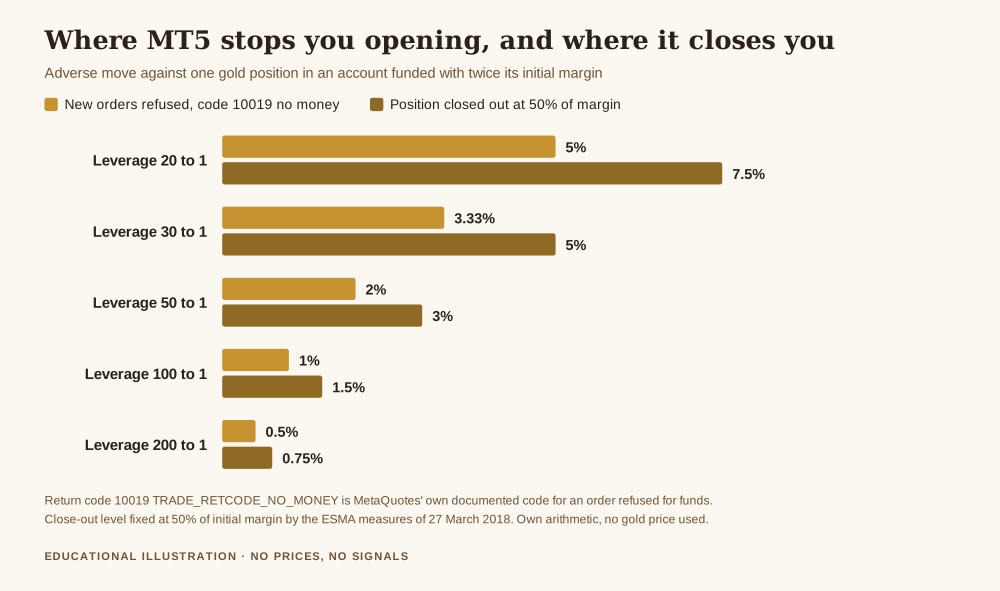
    Why are my trades being rejected on MT5, chart of the adverse move at which MT5 refuses new orders with code 10019 and the larger move at which the broker closes the position, by leverage
    Why are my trades being rejected on MT5: the first bar is where new orders start coming back as code 10019, and the second is where the position is closed for you.

    Read the gap between the two bars, because the gap is the whole point. At 20:1 you get 2.5 percentage points of warning between the first refusal and the forced close. At 200:1 you get a quarter of a point. The rejection is an early warning system whose lead time shrinks with leverage, and at high leverage it effectively stops being a warning at all.

    The assumptions are stated so you can check them: one position, an account funded with twice its initial margin, no swap and no commission, and moves measured as a percentage of the position’s notional value rather than as a price. Costs make the thresholds arrive sooner, never later. The numbers come from the ESMA close out rule and ordinary arithmetic, not from anybody’s forecast.

    What that code is actually telling you

    So when the platform says there is not enough money, it is reporting something more useful than a failed click. It is telling you that your existing position has consumed your reserve, and that you are now closer to the close out than to a fresh start.

    Which makes the common reaction, reducing the lot size until something finally goes through, the exact wrong move. A smaller order squeezed through on the last of your free margin does not reduce risk. It adds a second position to an account that has already told you it is out of capacity, and it brings the close out nearer for both.

    The useful reaction is to treat 10019 as a stop sign with a number attached. Nothing about the rejected order needs fixing. What needs attention is the position already open, and the only two things that genuinely help are reducing that position or adding funds, with the first being the one you control immediately. If you want the fuller version of what happens when neither occurs, I wrote it up in what a blown trading account actually means, which traces the same arithmetic to its end.

    Reading the number instead of the red box

    MT5 does show you the code, it just shows it briefly and in small type. There are two reliable places to find it after the fact.

    The Journal tab at the bottom of the terminal, next to Trade and History, logs every request and every server response with its code and timestamp. The Experts tab does the same for anything sent by an automated system. Neither clears when the dialog does, so when an order vanishes without explanation, that is where the explanation is sitting.

    The habit worth building is simple. When something is refused, do not click again. Open the Journal, read the number, and look it up. The second click is how a configuration problem becomes a position you did not plan, especially when the first failure was a requote and the price has moved in between.

    If your gold symbol is missing from Market Watch entirely, that is a different and more boring problem, and adding XAUUSD in MT5 covers it.

    The rejections you should want

    It is worth saying plainly that most of these refusals are the platform doing you a favour.

    Invalid stops means your stop was too close to price to be accepted. Had it been accepted, it would have been the first thing taken out by ordinary noise. Invalid volume usually means a position size calculator produced a figure the symbol cannot trade, and rounding it yourself in a hurry is how people end up with ten times the size they intended. Market closed means the thing you were about to react to happened when nobody could act on it, which is information about the news, not about your platform.

    And 10019 means the account is nearer the edge than you thought. A trader who has read the risk management guide and keeps position sizes small enough that free margin is never the binding constraint will see this code roughly never. That is not a coincidence, it is the definition of having room.

    What this article does not say

    It does not say the thresholds above apply to your account. Leverage caps differ by jurisdiction, brokers may set a close out level stricter than the regulatory floor, and some set margin requirements that rise as position size grows. The arithmetic is general, the inputs are yours, and your broker’s terms are the ones that bind.

    It does not say a rejection is always benign. Repeated unexplained refusals during normal, liquid hours, especially alongside withdrawal delays, are a different kind of signal, and the place to start is the broker rather than the platform. Choosing that broker carefully in the first place is the cheapest protection available, which is why how to pick a broker for gold trading exists.

    And it does not tell you what size to trade or when. That is not what this channel does.

    Free gold survival sheet

    Get the free Gold Empire survival sheet, a one-page guide to protecting your account through the kind of market this article describes. One email, no spam, unsubscribe anytime.

    Get the free survival sheet →

    Frequently asked questions

    Why are my trades being rejected on MT5 when I have money in the account?

    Because the check is against free margin, not balance. Free margin is equity minus the margin your open positions have locked up, and an open loss reduces equity while leaving used margin unchanged. An account can show a healthy balance and still have nothing available to open with. Code 10019 is reporting the second number, not the first.

    What does error 10019 mean in MT5?

    TRADE_RETCODE_NO_MONEY, which MetaQuotes documents as “there is not enough money to complete the request”. It means the trade server refused the order because free margin did not cover what the new position required.

    Why does MT5 reject my stop loss?

    Code 10016, invalid stops, means the stop sits closer to the current price than the symbol’s minimum permitted distance, or on the wrong side of price for the order type. Gold commonly has a wider minimum distance than major currency pairs, so a stop that is acceptable on one symbol can be refused on another in the same terminal.

    Is a rejected order the same as a failed order?

    No. A rejection happens before anything is opened, so no position exists and no money has moved. That is different from an order that is accepted and then filled at a worse price than you clicked, which is a fill problem rather than a rejection. I covered that case separately in what happens when a market order is not filled at your price.

    Should I lower my lot size until the order is accepted?

    That is the most common response and the one most likely to hurt. If free margin is the binding constraint, the message is about the position you already have. Opening a smaller second position on the last of your available margin moves the close out level closer rather than further away.

    Where do I see the actual rejection code?

    The Journal tab in the terminal window logs every request and the server’s response, with the code and a timestamp, and the Experts tab does the same for automated orders. Both keep their history after the pop up disappears.

    What Gold Empire actually does

    Gold Empire is a free channel about surviving in gold rather than getting rich in it. There is no signal service here and nothing is sold on the promise of a return. The free Gold Survival Sheet is a single page on protecting an account, and the only thing it asks for is an email address you can unsubscribe from in one click. Everything else, including the risk management guide and how much to risk per trade, is simply published.

    The model is deliberate. Follow along for free, check the arithmetic yourself, and decide on your own. If a piece of writing ever makes you feel you must act this minute, that is a reason to distrust the writing, mine included.

    About the author

    Matthew writes Gold Empire. He spent a long time believing that a rejected order was the platform misbehaving, and only read the return code list after a morning of clicking Buy at a market that had been closed for six hours. He now treats a refusal as the cheapest message an account ever sends, because it arrives before the money does. You can read more about the approach on the about page.


    This article is educational and is not financial advice. Trading gold carries a high risk of losing money rapidly, and no entry, stop or target discussed should be treated as a signal. The return codes, their numbers and their descriptions are quoted from MetaQuotes’ published MQL5 trade server return code documentation, and the 20:1 retail leverage cap for gold and the close out at 50 per cent of initial margin are quoted from the European Securities and Markets Authority’s product intervention measures agreed on 27 March 2018, both as linked. The margin thresholds are my own arithmetic from those published rules, with the assumptions stated in the text, and they exclude swap and commission. Your own broker’s terms and your own jurisdiction govern your account. Decide your own risk, and never trade money you cannot afford to lose.


  • What Is GDP in Gold Trading, and Why the First Number Is the Least Reliable

    What Is GDP in Gold Trading, and Why the First Number Is the Least Reliable

    If you have been trading gold through news events for any length of time, you have met the big three: inflation, payrolls and the Fed. GDP sits slightly outside that club, which is why people ask what is GDP in gold trading and then quietly skip it. It arrives less often, it moves gold less violently than a payrolls surprise, and it feels like something for economists rather than traders.

    I want to make a narrower case for paying attention to it, and it is not the one you would expect. GDP is worth understanding less because of what it tells you about the economy and more because of what it tells you about the reliability of economic numbers in general. It is the clearest published example of a figure that markets react to instantly and that the issuing agency itself revises substantially afterwards.

    Every figure below comes from the Bureau of Economic Analysis, which produces the number, or is worked out by me from BEA’s published figures with the assumption stated. There are no prices here and no forecasts.

    What is GDP in gold trading, in plain terms

    Gross domestic product is the total value of everything an economy produces in a period, reported in the United States as an annualised quarterly percentage change. Real GDP strips out inflation. Current-dollar GDP does not.

    Gold has no earnings, no coupon and no dividend. Holding it costs you whatever you could have earned risk free instead. That is the whole mechanism, and everything else is downstream of it. So gold does not react to output as such. It reacts to what output implies about interest rates.

    The chain runs like this. Strong GDP suggests an economy that can tolerate tighter policy, which argues for higher rates, which raises the opportunity cost of holding a metal that pays you nothing. Weak GDP argues the other way. GDP is therefore an input to the rate decision, and the rate decision is what gold is really pricing. If you want that chain laid out properly, the piece on what the FOMC is and why gold reacts covers the end of it.

    This is also why GDP tends to move gold less than CPI or payrolls. By the time GDP is published, most of the quarter it describes has already been reported piece by piece through monthly data. The market has largely assembled the answer before the official total arrives.

    One quarter, three different numbers

    Here is the part most traders genuinely do not know, and it is the reason this article exists. BEA does not publish one GDP figure per quarter. It publishes three, and then keeps revising.

    The advance estimate comes out near the end of the first month after the quarter ends. BEA is explicit that it rests on source data that are incomplete or still subject to change by the agencies supplying them. The second estimate follows near the end of the next month, and the third near the end of the month after that. Then annual updates, released in late September, revisit at least the five most recent years, and comprehensive updates roughly every five years rework methods and definitions.

    So the number that hits your screen and moves the market is the advance estimate: the earliest, thinnest, least complete of the set. The one that will still be correct in five years is published long after anybody has stopped looking.

    How much the first number actually moves

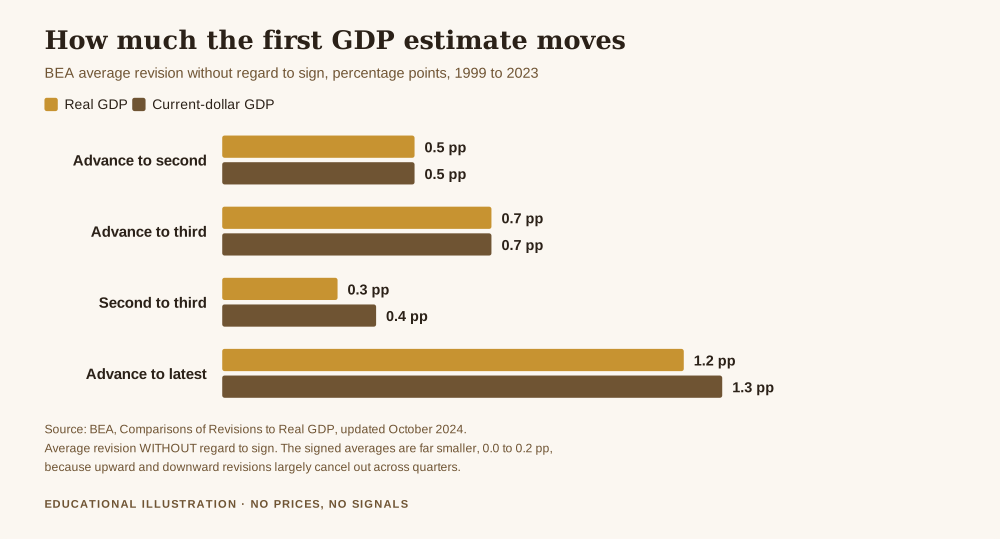
    BEA publishes its own scorecard on this, which is a creditable thing for a statistical agency to do. Its comparison of revisions to real GDP, covering 1999 through 2023, gives the average revision to quarterly real GDP growth between each pair of estimates.

    Bar chart for what is GDP in gold trading, showing BEA average GDP revisions without regard to sign, 0.5 points from advance to second, 0.7 to the third estimate and 1.2 points to the latest
    What is GDP in gold trading worth as a precise figure? The average revision from the advance estimate grows the longer BEA keeps working on it.

    From advance to second, real GDP growth is revised by an average of 0.5 percentage points without regard to sign. From advance to third, 0.7 points. From advance to the latest estimate, after annual and comprehensive updates have done their work, 1.2 points. Current-dollar GDP behaves similarly, at 0.5, 0.7 and 1.3.

    Two details in that table deserve more attention than they usually get.

    First, the signed averages are tiny: 0.1 points from advance to second, 0.1 to third, 0.1 to latest. Revisions are not biased in one direction. They go up about as often as they go down, which is exactly why you cannot “trade the revision” by assuming the first print is systematically too high or too low. There is no free direction in it.

    Second, most of the early correction lands quickly. The second to third revision averages only 0.3 points, which is 43 per cent of the advance to third figure, so the bulk of the near term repair happens at the second estimate rather than the third. The slow, large part comes much later, in the annual and comprehensive updates.

    What that looks like next to the headline

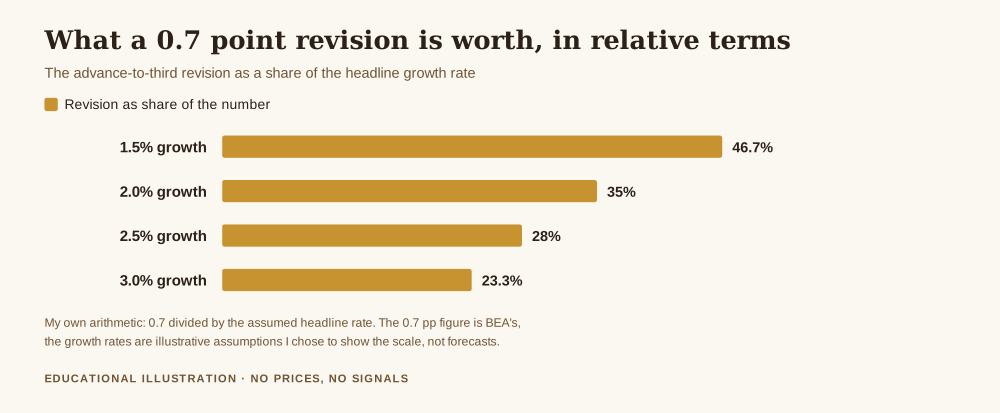
    A 0.7 percentage point revision sounds modest until you put it beside the number being revised.

    Bar chart relevant to what is GDP in gold trading, showing a 0.7 point GDP revision as a share of the headline growth rate, 46.7 per cent at 1.5 per cent growth and 23.3 per cent at 3.0 per cent growth
    The same 0.7 point revision, measured against the number it is revising. The growth rates are illustrative assumptions, not forecasts.

    If the economy is growing at 2.0 per cent, a 0.7 point average revision is 35 per cent of the figure. At 2.5 per cent growth it is 28 per cent. At 1.5 per cent it is nearly half the number. I want to be clear that the growth rates there are illustrative values I picked to show the scale; only the 0.7 is BEA’s. But the point holds at any plausible rate: the typical revision is a large fraction of the headline, not a rounding adjustment.

    Put plainly, the market reacts within milliseconds to a figure whose own producer expects to move it by roughly a third of its value.

    What the advance estimate does get right

    It would be lazy to stop there, because the same BEA document makes the case for the other side, and it is a strong one.

    The direction of change between the advance and latest estimates matches 97 per cent of the time for real GDP. And the estimates correctly indicate whether growth is above, near or below trend 92 per cent of the time.

    That is the honest resolution. The advance estimate is imprecise about magnitude and very reliable about direction. It is a good answer to “is the economy speeding up or slowing down” and a poor answer to “by exactly how much”.

    Worth knowing what those percentages mean in practice. A 3 per cent direction failure is about one quarter in 33, or roughly one every eight years. The 8 per cent trend misclassification is about one quarter in 12 or 13, which is closer to one every three years. Those are my divisions of BEA’s percentages. Rare, but not never, and the one that goes wrong will not announce itself on the day.

    Why the least settled number is the one that moves gold most

    Now the structural problem, which is the real reason a gold trader should care.

    Of the three estimates, the advance is the one the market trades. By the second estimate the surprise is largely priced, and the third barely registers. So the release that generates the most order flow, the widest spreads and the fastest moves is precisely the one built on the most incomplete data.

    That is not a conspiracy. It is a scheduling fact with an uncomfortable consequence: you take your largest execution risk on the least reliable version of the number, and the correction arrives on a day when nobody is positioned for it.

    I should say clearly what I cannot show you. I do not have execution quality data for gold around GDP releases, so I am not going to quote a spread widening figure or a slippage estimate. That the market moves around scheduled releases is well established and the general case is covered in how to trade gold through high impact news. The specific size of the effect at a GDP print is something I have not measured, and I would rather say so than put a number on it.

    What actually protects you

    The useful conclusion is not a strategy for trading GDP. It is a change in how much weight you let any single release carry.

    If a number that its own publisher revises by an average of 0.7 points can decide whether your account survives the week, the problem is not the number. It is the size of the position standing in front of it. A revision of that scale is ordinary and expected. A position that cannot absorb an ordinary, expected event is simply too large.

    So the order of operations is the same as everywhere else on this site: fix the sizing first, then worry about the calendar. A trader sized properly can be wrong about GDP and still be trading next month. A trader sized badly can be right and still not make it, because the move went the wrong way first. That argument in full is in risk management for gold trading, which is the piece everything else here sits on top of.

    And if you want the two releases that do move gold harder than this one, they are CPI and nonfarm payrolls.

    Free gold survival sheet

    Get the free Gold Empire survival sheet, a one page guide to sizing a position so that a scheduled release stops being the thing that decides your month. One email, no spam, unsubscribe anytime.

    Get the free survival sheet →

    Frequently asked questions

    What is GDP in gold trading, in one sentence?

    It is the total output of an economy, which matters to gold only because it feeds the interest rate outlook, and interest rates set the opportunity cost of holding an asset that pays you nothing.

    Which GDP release should I watch?

    The advance estimate, because that is the one the market trades. Just hold it loosely. It is the least complete of the three, and BEA revises it by an average of 0.7 percentage points by the third estimate and 1.2 points by the final version.

    Does strong GDP always push gold down?

    No, and anyone promising that relationship is overselling it. The usual logic is that strong growth supports higher rates and higher rates weigh on gold, but it depends entirely on what was already priced and on what the figure implies for the rate path rather than for growth itself. Strong GDP alongside falling inflation can read as good news for everything. The direction of the surprise relative to expectations matters far more than whether the number itself is high or low.

    Why does GDP move gold less than CPI?

    Because it is largely old news by the time it lands. The quarter it describes has already been reported through monthly data on retail sales, trade, construction and the rest, so the market has assembled most of the answer in advance. Inflation data arrives with much less of it already known.

    If the first number gets revised so much, why does anybody trade it?

    Because it is still the best available information at that moment, and because direction is what mostly matters. BEA’s own figures show the advance estimate gets the direction of change right 97 per cent of the time and places growth correctly against trend 92 per cent of the time. It is imprecise, not uninformative. The mistake is treating a figure that is reliable about direction as though it were precise about magnitude.

    Where Gold Empire fits

    Gold Empire is a free journal about surviving long enough in gold to get good at it. There is no signal service here, nothing is sold on a promise of returns, and I have no arrangement with any broker that depends on you opening an account. The free survival sheet is one page about position sizing, which is the lever that makes most of the other questions smaller. If you want the piece underneath all of it, read risk management for gold trading.

    About the author. Matthew writes Gold Empire. He went looking for how far a GDP print typically gets revised, expecting to find nothing published, and instead found the agency’s own table saying the average correction is roughly a third of the figure everyone trades. He has treated first prints differently ever since. He is more interested in what survives a bad month than what wins a good one.


    This article is educational and is not financial advice. Trading gold and leveraged products carries a substantial risk of loss and is not suitable for everyone, and no entry, stop or target discussed should be treated as a signal. The revision averages, the 97 per cent direction figure and the 92 per cent trend figure are quoted from the Bureau of Economic Analysis publication Comparisons of Revisions to Real GDP, updated October 2024, covering 1999 through 2023. The relative shares, the per quarter frequencies and the comparison between revision sizes are my own arithmetic from those published figures, with the illustrative growth rates labelled as assumptions in the text. Decide your own risk, and never trade money you cannot afford to lose.


  • What Is A Book and B Book in Forex, and Which One Are You On?

    What Is A Book and B Book in Forex, and Which One Are You On?

    If you have ever wondered what is a book and b book in forex, you were really asking a simpler question: when I click buy, who is on the other side? Most traders never find out. The answer is not hidden exactly, it is just filed under a heading nobody reads, and it quietly decides whether your broker is paid for your activity or paid for your mistakes.

    I want to be careful here, because this topic attracts two kinds of nonsense. One says every broker is a criminal running a rigged casino. The other says the whole thing is a conspiracy theory and you should stop worrying. Neither is true, and both are convenient for somebody. The honest version is duller: there are two ways a broker can handle your order, both are legal, both are used by serious firms, and they create different incentives. Knowing which one you are on is part of surviving.

    Every figure in this article is either quoted from a regulator’s own document or worked out by me from assumptions I state as I go. There are no prices here and no forecasts.

    What is a book and b book in forex, in plain terms

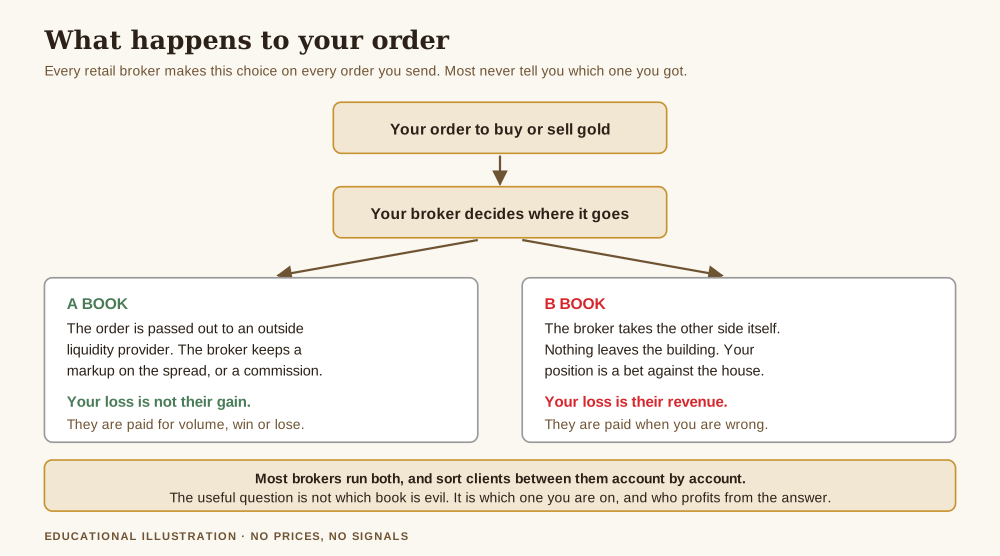
    When your order reaches your broker, the firm has a choice. It can pass the risk out to somebody else, or it can keep it.

    Passing it out is called putting you on the A book. The broker sends a matching order to a liquidity provider, usually a bank or a larger non bank market maker. Now the broker holds no market risk. If gold runs, the liquidity provider pays, and the liquidity provider has its own hedge. The broker earns the difference between the price it got and the price it gave you, or a separate commission, or both. It is paid for your volume. It does not care whether you were right.

    Keeping it is called putting you on the B book. The broker does not send anything anywhere. It writes the other side of your trade itself. Your buy is its sell. Nothing leaves the building. If gold runs and you were long, the broker pays you out of its own pocket. If gold falls, your loss stays with the firm as revenue.

    Diagram explaining what is a book and b book in forex, showing an order routed to a liquidity provider on the A book or kept in house on the B book
    What is a book and b book in forex, drawn as the decision your broker makes on every order. The A book earns a markup on volume. The B book earns your loss.

    The terms come from old bookmaking language, where a bookmaker laid off some bets with other bookmakers and kept the rest. The vocabulary survived into retail trading because the structure is the same.

    Here is the part people miss. Almost no broker is purely one or the other. Most run a hybrid, sorting clients between the two books, often automatically, often by a scoring system that watches how you trade. Consistently profitable accounts tend to get routed out to the A book, because the firm does not want to be the counterparty to someone who keeps winning. Accounts that lose tend to stay internalised. That sorting is not announced to you, and in most jurisdictions it does not have to be.

    Why this is a conflict and not a scandal

    A B book is not fraud. A firm taking the other side of a client trade is doing what a market maker has always done, and there is a genuine service in it. Internalising orders lets a broker offer tighter pricing on small trade sizes than it could get by sending every one of them out to a bank, because banks do not want a stream of tiny orders and will price accordingly. If you trade a fraction of a lot, somebody internalising that flow is the reason your cost is not absurd.

    The problem is not the model. The problem is the incentive that sits inside the model when the client loses reliably. If my revenue is your loss, then every feature of the service that makes you lose faster is, in the short term, good for me. Higher leverage. A platform that makes it easy to add to a losing position. A marketing budget aimed at people who have never traded. None of that requires anyone to cheat. It only requires a firm to be slightly less diligent about things that happen to be profitable.

    This is why the question is worth your attention even though the honest answer is “it depends”. You are not looking for a villain. You are looking at whether the business model of the firm holding your money is aligned with you lasting a long time, or not.

    The number that makes the conflict concrete

    Regulators have measured this, which saves us from guessing.

    When the European Securities and Markets Authority introduced its restrictions on contracts for difference, it published what national regulators had found across the member states. Their analyses showed that 74 to 89 per cent of retail accounts typically lose money, with average losses per client ranging from 1,600 to 29,000 euros. That is ESMA’s own wording in its announcement of 27 March 2018.

    Sit with that range for a second, then do the arithmetic on a dealing book.

    Take 100 retail accounts. Assume the low end of ESMA’s own average loss figure, 1,600 euros, and apply it to each losing account. At the bottom of the range, 74 accounts lose, which is 118,400 euros. At the top of the range, 89 accounts lose, which is 142,400 euros. So a hundred ordinary retail accounts generate somewhere between 118,400 and 142,400 euros of client losses, using the regulator’s most conservative loss figure.

    Those assumptions are deliberately crude and I want to name them: I have applied the lowest average loss in ESMA’s range to every losing account, I have ignored what the winning accounts get paid, and I have treated a published range as though it applies evenly to any one firm’s book. The real number for any particular broker will differ. The point is not precision. The point is the order of magnitude, and the direction it points in.

    Now compare that with being paid for volume instead. Suppose an agency style broker earns a markup of six euros per round turn lot. That figure is illustrative, not any firm’s published rate. To earn what one single average losing client hands over, that broker needs 1,600 divided by 6, which is about 267 round turn lots of routed volume. One losing client equals roughly 267 lots of somebody else’s hard work.

    That is the whole conflict in one line. It is much faster to be paid by a client who loses than by a client who trades.

    What the regulator did about it

    ESMA’s response is instructive, because it tells you which part of the structure it judged most dangerous. It did not ban the B book. It went after leverage.

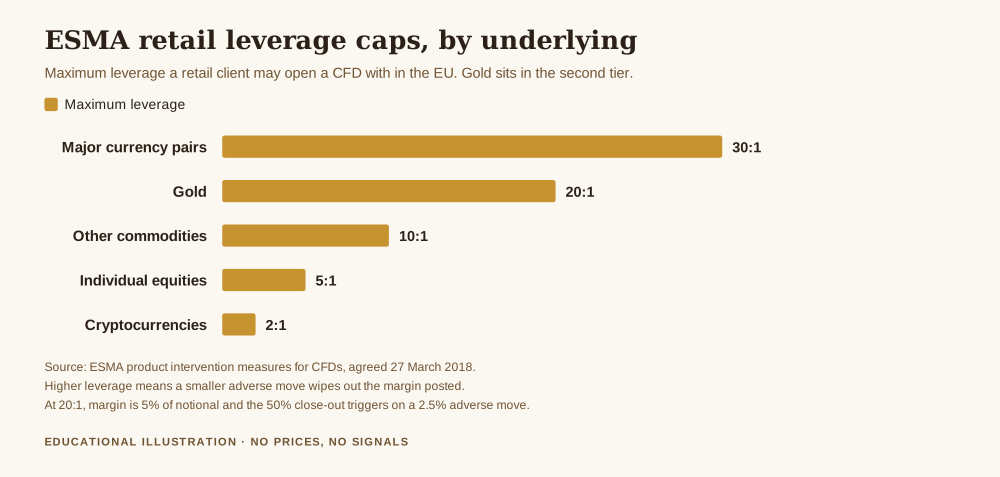
    Bar chart of ESMA retail leverage caps by asset class, relevant to what is a book and b book in forex, with gold capped at 20 to 1
    ESMA capped retail leverage by how volatile the underlying is. Gold sits at 20:1, which is the tier that matters if you trade XAUUSD.

    The caps, taken from ESMA’s own note on the agreed measures, run from 30:1 down to 2:1 according to the volatility of the underlying. Major currency pairs got 30:1. Gold sits in the second tier at 20:1, alongside non major currency pairs and major indices. Commodities other than gold got 10:1, individual equities 5:1, and cryptocurrencies 2:1.

    Work out what 20:1 means and the logic becomes obvious. At 20:1 the margin you post is 100 divided by 20, which is 5 per cent of the notional value of the position. That means a 5 per cent adverse move in the underlying wipes out every cent of the margin backing it.

    ESMA then added a margin close out rule at 50 per cent of the minimum initial required margin. Half of 5 per cent is 2.5 per cent. So on a fully leveraged gold position, a 2.5 per cent move against you is enough to trigger the close out. Not a crash. Not a black swan. A moderately busy afternoon.

    The third measure was negative balance protection on a per account basis, which limits what you can lose to the funds in the account. Before that rule existed, a bad gap could leave a retail client owing the broker money. If you want the uncomfortable version of what happens when that protection is missing, read what happens if your forex broker goes bust.

    Notice what the regulator concluded. The most effective lever was not forbidding brokers from taking the other side. It was reducing how fast a retail client can be destroyed. That is a judgement about where the real damage comes from, and it is worth copying into your own thinking.

    How to tell which book you are on

    You usually cannot, not with certainty, and I would be lying if I told you otherwise. But you can narrow it down.

    Read what the firm calls itself in its legal documents, not its adverts. Terms like “dealing on own account” or “matched principal” in the licence disclosures tell you the firm is permitted to be your counterparty. “Agency only” or “straight through processing” points the other way. The marketing page is not evidence. The regulatory disclosure is.

    Look at how it is paid. A raw spread account with a visible per lot commission is a structure that only makes sense if the firm is earning from volume. A zero commission account with a wider spread can be either. Neither proves anything on its own, but the first is at least consistent with an agency model. If the pricing model itself is unfamiliar, how the spread works in gold is the thing to understand first.

    Check the regulator, not the website. Every serious jurisdiction publishes a register. The entity named in your account agreement should appear in it, under that exact name, with permissions that match what it is doing. A firm operating through an offshore entity while advertising a European licence is telling you something important.

    Notice what changes when you do well. This one is anecdotal and I offer it as such. Traders who become consistent sometimes report that their execution changes character, with more frequent requotes or slower fills. That can be routing being switched. It can also be coincidence, or their own size growing. Treat it as a prompt to look harder, not as proof.

    If you are choosing a firm from scratch rather than auditing one you already use, the practical checklist is in how to pick a broker for gold trading, and the account opening mechanics are in how to open a gold trading account.

    What actually protects you

    Here is the part I most want you to take away, and it will sound anticlimactic after all that.

    Finding a pure A book broker would not save an account that is sized wrong. The ESMA figure, 74 to 89 per cent of retail accounts losing, was measured across the whole European market, including firms operating under some of the strictest rules in the world. Those clients had negative balance protection, capped leverage and a margin close out rule, and most of them still lost. Structure was not the binding constraint. Behaviour was.

    A broker with a conflict of interest can only harm you through the gap you leave open. If you trade at a size where a 2.5 per cent move ends your position, you have handed the outcome to whoever is on the other side, and it stops mattering very much who that is. If you trade at a size where a 2.5 per cent move is an inconvenience, the conflict shrinks to a cost question, which is a question you can shop around on.

    So the order of operations is: fix the sizing, then audit the counterparty. Not the reverse. The full version of that argument is in risk management for gold trading, which is the piece everything else here sits on top of.

    Free gold survival sheet

    Get the free Gold Empire survival sheet, a one page guide to sizing a position so that who is on the other side of it stops being the thing that decides your month. One email, no spam, unsubscribe anytime.

    Get the free survival sheet →

    Frequently asked questions

    Is the B book illegal?

    No. Acting as principal against a client is a licensed activity in every major jurisdiction, and firms that do it hold permissions that say so. What is regulated is disclosure, capital adequacy, execution quality and the treatment of client money. A firm can run a B book and be entirely compliant. A firm can also run an A book and treat you badly on cost. The model is not the measure of honesty.

    If my broker is on the other side, does it move the price to hit my stop?

    On a regulated venue this is far less common than the internet suggests, and firms get caught when they do it, because execution data is auditable and regulators look at it. The more realistic risk is mundane: slightly worse fills, slightly wider spreads at busy moments, and a platform built to encourage activity. Those cost you steadily rather than dramatically. If your stop keeps getting hit, the likelier explanation is that it was placed where everybody else put theirs, which is a different problem with a different fix.

    Does an ECN account guarantee I am on the A book?

    No, and the label is used loosely. Some firms use it to mean genuine access to a pool of competing liquidity providers, and some use it to mean a pricing structure with a commission attached. The permissions in the regulatory register tell you more than the account name does. The distinction is worth reading properly in what an ECN broker actually is.

    Should I move to a broker that advertises no dealing desk?

    Only if the rest of it stacks up. A firm’s routing model is one input alongside its regulator, how client money is held, its cost structure and whether it has negative balance protection. Switching to a firm with a better sounding model but a weaker licence is a downgrade wearing the right word. And no change of broker fixes a position that is too large, which is the thing that ends most accounts.

    Why does ESMA give a range of 74 to 89 per cent rather than one number?

    Because the figure came from separate analyses by different national regulators, covering different markets and periods, so ESMA reported the span rather than inventing a false average. Under the same rules each provider must publish its own specific loss percentage, which is why you see a precise figure on individual broker websites. Firms that could not compute their own were required to show the 74 to 89 per cent range instead.

    Where Gold Empire fits

    Gold Empire is a free journal about surviving long enough in gold to get good at it. There is no signal service here, nothing is sold on a promise of returns, and I have no arrangement with any broker that depends on you opening an account. The free survival sheet is one page about position sizing, which is the lever that makes most of the other questions smaller. If you want the piece underneath all of it, read risk management for gold trading.

    About the author. Matthew writes Gold Empire. He went looking for his own broker’s regulatory disclosure after a conversation with someone who insisted the whole industry was rigged, found a dull two line permission that answered the question in about forty seconds, and has recommended the exercise ever since. He is more interested in what survives a bad month than what wins a good one.


    This article is educational and is not financial advice. Trading gold and leveraged products carries a substantial risk of loss and is not suitable for everyone. Nothing here is a recommendation to use or avoid any particular firm, and no entry, stop or target discussed should be treated as a signal. Figures quoted from ESMA are reproduced from its published documents; figures I have computed are labelled as such, with the assumptions stated. Do your own checks on any firm before you send it money.


  • How Do I Complain About a Broker, and What Actually Gets Money Back

    How Do I Complain About a Broker, and What Actually Gets Money Back

    How do I complain about a broker is a question that arrives in my inbox in two very different states, and the answer depends entirely on which one you are in. Sometimes a trader is angry about something the broker is contractually entitled to do, and the complaint will go nowhere because there is nothing to complain about. Sometimes money has actually been taken, and the person is about to spend three weeks writing polite emails during the only window in which that money could have been frozen. Telling those apart in the first hour is the whole game.

    So this is not a guide to writing a strongly worded letter. It is a guide to working out what happened, choosing the route that matches it, and moving at the speed that route rewards. I have included the published recovery figures, because they make the argument for urgency better than I can.

    First, sort what happened into one of three boxes

    Before you write anything, decide which of these you are dealing with. They have different routes and different odds.

    One, a term you agreed to. The requirement was raised, the swap was charged, the weekend gap moved through your stop, the spread widened around a release. These feel like injustices and are almost never complaints, because the behaviour is in the contract you accepted. If this is your box, the useful action is to read the terms properly and decide whether you want to stay, not to file anything.

    Two, a service failure. The platform was down while you held a position, a withdrawal has sat unprocessed past the published timescale, an order was handled contrary to the firm’s stated policy, or support has stopped answering. This is a genuine complaint, it goes through the firm’s complaints procedure first, and it can escalate to the regulator or an ombudsman scheme afterwards.

    Three, fraud. The firm was never what it claimed, the withdrawal was refused with escalating demands for fees or taxes, the account statement does not correspond to anything real, or the entity has gone quiet. This is not a complaint at all. It is a crime report, and the clock on it is measured in hours rather than weeks.

    Most of the damage I see comes from people in box three behaving as though they are in box two, working patiently through a complaints procedure at an organisation that has no intention of answering, while the money moves.

    Why the speed matters so much in box three

    This is the part worth internalising even if you never need it. When funds are reported fast enough, they can sometimes be frozen before they are gone, and there is a published record of how often that works.

    The FBI’s Internet Crime Complaint Center runs a Recovery Asset Team, which exists to contact receiving financial institutions quickly and freeze fraudulent transfers. Its 2025 Annual Report gives the year’s figures directly: 3,900 incidents, $1,163,919,846 in attempted theft, and $679,013,183 frozen, which the report states as a 58 per cent success rate. Dividing the frozen total by the attempted total gives 58.3 per cent, so their headline figure and the underlying numbers agree.

    Work out the per incident average and the point lands harder. Across those 3,900 incidents, the average attempted theft was about $298,400 and the average amount frozen was about $174,100. That is not a consolation payment, it is a substantial share of real money returning to real people, and the report is explicit about what makes it possible. Its own instruction reads: “Regardless of the amount lost, file a complaint at www.ic3.gov. Be sure to include the full transaction details in your report.” The report notes the process works best when complaints “are filed as quickly as possible”.

    Nothing in that process is triggered by complaining to the firm that took your money. It is triggered by reporting the transaction to the people who can call the receiving bank.

    How do I complain about a broker through the proper channel

    For box two, the service failure, the sequence is boring and it matters that you follow it in order, because skipping a step usually gets your case returned to you.

    Start with the firm’s own complaints procedure, in writing, addressed to the complaints function rather than to live chat. Most regulated firms are obliged to operate one, to acknowledge your complaint, and to issue a final response within a defined period. You want that final response in writing, because it is usually the document that unlocks the next stage. State what happened, when, what you want done about it, and attach your evidence. Keep it factual and unemotional, not because the firm deserves courtesy, but because a short factual complaint is harder to deflect than a long angry one.

    If the final response does not resolve it, or the deadline passes without one, escalate to the regulator or dispute scheme that covers the firm. In the United States, derivatives customers have a specific forum: the CFTC reparations program, which the Commission describes as providing “an inexpensive, expeditious, and fair forum to resolve disputes between derivatives customers” and registered professionals. Three details from that page are worth knowing before you start. There is no size threshold: “You are not limited by a minimum or maximum amount of damages in your claim.” There is a deadline, and the page refers to a two year window for refiling a withdrawn complaint. And it is not quick: a voluntary proceeding is “typically decided within 12 months”, while summary and formal proceedings “typically require between 12 to 18 months”. An appeal to the Commission carries a $50.00 filing fee.

    Twelve to eighteen months is the honest timescale for a contested dispute, and knowing that in advance is itself useful. It tells you that this route is for recovering a significant sum, not for settling a point of principle about a $40 swap charge.

    The evidence you need, gathered before you write

    Whichever box you are in, the quality of what you can show decides the outcome. Collect these before the account portal stops letting you in, which is a thing that happens.

    • Full statements and the complete trade history, exported, not screenshotted where an export exists.
    • Every deposit and withdrawal record from your own bank or payment provider, with dates, amounts, reference numbers and the receiving account details.
    • The terms and conditions as they were when you opened the account, if you kept them, and the current version.
    • All correspondence, including live chat transcripts, saved as files rather than left on their server.
    • The firm’s regulatory details as advertised, and a note of what the regulator’s own register says, which is often where the story changes.

    That last item is the one people skip. Checking the register against the claim is also the check that would have prevented most of this, and it is the same instinct I argue for in what an ECN broker actually is, where the marketing label and the legal reality frequently differ.

    The scale of what sits in box three

    It is worth seeing where investment fraud sits relative to everything else reported, because it changes how seriously you take the verification step.

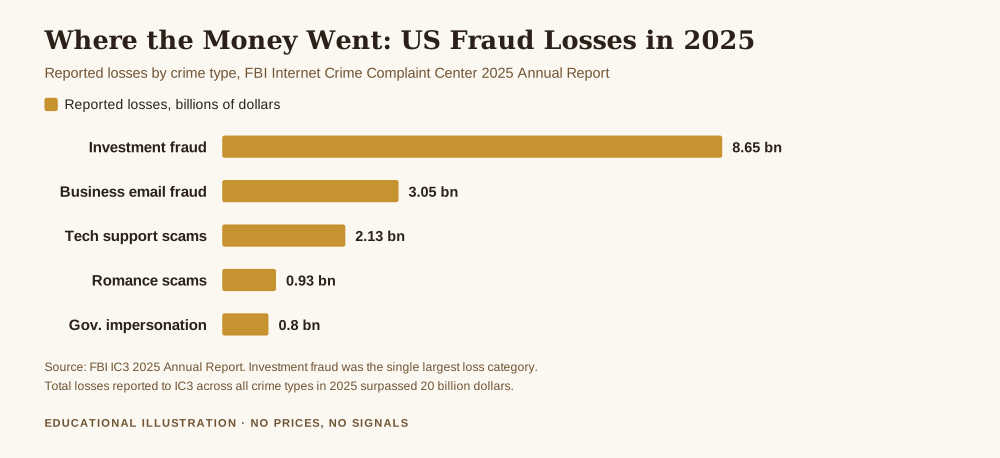
    How do i complain about a broker, chart of reported US fraud losses in 2025 from the FBI IC3 annual report showing investment fraud at 8.65 billion dollars, ahead of business email fraud at 3.05 billion, tech support scams at 2.13 billion, romance scams at 0.93 billion and government impersonation at 0.80 billion
    How do i complain about a broker is often the wrong question. Investment fraud was the largest single loss category reported to the FBI IC3 in 2025, at $8.65 billion.

    In 2025 the IC3 recorded 72,984 investment fraud complaints with reported losses of $8,648,617,756. That is the largest single loss category in the report, 2.84 times the next one, business email compromise, at $3,046,598,558. Dividing the loss by the complaint count gives an average reported loss of about $118,500 per complaint. The report also states that total losses across all crime types surpassed the $20 billion mark, so investment fraud alone accounts for something in the region of 43 per cent of everything reported.

    An average of $118,500 is not a story about people losing pocket money to an obvious scam. It is a story about people losing substantial savings to something that looked credible enough to fund repeatedly, which is exactly why the verification habit matters more than the complaint procedure. The complaint is what you do when prevention has already failed.

    What a complaint cannot do for you

    I want to be direct about this, because false hope here costs people a second round of money to recovery firms that are themselves frauds.

    A complaint cannot reverse a trading loss. If you took the position, the position moved against you, and the firm executed according to its terms, there is no forum that will give that money back, and no regulator who will accept that losing is itself a grievance. The distinction a regulator draws is between a firm that behaved improperly and a market that behaved normally, and most of what hurts is the second one. That is the whole argument for sizing positions so that the market behaving normally cannot end you, which is what risk management in gold trading is actually for.

    A complaint also cannot create a regulator where none exists. If the firm is registered nowhere, or registered in a jurisdiction with no dispute scheme, there may be no civil route at all, and the crime report is the only meaningful action. This is the real cost of choosing a venue on spread alone, and it is a cost you pay only once, at the worst possible moment. The same logic runs through what happens if your forex broker goes bust, where the protections that matter were all decided before anything went wrong.

    Finally, be suspicious of anyone who approaches you offering to recover funds for an upfront fee after you have been defrauded. Victim lists circulate, and the second approach is frequently run by people connected to the first. No legitimate route to recovery begins with a stranger contacting you and asking for money, a pattern I have written about separately in whether forex signal groups are legitimate.

    What I would actually do, in order

    If I believed money had been taken rather than lost, I would do these in this sequence, today, before writing a single complaint letter: contact my own bank or payment provider to report the transaction and ask what they can still stop, file the report with the national crime reporting body with full transaction details attached, notify the regulator the firm claims to be authorised by, and only then open a formal complaint with the firm itself if it is a real firm. If instead the firm is real and the issue is service, I would reverse that order entirely, start with the firm’s complaints procedure in writing, and hold the escalation in reserve.

    One sentence is worth keeping from all of this. The complaint is the slow route and it is sometimes the right one, but the freeze is the fast route and it closes quickly, so decide which you are in before you decide how politely to write.

    Free gold survival sheet

    Get the free Gold Empire survival sheet, a one-page guide to protecting your account, including the checks on a venue that are far cheaper to do before you fund it than after. One email, no spam, unsubscribe anytime.

    Get the free survival sheet →

    Frequently asked questions

    How do I complain about a broker if it is regulated offshore?

    Start by checking the regulator’s public register rather than the firm’s own claim, because the two disagree more often than people expect. If the registration is real, that regulator’s complaints route is your route, though the protections and timescales vary enormously between jurisdictions. If the registration does not exist, or names an entity different from the one holding your money, you are not in a complaint situation at all, and the crime report and your payment provider are the two calls worth making first.

    Can I get my money back if my trades simply lost?

    No, and it is kinder to say so plainly. If the firm executed within its published terms and the market moved against your position, there is no complaints body that treats a loss as a grievance. The route exists for improper conduct by the firm, not for an unprofitable outcome. This is why the protective work has to happen at position sizing, before the trade, rather than at the complaints stage afterwards.

    How long does a formal complaint take?

    Longer than almost anyone expects. For the US derivatives route, the CFTC’s own page states that a voluntary proceeding is typically decided within 12 months, while summary and formal proceedings typically require between 12 to 18 months. Firms also get a defined window to issue their final response before you can escalate at all. Plan for a year, and do not let that timescale stop you from making the fast reports first, which operate on a completely different clock.

    Is it worth reporting if the amount is small?

    Yes, and the IC3 report says so in as many words: “Regardless of the amount lost, file a complaint at www.ic3.gov.” Small reports build the pattern that identifies an operation, and the transaction details you provide can assist a freeze on somebody else’s larger transfer to the same account. Your individual odds on a small sum may be poor, but the reporting is close to free and the aggregate value of it is not.

    Should I pay a recovery firm that contacts me?

    No. Treat an unsolicited approach offering to recover your funds for an upfront payment as a second fraud attempt, because that is overwhelmingly what it is. Victim lists are traded, and the people who took the first payment are often connected to the people offering to retrieve it. Legitimate recovery runs through your bank, the crime reporting body and the regulator, and none of those three will cold call you asking for a fee.

    What Gold Empire actually does

    Gold Empire is a free channel about surviving in gold rather than getting rich in it. There is no signal service here and nothing is sold on the promise of a return. The free Gold Survival Sheet is a single page on protecting an account, and the checks it lists on a venue take about twenty minutes and are the cheapest insurance in this entire article. The only thing it asks for is an email address you can unsubscribe from.

    The model is deliberate. Follow along for free, read the arithmetic, and decide for yourself. If a piece of writing ever makes you feel you must act immediately, that is a reason to be suspicious of the writing, including mine. The one exception is the subject above, where speed genuinely is the variable, and that is precisely why it is worth knowing the sequence before you need it.

    About the author

    Matthew writes Gold Empire. He spent a fortnight once helping someone compose an immaculate complaint to an entity that had never been authorised anywhere, which was two weeks in which nobody called a bank, and he has thought about the order of operations differently ever since. He has no interest in telling anyone where price is going. You can read more about the approach on the about page.


    This article is educational and is not financial advice, and it is not legal advice. Trading gold carries a high risk of losing money rapidly, and no entry, stop or target discussed should be treated as a signal. The recovery figures, complaint counts and loss totals are quoted from the FBI Internet Crime Complaint Center 2025 Annual Report, and the reparations procedure, timescales and the $50.00 appeal fee are quoted from the CFTC’s published reparations program page, both linked above. The per incident and per complaint averages are my own arithmetic from those published totals. Procedures, deadlines and the protections available differ by country and by regulator, and your own firm’s terms and your own jurisdiction govern your situation, so verify both before acting. Decide your own risk, and never trade money you cannot afford to lose.


  • Why Does My Broker Increase Margin Requirements, and What It Does to an Open Trade

    Why Does My Broker Increase Margin Requirements, and What It Does to an Open Trade

    Why does my broker increase margin requirements is a question that almost always arrives too late, usually in the same hour the increase happens, and usually from someone whose position has just been closed without price doing anything dramatic. The sequence feels like a betrayal. Nothing moved. No stop was hit. The trade simply stopped existing, and the account is smaller than it was an hour ago.

    It is not a betrayal, and it is not a glitch. It is a rule working exactly as written. A margin requirement is not a fixed property of an instrument, it is a number the broker sets and is allowed to change, including on positions you already hold. When that number goes up, the amount of your equity reserved against your open trade goes up with it, and the distance between you and an automatic close out gets shorter. Price never has to move for that to happen.

    This article does the arithmetic. Everything numerical below is computed from published rules with the assumptions written out, so you can redo it yourself in a couple of minutes and check whether I am right.

    Why does my broker increase margin requirements, mechanically

    Start with what a margin requirement is. When you open a gold position, you are not paying for the whole position. You post a fraction of its value and the broker carries the rest. That fraction is the margin requirement, and it is quoted either as a percentage of the position or as its reciprocal, the leverage. A 5 per cent requirement and a 20:1 leverage cap are the same sentence said two ways.

    The European Securities and Markets Authority fixed that particular number for retail clients. In its product intervention measures agreed on 23 March 2018, ESMA set leverage limits that run from 30:1 down to 2:1 depending on what you are trading. Gold sits with non major currency pairs and major indices at 20:1, which is a 5 per cent margin requirement. Commodities other than gold are capped at 10:1, individual equities at 5:1, cryptocurrencies at 2:1.

    Here is the part that answers the question. Those are floors on how much margin must be collected, not ceilings. A broker may always require more than the regulator demands, and brokers routinely do, for reasons that have nothing to do with you personally:

    The first reason is volatility. A margin requirement is the broker’s estimate of how far price can run before it can close you out and still be made whole. When gold starts moving further per hour than it did last month, that estimate stops being adequate, so the requirement rises.

    The second is the calendar. Scheduled events with large and uncertain outcomes, central bank decisions, inflation releases, employment data, concentrate risk into a known minute. Many brokers raise requirements ahead of those minutes and lower them afterwards.

    The third is the weekend. Markets close, news does not, and a position held across the gap cannot be managed while it is closed. Higher weekend requirements are common and are usually published in advance.

    The fourth is you. Tiered margin is widespread: the requirement rises with position size, so the same instrument can carry one requirement on a small position and a higher one on a large position. Grow the position and you can trigger the higher tier yourself.

    The rule that turns a requirement into a close out

    A requirement on its own does nothing. It becomes an event because of a second rule sitting next to it. The same ESMA measures standardised a margin close out rule at 50 per cent of minimum required margin. When your equity falls below half of the margin your open positions require, the provider is obliged to start closing them. The same package added negative balance protection on a per account basis, so retail losses are capped at the account, which is the one genuinely good piece of news in this article.

    Read those two rules together and the mechanism is obvious. The close out trigger is defined as a fraction of the requirement. Raise the requirement and you raise the trigger. Your equity has not changed. The floor has come up to meet it.

    I have written separately about what a blown trading account actually means, which works the same arithmetic in the direction people expect, where price moves and the account does not. This article is the other direction, where the account does not move and the rule does.

    What doubling the requirement does to a trade you already hold

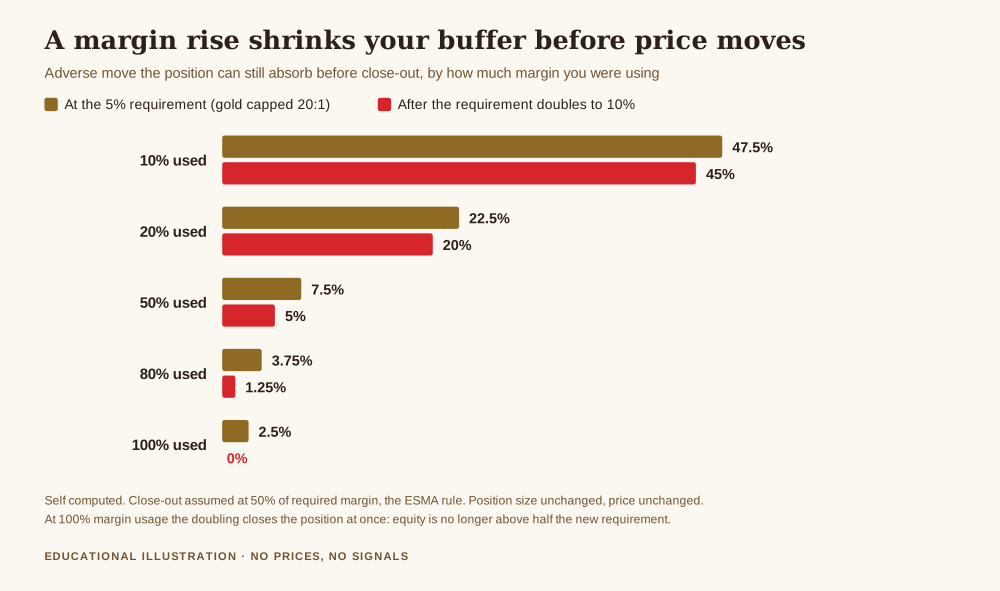
    Let me put numbers on it. The assumptions, so you can disagree with them precisely: equity is whatever it is, call it E. Your position has some notional value N. The requirement is a fraction m of N, so the margin reserved is m times N. Margin usage is the share of your equity that reservation consumes. Close out is at 50 per cent of required margin, per the rule above. Price does not move at any point, and the position size never changes. Only m changes, from the 5 per cent retail floor for gold to 10 per cent, which is what happens if a broker halves your effective leverage from 20:1 to 10:1.

    The question I am asking is: how far could price still move against this position before it is closed, before and after the change?

    Why does my broker increase margin requirements, chart showing the adverse move a gold position can still absorb before close-out at the 5 per cent requirement and after it doubles to 10 per cent, falling from 47.5 to 45 per cent at low margin usage and from 2.5 per cent to an immediate close-out at full margin usage
    Why does my broker increase margin requirements matters most to traders already using a lot of margin: the buffer loss runs from 5 per cent at light usage to total at full usage.

    At 10 per cent margin usage, the buffer falls from 47.50 per cent to 45.00 per cent. That is a reduction of about 5 per cent of the buffer, and in practice you would never notice it.

    At 20 per cent usage, 22.50 per cent becomes 20.00 per cent. Still comfortable.

    At 50 per cent usage, 7.50 per cent becomes 5.00 per cent. You have lost a third of your room, and gold can cover 5 per cent in a session that nobody would describe as unusual.

    At 80 per cent usage, 3.75 per cent becomes 1.25 per cent. Two thirds of the buffer is gone. This is the band where traders get hurt without understanding what hit them.

    Notice the shape of that progression. The damage is not proportional to the size of the increase. It is governed by how much margin you were already using. The same change in the same instrument on the same day is a rounding error for one trader and an account ending event for another, and the only difference between them is a decision each made before the announcement.

    The number that genuinely surprises people

    Run the same arithmetic at 100 per cent margin usage, meaning you have committed every unit of equity as margin, and the result stops being a reduced buffer and becomes something else.

    At a 5 per cent requirement with full usage, the notional is 20 times equity and the required margin equals equity exactly. Buffer before the change: 2.50 per cent. Now double the requirement. Required margin becomes twice equity. The close out trigger is half of that, which is exactly equity. Your equity is equity. You are at the trigger the moment the change takes effect.

    The position closes immediately, with no price movement whatsoever. The free margin figure makes the same point in plainer terms: at 50 per cent usage, free margin goes from half your equity to zero. At 80 per cent usage it goes from a fifth of your equity to negative 0.6 of it. At full usage it goes to negative 1.0.

    That is the whole lesson of this article in one line. Full margin usage is not an aggressive position, it is a position with no tolerance for the rules changing, and the rules are allowed to change.

    Free gold survival sheet

    Get the free Gold Empire survival sheet, a one-page guide to protecting your account through the kind of market this article describes. One email, no spam, unsubscribe anytime.

    Get the free survival sheet →

    How much warning you actually get

    This varies, and it is worth knowing where your broker sits before you need to know.

    Scheduled increases, the weekend and calendar kind, are normally published days ahead, in a notices section of the client portal or by email. These are the easy ones, and they are easy only if you read the notices.

    Unscheduled increases, the volatility kind, can arrive with very little notice, because the condition that justifies them is itself sudden. Client agreements for leveraged products generally reserve the right to change margin requirements with immediate effect in abnormal market conditions, which is the clause that makes the scenario above legal.

    There is also a question worth asking that most people never do: does the new requirement apply to new positions only, or to everything open? Some brokers apply increases prospectively, which leaves your existing trade alone. Others apply them to the whole book. The arithmetic above only bites in the second case, and which case you are in is a factual question with an answer, available before you ever need it.

    What the loss statistics suggest about who this reaches

    One more figure, because it frames how common the vulnerable position is. In the same intervention, ESMA reported that analyses by national regulators across EU jurisdictions found that 74 to 89 per cent of retail accounts typically lose money, with average losses per client ranging from 1,600 to 29,000 euros. Those numbers are the reason the leverage caps exist at all.

    They do not tell you that margin increases caused those losses. They tell you that the population being discussed here is mostly losing, which means mostly operating with less equity than they started with, which means mostly operating at higher margin usage than they intended. The group most exposed to a requirement change is not the reckless minority. It is the ordinary majority, several weeks into a drawdown.

    What this article is not saying

    It is not saying brokers raise requirements to close you out. The incentive runs the other way. A broker that force closes clients in volatile conditions generates complaints, and under negative balance protection it absorbs the tail risk itself. Raising requirements is how it avoids that, not how it causes it.

    It is not saying every broker does this the same way. Policies differ, notice periods differ, and whether increases apply to open positions differs. That is exactly why the useful version of this question is not the general one but the specific one about your own account.

    It is not telling you what margin usage to run. I have deliberately given ratios rather than a recommendation, because the right answer depends on your stop distance, your instrument and how much of your life is attached to the money. And it is not a view on gold. Nothing above says anything about direction.

    What I would actually do about it

    Four things, none of which require predicting anything.

    First, find out your broker’s current margin requirement for gold, in writing, and whether it is tiered by position size. It is usually in a contract specifications table. This takes about four minutes.

    Second, find out whether increases apply to open positions. Ask support and keep the answer. This is the single fact that decides whether any of the arithmetic above applies to you.

    Third, watch margin usage as a live number, not equity. Equity tells you how the trade is going. Margin usage tells you how much room you have if the rules change, and the chart above says the two are not the same question. If you want the mechanics of sizing the position in the first place, the risk management guide and what leverage actually is in gold trading are the places to start.

    Fourth, treat scheduled high impact events as requirement events as well as price events. If you already reduce size around them, you are also reducing the exposure described here, which is a second reason to do something you may already be doing. Trading gold through high impact news covers the price side of that decision.

    Frequently asked questions

    Why does my broker increase margin requirements without warning?

    Usually because the increase is tied to market conditions rather than a date. Client agreements for leveraged products generally allow immediate changes in abnormal conditions. Scheduled increases around weekends and known events are normally published in advance.

    Can a margin increase close my position even if price has not moved?

    Yes, if you were using enough margin. With close out at 50 per cent of required margin, a doubling of the requirement closes a position held at 100 per cent margin usage immediately, because equity is no longer above half of the new requirement.

    Is a margin increase the same as a margin call?

    No. A margin call is a warning that equity is approaching the required level. A margin increase moves the required level itself. The increase can produce the call rather than the other way round.

    Does the 20:1 cap mean my broker cannot ask for more than 5 per cent?

    The opposite. The cap is a minimum standard of protection for retail clients, so the broker cannot offer more leverage than that. It can always require more margin than the floor, and often does.

    Do margin increases apply to positions I already have open?

    It depends on the broker, and this is the question worth asking before you need the answer. Some apply increases only to new positions, others to the entire book.

    How do I know how much room I have left?

    Compare your equity with your required margin. The close out level sits at half the requirement, so the loss you can still absorb is equity minus half of required margin, and the move that represents depends on your position size.

    What Gold Empire actually does

    Gold Empire is a free channel about surviving in gold rather than getting rich in it. There is no signal service here and nothing is sold on the promise of a return. The free Gold Survival Sheet is a single page on protecting an account through exactly the kind of week this article describes, and the only thing it asks for is an email address you can unsubscribe from. If you are still choosing where to hold the account, how to open a gold trading account covers the questions worth asking before you fund anything, and margin policy belongs on that list.

    The model is deliberate. Follow along for free, read the arithmetic, and decide for yourself. If a piece of writing ever makes you feel you must act immediately, that is a reason to be suspicious of the writing, including mine.

    About the author

    Matthew writes Gold Empire. He once held a gold position through a weekend requirement increase he had been emailed about and had not read, and spent the following Monday constructing the arithmetic in this article from the wrong end of it. He now checks margin usage before he checks the chart. He has no interest in telling anyone where price is going. You can read more about the approach on the about page.


    This article is educational and is not financial advice. Trading gold carries a high risk of losing money rapidly, and no entry, stop or target discussed should be treated as a signal. The leverage caps, the 50 per cent margin close out rule, the negative balance protection and the 74 to 89 per cent loss statistics are quoted from the European Securities and Markets Authority’s product intervention measures agreed on 23 March 2018, as cited above. All buffer figures are computed from those published rules with the assumptions stated, exclude swap and commission, and assume the position size and price are unchanged. Your own broker’s terms govern your account and may differ. Decide your own risk, and never trade money you cannot afford to lose.


  • Blown Trading Account Meaning, and the Exact Moment a Broker Closes You

    Blown Trading Account Meaning, and the Exact Moment a Broker Closes You

    The blown trading account meaning that most people carry around is a feeling rather than a definition. It means the money is gone, it happened fast, and there was a moment near the end where nothing could be done. That is roughly right as a description of the experience, and it is almost useless as an explanation, because it leaves out the only part you can actually control.

    There is a precise mechanical meaning underneath the feeling. An account is blown when the broker closes your positions for you, because your equity has fallen to a level the rules say is the floor. You do not choose the moment. It is defined in advance, in writing, by a rule you agreed to and probably never read. And once you know where that floor sits, you can calculate exactly how far price has to move against you before you meet it.

    That calculation is the whole of this article. Everything numerical below is my own arithmetic, derived from two published rules, with the assumptions written out as I go. There are no gold prices here, nothing is a forecast, and nothing tells you what to do with a position.

    The blown trading account meaning, stated mechanically

    Two rules do the work, and both come from the same place: the product intervention measures the European Securities and Markets Authority agreed on 23 March 2018 under Article 40 of MiFIR, which you can read in ESMA’s own announcement.

    The first rule is a leverage cap. ESMA set retail leverage limits that vary by instrument, and gold sits in the 20:1 band, alongside non major currency pairs and major indices. Twenty to one means the margin you must post to open a position is one twentieth of its contract value, which is 5 per cent.

    The second rule is the one nobody talks about, and it is the actual definition of a blown account. ESMA requires “a margin close out rule on a per account basis”, which, in their words, standardises “the percentage of margin (at 50% of minimum required margin) at which providers are required to close out one or more retail client’s open CFDs”.

    Read that slowly. The broker is required to close you when your equity falls to half of the margin your open positions require. Not when your money runs out. Not when you decide. At half of required margin, by rule.

    There is a third rule worth knowing because it is the one that works in your favour: negative balance protection, also on a per account basis, which means your loss stops at the money you deposited and you do not end up owing the broker. That is a genuine protection and it is why the modern version of this story ends badly rather than catastrophically.

    How far price has to move, derived in four lines

    Let N be the contract value of your position, D the money you deposited, and f the fraction price moves against you.

    Minimum required margin is M = N divided by 20, which is 0.05N. Define margin use u as M divided by D, so a u of 100 per cent means you have opened the largest position your deposit allows at the cap. Rearranging, D = 0.05N divided by u.

    The broker must close you when equity reaches half of required margin, which is when D minus f times N equals 0.5 times 0.05N, or 0.025N.

    Solve for f and you get f = 0.05 divided by u, minus 0.025. That is the entire model. One line, two published rules, no opinions in it.

    Blown trading account meaning shown as a chart, the adverse move that triggers a broker close-out at each level of margin use under the ESMA 20 to 1 gold cap, 2.5 per cent at full margin use rising to 47.5 per cent at ten per cent margin use, with the share of deposit already lost
    The blown trading account meaning in two numbers: how far price must move to trigger the close-out, and how much of the deposit has already gone by the time it fires.

    Two and a half per cent

    Put u at 100 per cent, the case where a trader opens the biggest position the deposit permits, and f comes out at 2.5 per cent.

    Two and a half per cent. That is the distance between a fully committed account at the regulatory leverage cap and a forced liquidation. Not a crash, not a black swan, not a gap. An ordinary adverse session.

    I have excluded swap charges and commission from the arithmetic, which makes 2.5 per cent the optimistic figure. Financing costs push the threshold nearer, never further away. Whatever your real number is, it is worse than the one I just gave you.

    Back the position off and the threshold widens, exactly as you would expect. At 75 per cent margin use it is 4.17 per cent, at 50 per cent it is 7.5 per cent, at 25 per cent it is 17.5 per cent, and at 10 per cent margin use price has to travel 47.5 per cent against you before the rule fires.

    The part that is genuinely counterintuitive

    Now look at the second bar in each pair on that chart, because it reverses the lesson most people take from the first.

    At the moment the close out fires, how much of your deposit is left? The algebra gives a clean answer: remaining equity as a share of deposit is 0.5 times u. So at 100 per cent margin use you still have 50 per cent of your deposit when the broker closes you. At 50 per cent margin use you have 25 per cent left, meaning you lost 75 per cent. At 10 per cent margin use you have 5 per cent left, having lost 95 per cent of everything you put in.

    That is worth sitting with. The maximally leveraged account is closed sooner and keeps more of its deposit. The conservatively leveraged account survives a far larger move, and if it does eventually reach the floor, it arrives there having lost almost everything.

    This is not an argument for using more leverage, and I want to be very clear about that. It is a correction to a belief I hear constantly, which is that the close out rule is a safety net for the trader. It is not. It is a safety net for the broker, protecting the firm from an account going negative. Where it happens to protect you, that is a by product of protecting them. The number it defends is the firm’s exposure, not your capital.

    Free gold survival sheet

    Get the free Gold Empire survival sheet, a one-page guide to protecting your account through the kind of market this article describes. One email, no spam, unsubscribe anytime.

    Get the free survival sheet →

    Twice is enough

    One more piece of arithmetic, and it is the one that explains why this tends to happen to the same person more than once.

    Suppose an account is closed out at full margin use, keeping 50 per cent of its deposit, and the trader does what people do, which is open the same size position again with what is left. The second close out leaves 50 per cent of that, which is 25 per cent of the original deposit.

    Two forced liquidations. Three quarters of the money gone. Not through a disaster, through a rule working precisely as written, twice, on a position sized to the maximum the regulator permits. Nobody needs to be unlucky for this to happen, and nobody needs to be stupid either.

    What the numbers say about how common this is

    ESMA did not write these rules in the abstract. In the same announcement they recorded what the national regulators found: analyses of CFD trading across different EU jurisdictions showed that “74-89% of retail accounts typically lose money on their investments, with average losses per client ranging from €1,600 to €29,000”.

    Three quarters to nine tenths. That is the context the 2.5 per cent sits in, and it is why I write about survival first and growth second on this site rather than the other way around.

    What this article does not say

    It does not say that 2.5 per cent is a likely move or an unlikely one. I have not told you how often gold travels that far in a session, because that is a separate measurement and I am not going to assert it without doing the work properly.

    It does not say that your broker uses exactly these numbers. ESMA’s rules apply to retail clients of firms in scope. Your leverage cap, your close out percentage and your negative balance protection are in your own account documentation, and the only correct source for them is the firm you trade with.

    And it does not tell you what size to trade. It gives you the formula so that you can work out your own threshold instead of discovering it.

    How I would actually use this

    Three things, and the first takes two minutes.

    Find your broker’s actual close out level and your actual leverage on gold. They are in the client agreement. If the close out is at 50 per cent of required margin and gold is capped at 20:1, every figure in this article applies to you unchanged. If the numbers differ, put them into f = initial margin rate divided by u, minus close out fraction times initial margin rate, and you have your own threshold.

    Second, write that threshold down next to your position size. Not the stop you intend to use, the distance at which the decision stops being yours. Most traders have never calculated it, which means they are operating with an invisible boundary somewhere in front of them.

    Third, treat margin use as the dial that matters, because it is the one that sets everything else. If you want to understand why that dial behaves the way it does, what leverage is in gold trading is the mechanical companion to this piece, and how much to risk per trade is where the decision actually gets made.

    Frequently asked questions

    What is the blown trading account meaning, in one sentence?

    It means the broker has force closed your positions because your equity fell to the margin close out level, which under ESMA’s rules is 50 per cent of the minimum margin your positions required.

    How far does gold have to move to blow an account?

    It depends entirely on margin use. At the ESMA retail cap of 20:1 with every available unit of margin committed, the arithmetic gives 2.5 per cent, before swap and commission, which bring it closer.

    Can I lose more than I deposited?

    Under ESMA’s negative balance protection, which applies on a per account basis, your loss is limited to the funds in the account, so you should not end up owing the broker. Confirm it applies to your account rather than assuming it.

    Does the margin close out rule protect me?

    Not primarily. It caps the broker’s exposure to a client account going negative. At low margin use it fires only after roughly 95 per cent of the deposit has already gone, which is not what most people picture when they hear the word protection.

    Why does a smaller position lose a larger share of the deposit?

    Because the floor is set at half of required margin, and a smaller position requires less margin, so the floor sits lower in absolute terms. The remaining equity at close out works out as 0.5 times margin use, which is why 10 per cent margin use leaves 5 per cent of the deposit.

    Is a margin call the same as being blown?

    No. A margin call is a warning that your equity is approaching the required level. The close out is the automatic action that follows if it keeps falling, and that is the event this article defines.

    What Gold Empire actually does

    Gold Empire is a free channel about surviving in gold rather than getting rich in it. There is no signal service here and nothing is sold on the promise of a return. The free Gold Survival Sheet is a single page on protecting an account through exactly the kind of week this article describes, and the only thing it asks for is an email address you can unsubscribe from. The risk management guide that sits underneath all of this is simply published, alongside why you keep blowing your trading account, which covers the behaviour that walks a trader to the threshold this article measures, and position sizing in gold.

    The model is deliberate. Follow along for free, read the arithmetic, and decide for yourself. If a piece of writing ever makes you feel you must act immediately, that is a reason to be suspicious of the writing, including mine.

    About the author

    Matthew writes Gold Empire. He traded for two years without knowing where his own close out level sat, which is the sort of thing you can look up in four minutes and most people never do, and he now writes the number next to the position size before the position exists. He has no interest in telling anyone where price is going. You can read more about the approach on the about page.


    This article is educational and is not financial advice. Trading gold carries a high risk of losing money rapidly, and no entry, stop or target discussed should be treated as a signal. The leverage cap, the margin close out level and the negative balance protection described above are quoted from the European Securities and Markets Authority’s product intervention measures agreed on 23 March 2018, and the loss statistics are ESMA’s own, as cited. All thresholds are computed from those published rules with the assumptions stated, exclude swap and commission, and were accurate at the time of writing. Your own broker’s terms govern your account. Decide your own risk, and never trade money you cannot afford to lose.


  • What Is PCE in Gold Trading, and Why the Fed Ignores CPI

    What Is PCE in Gold Trading, and Why the Fed Ignores CPI

    There is a particular kind of expensive confusion that happens on inflation day. The Consumer Price Index comes in hot, the headlines say inflation is back, gold does something for ninety seconds, and then it does the opposite. You conclude that the market is irrational. It is not. Part of what happened is that you and the Federal Reserve were looking at two different inflation numbers. So, what is PCE in gold trading, and why does the measure nobody quotes matter more than the one everybody quotes? The short answer is that the Fed’s two per cent target is not written in terms of CPI at all. It is written in terms of PCE, and the two disagree far more often than most traders realise.

    This article does the arithmetic. I pulled the monthly Personal Consumption Expenditures price index from the Bureau of Economic Analysis, 812 months from January 1959 to August 2026, and the monthly Consumer Price Index from the Bureau of Labor Statistics, measured the gap between them month by month, then checked which of the two actually lines up with how gold moves. The results are not close.

    What is PCE in gold trading, grouped bar chart of twelve month inflation for five months of 2026 comparing CPI against the PCE price index, with the CPI bar longer than the PCE bar in every month
    What is PCE in gold trading: the same five months measured two official ways. CPI is the higher number every time, and the Federal Reserve’s two per cent target is written on the lower one.

    What is PCE in gold trading, in the only sense that matters

    PCE stands for Personal Consumption Expenditures. The price index built from it is produced monthly by the Bureau of Economic Analysis, and it measures what Americans actually spent on goods and services, including spending made on their behalf by employers and government programmes. CPI, by contrast, measures the cost of a fixed basket bought directly out of pocket by urban consumers.

    That difference in construction sounds like a statistician’s quibble. It is not, because of one sentence. In its Statement on Longer-Run Goals and Monetary Policy Strategy, the Federal Open Market Committee writes that it “reaffirms its judgment that inflation at the rate of 2 percent, as measured by the annual change in the price index for personal consumption expenditures, is most consistent over the longer run with the Federal Reserve’s statutory maximum employment and price stability mandates.” You can read that statement in full on the Federal Reserve’s own site.

    Read it slowly. The target is two per cent. The yardstick is the PCE price index. CPI is not mentioned. So when a CPI print lands and you reason forward to what the Fed will do, you are using a proxy for the committee’s actual measure without knowing how big the error on that proxy is.

    That is why this matters to a gold trader. Gold pays no coupon and no dividend, so what it competes against is the real return available on cash and bonds, roughly the nominal rate minus inflation. The chain runs from inflation data, to what the market expects the Fed to do, to real rates, to the opportunity cost of holding a metal that yields nothing. If the first link is a measure the Fed does not target, the chain is weaker than you think.

    How far apart are the two numbers, actually

    Here is the measurement. Take the twelve month inflation rate on both measures, the figure quoted in every headline, and compare them in the same month. Across 703 months from January 1968 to August 2026:

    • CPI inflation runs above PCE inflation by a mean of 0.508 percentage points and a median of 0.437 points.
    • CPI is the higher of the two in 83.9 per cent of all months.
    • The two measures differ by at least 0.3 points in 66.0 per cent of months, by at least 0.5 points in 47.4 per cent of months, and by at least a full percentage point in 15.2 per cent of months.
    • The widest the gap has ever been is 3.74 points, in June 1980. The most negative was minus 1.78 points, in August 1983.

    Sit with the third line. In roughly one month out of every two, the two official inflation measures for the same economy in the same month differ by half a percentage point or more. These are not rounding errors. Half a point is the difference between a number that sounds tolerable and a number that sounds like a problem.

    The bias is persistent and it has a known cause. CPI holds its basket relatively fixed, while PCE reweights as spending patterns shift, so when people substitute away from whatever is getting expensive, PCE captures that and CPI largely does not. PCE also has broader scope, most notably in health care, where it counts spending made on a consumer’s behalf. The Bureau of Economic Analysis sets out the construction on its PCE price index page. The direction of the bias is not random, which is why CPI sits on top more than four times out of five.

    The same month, read two ways

    Abstractions are easy to nod along to, so here are the last few months of data as they actually arrived. All figures are twelve month rates, in per cent.

    • April 2026: CPI 3.95, PCE 3.57, core PCE 3.08. Gap of 0.37 points.
    • May 2026: CPI 4.27, PCE 3.82, core PCE 3.16. Gap of 0.45 points.
    • June 2026: CPI 3.73, PCE 3.45, core PCE 3.04. Gap of 0.27 points.
    • July 2026: CPI 3.54, PCE 3.36, core PCE 2.98. Gap of 0.18 points.
    • August 2026: CPI 3.71, PCE 3.42, core PCE 3.01. Gap of 0.29 points.

    Look at May. A trader watching CPI saw 4.27 per cent, a number comfortably more than double the target, the sort of print that gets described as inflation running out of control. The committee’s own measure said 3.82 per cent, and the core version of it, which strips food and energy, said 3.16 per cent. Those are three materially different stories about the same month, and the one that governs policy is the one that was quoted least. Note too how much steadier core is across those five months: it moves between 2.98 and 3.16 while headline CPI swings from 3.54 to 4.27.

    Why the Fed watches the boring version

    Across all 800 months for which both are available, the standard deviation of headline PCE inflation is 2.382 percentage points, against 2.084 points for core PCE, which excludes food and energy. The sharper difference is month to month: the median change in the headline twelve month rate from one release to the next is 0.149 percentage points, against 0.086 points for core. The headline figure jumps around roughly 1.7 times as much between releases as the core figure does.

    That is the practical case for core. It is not that food and energy do not matter to households, because obviously they do. It is that they swing for reasons monetary policy cannot address within the horizon over which policy works, so a committee trying to read the underlying trend gets a cleaner signal from the series without them. When officials talk about the trend, they are usually talking about core PCE.

    One more figure worth keeping in perspective. Of those 800 months, the PCE twelve month rate sat within a quarter of a point of the two per cent target in only 12.5 per cent of them, and in 19.7 per cent of months since 1995. For about four months in five, inflation is not at target. Being away from target is the normal state of the world, not a crisis.

    What gold actually tracks, measured

    Now the part that connects this to a chart. I took monthly gold returns from the World Bank’s commodity price series, the monthly ten year US Treasury yield from the Federal Reserve’s H.15 release of selected interest rates, and PCE inflation from the BEA, over the 283 months from February 2003 to August 2026. Then I built a crude real yield as the nominal ten year yield minus the trailing twelve month PCE inflation rate, and measured how monthly gold returns correlate with changes in each quantity.

    • Change in the real yield: correlation minus 0.308, which is an R squared of 9.5 per cent.
    • Change in the nominal ten year yield: correlation minus 0.263, an R squared of 6.9 per cent.
    • Change in PCE inflation on its own: correlation plus 0.152, an R squared of 2.3 per cent.

    The ordering is the finding. Gold’s monthly behaviour lines up with the direction of real yields about four times more strongly, measured by variance explained, than with the direction of inflation by itself. The sign on the real yield is negative, which is what the opportunity cost argument predicts: when the real return on bonds rises, the case for holding a metal that pays nothing weakens.

    This is exactly why a hot inflation print does not mechanically send gold up. A hot print raises inflation, which taken alone is the plus 0.152 column and faintly supportive. But the same print can raise the expected path of policy rates by more, which lifts the real yield, and that is the minus 0.308 column and the stronger effect. Two forces, opposite directions, and the stronger one often wins. That is a better explanation for the ninety second move that reverses than irrationality.

    What this does not say

    An R squared of 9.5 per cent is a real relationship and a weak one. Roughly ninety per cent of gold’s monthly variation comes from things not in this calculation, so anyone telling you real yields determine the gold price is overstating what I can measure. The honest claim is narrower: of the three quantities tested, real yields are the one gold attends to most, and inflation alone the one it attends to least.

    My real yield is also computed after the fact, from inflation already published. The real yield the market actually prices is forward looking and best read from inflation protected securities, which is a different series. I used the cruder version because it can be built entirely from two primary sources a reader can check, and I would rather flag the approximation than hide it. Monthly data cannot see the first minutes after a release either, so nothing here measures an intraday reaction.

    Finally, none of this is directional. There is no state of the inflation data that tells you what gold will do next. The arithmetic explains why the relationship you were taught is unreliable, and it does not replace it with a better rule, because there is not one, and no entry, stop or target discussed should be treated as a signal.

    How I would actually use this

    Three things follow, and none of them is a trade.

    First, when you are reasoning about what the Fed might do, reason about PCE, and preferably core PCE, because that is the measure in the committee’s own mandate sentence. CPI is a decent proxy with a known bias of about half a point and an error that exceeds a full point in one month out of seven. Use it knowing that.

    Second, stop expecting inflation prints to push gold in a fixed direction. Gold attends to real yields roughly four times more than to inflation on its own, and a single print moves both at once. Expecting a clean reaction to a messy, two sided input is how people end up convinced the market is rigged against them.

    Third, treat PCE day as a scheduled event in the same way as CPI day and FOMC day. It arrives monthly, the date is published in advance, and the only cost you can genuinely control is the cost of being surprised by a calendar you could have read a week earlier.

    So that is the answer to what is PCE in gold trading. It is the measure that actually defines the Fed’s two per cent target, it runs on average about half a point below the CPI figure in the headlines, it disagrees with that figure by more than a full point in fifteen per cent of months, and its core version is the steadier series officials lean on. If you trade around inflation data, watch the number the decision makers are watching.

    Free gold survival sheet

    Get the free Gold Empire survival sheet, a one-page guide to protecting your account through the kind of market this article describes. One email, no spam, unsubscribe anytime.

    Get the free survival sheet →

    Frequently asked questions

    What is PCE in gold trading, in one sentence?

    It is the Personal Consumption Expenditures price index, the inflation measure the Federal Reserve actually uses to define its two per cent target, which makes it the more relevant of the two official inflation numbers when you are reasoning about interest rates and therefore about the opportunity cost of holding gold.

    Is PCE more important than CPI?

    For working out what the Fed is likely to do, yes, because the committee’s own mandate sentence names PCE and does not name CPI. For understanding what households are paying out of pocket, CPI is the closer fit. They answer different questions, which is why both are published.

    How different are CPI and PCE in practice?

    Over 703 months to August 2026, CPI inflation ran above PCE inflation by a mean of 0.508 percentage points, and was the higher number in 83.9 per cent of months. The two differed by at least half a point in 47.4 per cent of months and by more than a full point in 15.2 per cent of months.

    Why did gold fall when the inflation number came in hot?

    Most likely because the print moved two things at once. It raised inflation, which on its own is mildly supportive of gold, but it also raised the expected path of interest rates, which lifts real yields, and the measurements in this article show gold is roughly four times more responsive to real yield changes than to inflation changes alone. The stronger force often wins.

    What is core PCE and why do officials keep mentioning it?

    Core PCE is the same index with food and energy excluded. It is the steadier series: its twelve month rate moves by a median of 0.086 percentage points between releases against 0.149 points for the headline measure, so it gives a cleaner read on the underlying trend that policy can actually influence.

    What Gold Empire actually does

    Gold Empire is a free channel about surviving in gold rather than getting rich in it. There is no signal service here and nothing is sold on the promise of a return. The free Gold Survival Sheet is a single page on protecting an account through exactly the kind of week this article describes, and the only thing it asks for is an email address you can unsubscribe from. The risk management guide that sits underneath all of this is simply published, as is the rest of the scheduled macro calendar series: what CPI is in gold trading, what the FOMC is and why gold reacts, and what nonfarm payrolls means in gold trading.

    The model is deliberate. Follow along for free, read the arithmetic, and decide for yourself. If a piece of writing ever makes you feel you must act immediately, that is a reason to be suspicious of the writing, including mine.

    About the author

    Matthew writes Gold Empire. He spent years assuming the inflation number on the news was the inflation number that mattered, which is a cheap mistake to fix and an expensive one to keep, and he now reads the committee’s own wording instead of the headline. He has no interest in telling anyone where price is going. You can read more about the approach on the about page.


    This article is educational and is not financial advice. Trading gold carries a high risk of losing money rapidly, and no entry, stop or target discussed should be treated as a signal. Figures are computed from the published Personal Consumption Expenditures price index from the Bureau of Economic Analysis, the Consumer Price Index from the Bureau of Labor Statistics, the Federal Reserve H.15 interest rate release and the World Bank monthly commodity price series, as described above, and were accurate at the time of writing. Past behaviour of any data series is not a prediction of its future behaviour. Decide your own risk, and never trade money you cannot afford to lose.


  • What Is Buy Limit Sell Limit Buy Stop Sell Stop, All Four Explained

    What Is Buy Limit Sell Limit Buy Stop Sell Stop, All Four Explained

    Four names, two ideas, and one of the four can cost you more than you agreed to lose. Most people learn them in the wrong order, which is to say they learn the two buy orders when they are opening a position and never think about the two sell orders until one of them fills somewhere they did not expect. If you have searched what is buy limit sell limit buy stop sell stop, you are probably staring at a platform dropdown with four options and no explanation of why they are not interchangeable.

    They are not interchangeable. Two of them promise you a price and may never fill. Two of them promise you a fill and make no promise at all about the price. That single distinction is the whole subject, and the reason it matters is that your protective stop on a gold position belongs to the second group.

    Everything numerical below is either quoted from the European regulator I link, or arithmetic I work out in front of you from assumptions I state. There are no gold prices here, nothing is a forecast, and nothing is a suggestion about what you should place or where.

    What is buy limit sell limit buy stop sell stop, in one sentence each

    Strip the jargon and every pending order is the same instruction with two variables: which side you want to end up on, and whether you want the market to come to your price or to prove something first.

    A limit order sits on the side of the market that is better for you than the current price. You are waiting for a move in your favour before you transact. A stop order sits on the side that is worse for you than the current price. You are waiting for the market to move against your current position, or to break out in a direction you want to join, before you transact.

    • Buy limit. Placed below the current price. You will buy, but only if price falls to your level. You are asking for a discount.
    • Sell limit. Placed above the current price. You will sell, but only if price rises to your level. You are asking for a premium.
    • Buy stop. Placed above the current price. You will buy once price trades up through your level. You are asking for confirmation and paying for it.
    • Sell stop. Placed below the current price. You will sell once price trades down through your level. This is where almost every protective stop on a long position lives.

    I wrote at length about the two buy orders and what each one costs in a fast market in buy stop and buy limit explained. This article is the complete set, and the half that gets skipped is the sell side, because that is the half holding your risk.

    The promise each order actually makes

    Here is the part that platform documentation states in a footnote and that costs people real money.

    A limit order has a price guarantee and no fill guarantee. If your buy limit sits below the market and price never reaches it, nothing happens. If price reaches it but there is not enough size at your level, you may get part of your order or none of it. What cannot happen is a fill at a worse price than you specified. The limit is a floor under the quality of your execution. I set out what the unfilled case actually looks like in what happens if a limit order is not filled.

    A stop order is the mirror image, and the mirror is unkind. A stop has a fill guarantee and no price guarantee. Once price trades through your stop level, the order converts into a market order and takes whatever the book offers next. In a quiet hour that is a few cents away from your level. In the first second after a scheduled release, or at the Sunday open after a weekend of news, the next available price can be a long way from where you asked.

    What is buy limit sell limit buy stop sell stop, candlestick diagram showing a protective sell stop level and a gap that opens below it, so the fill lands further away than the level requested
    What is buy limit sell limit buy stop sell stop: the sell stop is the only one of the four that can fill worse than the number you typed, which is why a gap is a risk management event rather than a chart pattern.

    That is not a platform defect and it is not your broker being difficult. It is the definition of the order. A stop that refused to fill at a worse price would not be a stop, it would be a stop limit, and a stop limit that goes unfilled during a fast move leaves you in the position you were trying to exit. There is no version of this where you get both guarantees.

    What the overshoot costs, in units you can plan with

    Dollars per ounce are useless for this because they depend on your size. So measure the damage the way a risk plan measures everything, in multiples of the amount you decided to risk on the trade. Call that amount one R.

    Set up the arithmetic. You are long. Your protective sell stop sits a distance below your entry, and that distance is what defines one R. If the market gaps past your stop, your fill lands further away, and your realised loss is the full distance divided by the planned distance. If the gap carries price a quarter of the stop distance past your level, you lose 1.25R. Half the stop distance past, 1.50R. A full stop distance past, 2.00R. Twice the stop distance past, 3.00R.

    What is buy limit sell limit buy stop sell stop, bar chart of realised loss in R multiples as a gap carries price past a protective sell stop, rising from 1.00R with no gap to 3.00R when the gap is twice the stop distance
    What is buy limit sell limit buy stop sell stop: the realised loss on a gapped sell stop is simply total distance divided by planned distance, which is why the planned distance is the only part you control.

    Read that table once more and notice what it is telling you. A tighter stop does not protect you from a gap, it makes the gap more expensive in R terms, because the same overshoot in dollars is a larger multiple of a smaller planned distance. The size of the gap is set by the market. The size of the denominator is set by you, before you enter. That is the only lever in the equation that belongs to you, and it is the argument underneath everything in the risk management guide.

    Where the regulator draws the line, and what that tells you about the tail

    Gaps are not hypothetical, and the European Securities and Markets Authority built an entire set of rules around the fact that retail accounts were being carried past zero by them. When ESMA announced its product intervention measures on contracts for difference, it set a leverage cap of 20:1 for gold, alongside 30:1 for major currency pairs and 10:1 for other commodities. It also imposed a margin close out rule standardised at 50 per cent of the minimum required margin, and negative balance protection on a per account basis.

    Turn the leverage cap into the number that matters. A 20:1 cap means the minimum required margin on a gold position is 5.00 per cent of its notional value. The close out rule bites when account equity falls to half of that, which is 2.50 per cent of notional. So an account funded with exactly the minimum margin has a total adverse move of 2.50 per cent of position value between fully funded and forced liquidation. Not 5 per cent. Half of it.

    Two things follow. The first is that a sell stop placed further than 2.50 per cent of notional away from entry, on an account at minimum margin, will never be the thing that closes your position, because the broker’s close out arrives first. The second, and more important, is why negative balance protection had to be written into law at all. Regulators do not legislate against risks that stay inside the agreed loss. They legislate against the ones that run past it, and a stop order filling past its level is exactly that shape of risk.

    Those rules apply to retail accounts under European rules. If your account sits elsewhere, the arithmetic above still holds, but the floor underneath it may not, and that is worth knowing before you need it.

    Where each of the four belongs in a survival plan

    Now the practical part, written as mechanics rather than instruction.

    Buy limit and sell limit are entry tools for patient positions. They are the orders you use when your thesis is that price is currently wrong and will come to you. Their failure mode is the quiet one: you do not get filled, you watch the move go without you, and you feel the itch to chase. Nothing is lost except the opportunity, and a missed entry has never emptied an account.

    Buy stop is an entry tool for breakout positions. You are deliberately paying a worse price in exchange for the market demonstrating something first. Its failure mode is slippage on entry plus the risk that the breakout was the high of the move. The cost is real but it is bounded by the stop you attach to it.

    Sell stop does two completely different jobs and this is the confusion worth clearing. As an entry, it opens a short on a breakdown. As an exit, it is the protective stop on every long you hold. The order type is identical. The consequence of a bad fill is not. A slipped entry costs you a worse starting price on a trade you chose to take. A slipped exit costs you more than the loss you signed up for on a trade that is already going wrong.

    Which is why the planning question is not which order type is best. It is: given that my protective order can fill past its level, is my position size small enough that a 2R or 3R outcome is survivable rather than structural? If the honest answer is no, the position is too large, and no choice of order type fixes that. Gaps around the weekend are the most predictable version of this, and I went through the mechanics in what is a weekend gap in gold trading.

    Four checks before you place any of the four

    These take under a minute and they are the difference between an order you understand and one you are hoping about.

    1. Say the guarantee out loud. Limit means my price or nothing. Stop means a fill at whatever is next. If you cannot say which one you just placed, you do not yet know what you placed.
    2. Check the side. Buy limit below, sell limit above, buy stop above, sell stop below. Platforms reject an order placed on the wrong side of price, and traders routinely misread that rejection as a broker problem rather than a sign they wanted the other order.
    3. Price the bad fill before you need it. Ask what a 2R outcome on this position does to your account. If the answer is uncomfortable, reduce size now, not after.
    4. Look at the calendar. A pending order left running into a scheduled release or over a weekend is a different order than it was when you placed it, because the distribution of next available prices has changed.

    What this article is not saying

    I want the limits stated plainly. The R multiples above are arithmetic on assumptions I chose to make the mechanism visible. They are not an estimate of how often gold gaps, by how much, or in which direction, and I have deliberately not offered one, because a credible figure would need a dataset and a method, not a confident sentence.

    Nothing here tells you which order to use, where to place it, or when. The regulatory figures are quoted from ESMA and apply to retail accounts under European rules at the time the measures were announced. Rules change, brokers differ, and your account may sit under a completely different regime.

    Free gold survival sheet

    Get the free Gold Empire survival sheet, a one page guide to protecting your account through the kind of fast market where a stop order fills a long way from the level you asked for. One email, no spam, unsubscribe anytime.

    Get the free survival sheet →

    Frequently asked questions

    What is buy limit sell limit buy stop sell stop, in the shortest possible answer?

    Limits sit on the favourable side of price and guarantee your price but not a fill. Stops sit on the unfavourable side and guarantee a fill but not your price. Buy limit is below, sell limit is above, buy stop is above, sell stop is below.

    Which of the four can lose me more than I planned?

    The two stop orders, because they become market orders when triggered. A sell stop used as a protective exit is the one that matters most, since a fill past the level turns a planned 1R loss into 1.25R, 1.50R, 2.00R or more depending on how far price travels before the fill.

    Is a sell limit the same as a take profit?

    On a long position, mechanically yes. A take profit above the market on a long is a sell limit, and it inherits the limit guarantee: you get your price or you do not transact. That is why a take profit never slips in your favour and never slips against you.

    Why did my platform reject my pending order?

    Usually because the level is on the wrong side of the current price for the type you chose, or because it is inside the minimum distance your broker enforces around the market. Both are rules of the order type and the venue rather than faults.

    Does a stop limit solve the slippage problem?

    It replaces one problem with another. A stop limit will not fill worse than your limit price, but if the market moves straight past that limit during a fast move, it does not fill at all, and you keep the position you were trying to exit. You are choosing which failure you would rather have.

    How much margin does a gold position need?

    Under the ESMA measures the retail cap for gold is 20:1, which puts minimum required margin at 5.00 per cent of notional, with the close out rule triggering at half that, 2.50 per cent. Outside that regime the numbers are set by your broker and can differ substantially.

    What Gold Empire actually does

    Gold Empire is a free channel about surviving in gold rather than getting rich in it. There is no signal service here and nothing is sold on the promise of a return. The free Gold Survival Sheet is a single page on protecting an account through exactly the kind of fast market this article describes, and the only thing it asks for is an email address you can unsubscribe from. Everything else, including the risk management guide underneath all of it, is simply published.

    The model is deliberate. Follow along for free, read the arithmetic, and decide for yourself. If a piece of writing ever makes you feel you must act immediately, that is a reason to be suspicious of the writing, including mine.

    About the author

    Matthew writes Gold Empire. He learned the difference between the price guarantee and the fill guarantee the expensive way, on a Sunday open, and has written the arithmetic down ever since rather than relearning it. He has no interest in telling anyone where price is going. You can read more about the approach on the about page.


    This article is educational and is not financial advice. Trading gold carries a high risk of losing money rapidly, and no entry, stop or target discussed should be treated as a signal. The regulatory figures are quoted from the European Securities and Markets Authority announcement linked above; the R multiples are arithmetic from stated assumptions, not estimates of real world frequency. Decide your own risk, and never trade money you cannot afford to lose.


  • What Is CPI in Gold Trading, and How Much Does One Print Move?

    What Is CPI in Gold Trading, and How Much Does One Print Move?

    If you have been trading gold for more than a month, you have met the eight thirty problem. The chart is quiet, the spread is normal, and then at a fixed minute everything widens at once and your position is suddenly worth something different. Ask what is CPI in gold trading and most answers stop at the definition: it is the Consumer Price Index, a measure of inflation, published monthly by the Bureau of Labor Statistics. True, and almost useless. The definition tells you nothing about the part that actually empties accounts, which is how much a single print moves the number everyone is watching, and how little that one print tells you about the trend it is supposed to measure.

    So this article does the arithmetic instead. I pulled the full monthly Consumer Price Index series, 955 observations running from January 1947 to August 2026, and measured the thing nobody measures: the size of the jump in the headline rate from one release to the next, and the gap between what a single month says and what the year actually says. The answers are not subtle, and they change how you should size risk around the calendar.

    What is CPI in gold trading, candlestick diagram of gold around a scheduled data release showing a quiet range before the print, a single candle spiking up and down, the widest spread immediately after, and direction only settling later
    What is CPI in gold trading: the release window is where the spread is widest and the fills are worst, which is a cost problem before it is a direction problem.

    What is CPI in gold trading, in the only sense that matters

    The Consumer Price Index tracks what a fixed basket of goods and services costs over time. The Bureau of Labor Statistics publishes it monthly, on a schedule set a year in advance, at a fixed time in the morning US Eastern time. Two versions matter to anyone watching a screen. The headline number includes everything. The core number strips out food and energy, on the argument that those two swing for reasons that have little to do with underlying inflation.

    Gold cares because gold has no yield. It pays no coupon and no dividend, so what it competes against is the real return on cash and bonds, which is the nominal rate minus inflation. When inflation data shifts the market’s view of what the Federal Reserve will do with rates, it shifts the opportunity cost of holding a metal that pays nothing. That is the entire transmission mechanism, and it runs through expectations rather than through the index level itself.

    Which is the first thing to understand. The CPI level is not news. It is published, it is known, and by the time you read it the market has already seen it. What moves price is the distance between the number and what the market had already priced. That distance is unknowable in advance, which is why the honest version of this article cannot tell you what to do at eight thirty, only what the distribution of outcomes looks like.

    How much does one print actually move the headline rate

    Here is the measurement that is missing from almost every explanation of this subject. Take the twelve month inflation rate, the figure quoted in every headline, and ask how much it changes from one monthly release to the next. Across the period since January 2000, which is 318 month to month comparisons:

    • The median change in the twelve month rate is 0.238 percentage points.
    • The mean change is 0.322 percentage points.
    • The largest single month change is 2.631 percentage points.
    • The rate moves by at least 0.1 points 79.9 per cent of the time, at least 0.2 points 58.5 per cent of the time, at least 0.3 points 40.9 per cent of the time, and at least 0.5 points 17.0 per cent of the time.

    Read that last line again. Four times out of five, the headline inflation rate is a different number than it was a month ago. The thing that is reported as though it were a fixed fact about the economy is in practice a quantity that wobbles by a quarter of a point most months, and occasionally by much more. The market knows this, which is why the release is scheduled as a risk event rather than treated as a routine update.

    One month is not the trend, and the gap is bigger than you think

    Now the second measurement, and the more useful one. Take a single month’s change in the index and annualise it, which is what a commentator is doing when they say inflation is running at such and such a pace. Then compare it with the trailing twelve month rate over the same period. Since 2000, across 319 observations:

    • The median gap between the one month annualised figure and the twelve month rate is 1.792 percentage points.
    • The gap is at least 1 point 71.8 per cent of the time.
    • The gap is at least 2 points 43.9 per cent of the time.
    • The gap is at least 3 points 28.8 per cent of the time.

    In other words, the story a single print tells disagrees with the story the year tells by more than a full percentage point in roughly seven months out of ten. The monthly standard deviation of the index change since 2000 is 0.3036 per cent, which annualises to 3.643 percentage points of noise around any single observation. One print is a noisy estimate of a slow variable, and the market reacts to it anyway, because the market is pricing the change in expectations rather than the truth about inflation.

    That distinction is the whole reason the first candle after a release so often reverses. The initial move prices the surprise. The minutes after it price the reconsideration of what the surprise actually means. Neither of those is a forecast you can make in advance, and no entry, stop or target discussed should be treated as a signal.

    Headline against core, and why both get quoted

    The headline and core measures disagree more than most people expect. Comparing the twelve month rates since 2000, the median absolute gap between them is 0.734 percentage points, and the headline figure sits above core in 56.1 per cent of months. As of the August 2026 data, the headline twelve month rate was 3.71 per cent and the core rate 2.76 per cent, a gap of about 0.95 points.

    This matters operationally rather than philosophically. Two numbers arrive in the same instant, they frequently point in different directions, and different parts of the market weight them differently. That is part of why the first reaction to a release is often disorderly, and why the spread during that window is the widest it will be all day. You are not being singled out. The liquidity is genuinely thinner, because the people providing it do not know the fair price either until the dust settles.

    The calendar is the part you can actually control

    Here is the practical turn. You cannot forecast the print. You can know exactly when it lands, and that is a real edge over the version of yourself who gets surprised.

    CPI is released twelve times a year. The Federal Reserve’s Open Market Committee met eight times in 2026, on 27 to 28 January, 17 to 18 March, 28 to 29 April, 16 to 17 June, 28 to 29 July, 15 to 16 September, 27 to 28 October and 8 to 9 December, with four of those meetings accompanied by the Summary of Economic Projections, according to the Federal Reserve’s published FOMC calendar. Add roughly twelve employment reports and you are looking at something in the order of thirty two scheduled high attention events in a year. That is about one every eleven days.

    Thirty two days out of roughly two hundred and fifty trading days is not a small share of the year, and it is entirely knowable in advance. The survival question is not how to trade those days. It is whether you have decided, before the week starts, what your exposure looks like when one arrives. A position sized for a quiet Tuesday is a different position on a release morning, even though nothing about your analysis changed.

    If you want the mechanics of the release window itself, the behaviour of spread and fills during high impact news is covered in more detail in how to trade gold through high impact news. The two other scheduled events in this family have their own pieces: what the FOMC is and why gold reacts, and what nonfarm payrolls means in gold trading. Taken together with this one, that is the full scheduled macro calendar a gold trader actually has to plan around.

    What the data does not say

    I want to be exact about the limits here, because this is the point where articles like this usually overreach.

    Nothing above measures how gold responds to CPI. It measures how CPI itself behaves, which is a different and more reliable thing. I have not computed an average gold move on release days, and I would be sceptical of anyone who quotes you one without showing the method, because the answer depends enormously on the window you choose, the period you sample and how you handle the days when something else was also happening.

    Nor does any of this tell you direction. A hot print does not mechanically send gold one way. The same number can be read as inflationary, which historically supports gold, or as something that will force higher rates, which raises the opportunity cost of holding it. Both readings are available in the same instant, which is precisely why the first move reverses so often.

    The numbers in this piece come from the monthly Consumer Price Index for All Urban Consumers, seasonally adjusted, produced by the Bureau of Labor Statistics and retrieved from the Federal Reserve Bank of St Louis’s published CPIAUCSL series, together with the core series that excludes food and energy. Every percentage in this article was computed from that data rather than recalled, and the method is stated beside each figure so you can reproduce it.

    How I would actually use this

    Three things follow, and none of them is a trade.

    First, put the release dates in whatever you plan your week in. Not to trade them, but so that no release is ever a surprise. The entire cost of being surprised is paid in the first sixty seconds, and it is avoidable for free.

    Second, decide your release day exposure once, in advance, in writing, when nothing is happening. Deciding at eight twenty nine is not deciding, it is reacting, and the arithmetic above says you are reacting to a quantity that disagrees with its own twelve month trend by more than a point most of the time.

    Third, stop treating a single print as information about the economy. It is one noisy observation of a slow moving variable, with a standard deviation that annualises to more than three and a half points. The twelve month rate is the signal. The monthly number is mostly the noise around it, and the market trades the noise because the noise is what is new.

    That is the honest answer to what is CPI in gold trading. It is a scheduled, measurable, highly repetitive risk event, whose headline figure moves by at least a tenth of a point four times out of five, and whose monthly reading disagrees with its own annual trend by more than a point seven times out of ten. You cannot predict it. You can absolutely plan around it, and the planning is where the survival is.

    Free gold survival sheet

    Get the free Gold Empire survival sheet, a one-page guide to protecting your account through the kind of market this article describes. One email, no spam, unsubscribe anytime.

    Get the free survival sheet →

    Frequently asked questions

    What is CPI in gold trading, in one sentence?

    It is the monthly Consumer Price Index release, a scheduled inflation measurement that moves gold indirectly by changing what the market expects from interest rates, and therefore the opportunity cost of holding an asset that pays no yield.

    Does a high CPI number always push gold up?

    No, and the assumption that it does has cost people a lot of money. A hot reading can be read as inflation, which has historically supported gold, or as a reason rates stay higher for longer, which works against it. Both interpretations compete in the same minute, which is one reason the first move after a release so frequently reverses.

    How much does the inflation rate change between releases?

    Since 2000 the twelve month headline rate has changed by a median of 0.238 percentage points from one month to the next, moving at least 0.1 points in 79.9 per cent of months and at least 0.5 points in 17.0 per cent of months. The largest single month change in that period was 2.631 points.

    Should I close my positions before CPI?

    That is a decision about your own risk tolerance and your own plan, not something an article can answer for you, and nothing here is a recommendation. What the data supports is narrower and more useful: the decision should be made in advance rather than in the minute before the release, because the release window is reliably where the spread is widest and the fills are worst.

    Is core CPI more important than headline?

    Neither is simply more important. They disagree by a median of 0.734 percentage points, and the headline sits above core in 56.1 per cent of months since 2000. Different participants weight them differently, which is part of why the immediate reaction to a release is often disorderly.

    What Gold Empire actually does

    Gold Empire is a free channel about surviving in gold rather than getting rich in it. There is no signal service here and nothing is sold on the promise of a return. The free Gold Survival Sheet is a single page on protecting an account through exactly the kind of week this article describes, and the only thing it asks for is an email address you can unsubscribe from. Everything else, including the risk management guide that sits underneath all of this, is simply published.

    The model is deliberate. Follow along for free, read the arithmetic, and decide for yourself. If a piece of writing ever makes you feel you must act immediately, that is a reason to be suspicious of the writing, including mine.

    About the author

    Matthew writes Gold Empire. He spent long enough learning the expensive way that scheduled events are the cheapest risk to manage, because they are the only ones that announce themselves in advance, and he now writes the arithmetic down instead of relearning it. He has no interest in telling anyone where price is going. You can read more about the approach on the about page.


    This article is educational and is not financial advice. Trading gold carries a high risk of losing money rapidly, and no entry, stop or target discussed should be treated as a signal. Figures are computed from the published Consumer Price Index series as described above and were accurate at the time of writing. Past behaviour of any data series is not a prediction of its future behaviour. Decide your own risk, and never trade money you cannot afford to lose.


  • Is Buying Gold Worth It? What the Demand Data Actually Shows

    Is Buying Gold Worth It? What the Demand Data Actually Shows

    A member wrote to me in September with one line: “My brother keeps telling me to put money into gold. Is buying gold worth it, or is he just repeating something he heard?” I liked the question because it was honest about not knowing, and because it is almost impossible to answer in the form it was asked. Worth it compared to what, over what period, and to do what job? Nobody can tell you what gold will be worth next year, and anyone who offers to is selling something.

    What I can do is show you who actually buys the metal, in what quantity, and for what stated reason. That is a matter of public record, published quarterly, and it is far more useful than a forecast. So this article is a reading of the demand data, plus my own arithmetic on what holding gold costs you while you wait.

    Every calculation below is mine, from assumptions I write out as I go. The tonnage figures come from the World Gold Council’s quarterly report, linked where I use them. There is no gold price anywhere in this article, no target, and no recommendation to buy anything.

    Is buying gold worth it? Start by asking who is already buying

    In the second quarter of 2026, total gold demand including over the counter activity came to 1,268.9 tonnes, unchanged against the same quarter a year earlier. The first half of the year ran to 2,522 tonnes, about two per cent higher than the year before, at a record total value of 380 billion dollars. Those figures are in the World Gold Council’s Gold Demand Trends report for the second quarter of 2026, published on 30 July 2026.

    Underneath that flat headline, the composition is the interesting part. Four groups buy gold, and they do not want the same thing from it.

    • Central banks and other institutions took 288.9 tonnes in the quarter.
    • Bar and coin buyers, which is private individuals holding metal, took 307.1 tonnes.
    • Jewellery consumption came to 278.2 tonnes, the lowest quarterly volume since the pandemic.
    • Technology, mostly electronics, used 80.4 tonnes.
    • Gold backed exchange traded funds went the other way entirely, shedding 44.8 tonnes.

    Run the division and central banks were 22.8 per cent of total demand in the quarter. That is my calculation, 288.9 divided by 1,268.9. Close to a quarter of everything bought was bought by institutions whose job is not to make a return.

    The buyer who never explains himself in a quarterly call

    I want to sit on the central bank number, because it is the one most retail arguments about gold ignore completely.

    Look at the run of quarters. Central banks took 177.9 tonnes in the second quarter of 2025, then 226.3, then 208.2, then a sharp slowdown to 56.5 tonnes in the first quarter of 2026, then 288.9 tonnes in the second. Add the last four of those and you get 779.9 tonnes in a year, an average of 195 tonnes a quarter. That addition is mine, from the same published table.

    Is buying gold worth it, chart of central bank net gold purchases by quarter, rising from 177.9 tonnes in Q2 2025 to 288.9 tonnes in Q2 2026
    Is buying gold worth it: central bank net purchases, quarter by quarter, from the World Gold Council’s published table.

    Central banks are not momentum buyers. They do not have a stop loss, they are not trying to beat an index, and they are not going to sell because the chart looked ugly on a Tuesday. They hold gold because it is a reserve asset that is nobody else’s liability. That last phrase is the whole of it. A government bond is a promise from a government. A bank deposit is a promise from a bank. A bar of gold in a vault is not a promise from anyone, which is exactly why it is dull and exactly why institutions keep it.

    You can watch this yourself month by month in the World Gold Council’s monthly central bank statistics, which are built from reported official reserve data rather than from anyone’s opinion.

    Two sets of buyers walked in opposite directions last quarter

    Here is the detail I find most instructive for a private buyer. In the same three months, central banks bought 288.9 tonnes while exchange traded funds shed 44.8 tonnes. The gap between the two is 333.7 tonnes, my subtraction.

    The Council attributes the fund outflows to softer gold prices and to shifting expectations for inflation and interest rates, particularly in North America. That is a perfectly rational response from a fund investor, who is holding gold as a position and will reduce it when the case for the position weakens.

    So the two groups are not disagreeing about the facts. They are holding gold for different jobs. One treats it as a trade that can be wrong. The other treats it as a reserve that does not need to be right this year. Before you decide whether buying gold is worth it for you, decide which of those two people you are. The answer changes everything that follows, including how much a bad quarter should bother you.

    What it costs to hold, which almost nobody counts

    Owning gold is not free, and the cost is quiet enough that people forget to subtract it.

    Physical metal costs a dealer margin when you buy, a spread when you sell, and either storage or the risk of keeping it at home. A fund charges an annual management fee. That fee is small enough to ignore in any single year and large enough to matter over the holding period a reserve asset implies.

    Let me put numbers on it. Assume a fee charged annually against the value of the holding, no trading, and no tax. The fraction of your stake the fee consumes over a period is one minus the quantity one minus the fee, raised to the number of years. On that basis:

    • At 0.25 per cent a year, ten years consumes 2.47 per cent of the stake, and twenty years 4.88 per cent.
    • At 0.40 per cent a year, ten years consumes 3.93 per cent, and twenty years 7.70 per cent.
    • At 0.75 per cent a year, ten years consumes 7.25 per cent, and twenty years 13.98 per cent.

    Those are my calculations, and the assumptions are stated above so you can redo them with your own fee. The point is not that 0.75 per cent is scandalous. The point is that a reserve you intend to hold for twenty years should be bought in the cheapest wrapper you can find, because the fee compounds against you for the entire holding period while the reason you bought it sits unchanged.

    If you want the comparison between wrappers done properly, gold ETF versus physical gold returns and whether to buy physical gold or gold stocks cover the two choices either side of this one.

    Where supply comes in, and why it moves less than you would think

    Total supply in the quarter was also 1,268.9 tonnes, matching demand as it must in this accounting. Mine production contributed 965.6 tonnes, up two per cent on the year. Recycling contributed 326.1 tonnes, down six per cent, as softer prices discouraged people from selling old jewellery.

    Notice how small those movements are. Mining gold is slow. A new deposit takes many years to reach production, which means supply cannot respond quickly to a change in demand. That is the structural fact behind most of gold’s behaviour, and it is worth understanding before you form a view on whether owning any is sensible.

    Recycling is the faster valve, and it works in the direction you would expect: when the metal is dear, more old jewellery comes back to the refiners, and when it softens, less does. The six per cent decline is that valve closing slightly.

    What gold does not do, said plainly

    This is the part of the answer my member’s brother had skipped.

    Gold produces no income. A bar in a vault pays no dividend, no coupon and no rent, and in twenty years it will still be the same bar. Everything you make or lose is the change in what somebody else will pay for it. That is a real limitation, not a technicality, and it is why gold is a poor substitute for assets that generate cash.

    Gold is also not insurance in the sense people mean when they say it. It does not reliably rise when equities fall, in any given week or month, and a buyer who expects that precise behaviour will be disappointed on a regular basis.

    And gold is capable of long, boring periods of going nowhere while other things rise. If you cannot sit through that without changing your mind, the demand data in this article will not save you, because the behaviour that erodes accounts is not usually the choice of asset. It is the changing of that choice halfway through under pressure.

    Trading gold and owning gold are different activities

    I should separate two things that get blurred, because most readers of this site arrive through the trading door.

    Owning gold is a decision about what fraction of your savings sits in an asset that is nobody’s liability. It is measured in years and it does not involve leverage.

    Trading gold is something else. It is a leveraged position on short term price movement, where the dominant risk is not whether gold is a sensible asset but whether your position is too large for your account. The demand numbers in this article tell you almost nothing about that, and I would not want anyone reading a 288.9 tonne figure as a reason to take a position of any particular size. If trading is what you are weighing, how much money to start trading gold is the more relevant piece, and the sizing arithmetic in it matters more than any demand statistic.

    Free gold survival sheet

    Get the free Gold Empire survival sheet, a one-page guide to protecting your account through the kind of market this article describes, including how to decide what a holding is for before you fund it. One email, no spam, unsubscribe anytime.

    Get the free survival sheet →

    Frequently asked questions

    Is buying gold worth it for a small saver?

    That depends entirely on the job you want it to do, and I will not answer it as a recommendation. What the data supports is narrower: institutions bought 288.9 tonnes in the second quarter of 2026, close to a quarter of all demand, and they buy it as a reserve rather than for a return. If you want an asset that produces income, gold is the wrong instrument. If you want a small part of your savings in something that is not a promise from an institution, that is the case people are actually making, and the sensible size of it is a question for your own circumstances.

    Why did funds sell gold in the same quarter central banks bought it?

    Because they hold it for different reasons. Exchange traded funds shed 44.8 tonnes in the quarter, which the World Gold Council attributes to weaker prices and to shifting inflation and interest rate expectations. A fund investor holds gold as a position that can be wrong. A central bank holds it as a reserve that does not need to be right this year.

    Does the record demand value mean gold is expensive?

    No, and this is a common misreading. The first half of 2026 set a record total value of 380 billion dollars on 2,522 tonnes. Value equals tonnes multiplied by price, so a record value can come from a higher price rather than from more metal changing hands. Volume was up about two per cent. Read tonnes when you want to know about demand and value when you want to know about the size of the market.

    How much does holding gold cost each year?

    It depends on the wrapper. Physical metal costs a dealer margin at both ends plus storage. A fund charges an annual fee. On my arithmetic, assuming the fee is charged yearly against the holding, a 0.40 per cent fee consumes 3.93 per cent of the stake over ten years and 7.70 per cent over twenty. That is not a reason to avoid funds, it is a reason to compare fees when the intended holding period is long.

    Is jewellery a good way to own gold?

    Jewellery consumption was 278.2 tonnes in the quarter, the lowest since the pandemic, with spending up 14 per cent as prices rose and volumes fell. As an ornament it is its own reward. As a holding it carries a large making charge you rarely recover on sale, so the gap between the buying price and the selling price is wider than for a bar or a fund.

    Should I trade gold instead of owning it?

    They are different activities and the second is considerably more dangerous. Trading involves leverage, and with leverage the size of the position decides the outcome far more often than the view does. Nothing in this article is a reason to open a position, and no figure here says anything about where the price goes next.

    Where Gold Empire fits

    Gold Empire is a free education channel about surviving in gold before trying to grow in it. Everything here is free to read and free to follow on Telegram. The one optional piece is the survival sheet above, a single page on protecting an account. We do not promise profits, we do not publish account results, and we do not believe anyone can tell you what your account or your savings will do. If you want the fuller version of the thinking behind this site, risk management for gold trading is the piece everything else hangs off.

    About the author. Matthew writes Gold Empire. He bought his first gold for the wrong reason, a forecast he had read and could not have defended, and he has spent the years since learning to ask what a holding is for before asking what it will be worth. Nothing in this article is financial advice or a recommendation to buy or trade, and no entry, stop or target discussed should be treated as a signal. Trading leveraged gold carries a substantial risk of loss and is not suitable for everyone.