
There is a particular kind of expensive confusion that happens on inflation day. The Consumer Price Index comes in hot, the headlines say inflation is back, gold does something for ninety seconds, and then it does the opposite. You conclude that the market is irrational. It is not. Part of what happened is that you and the Federal Reserve were looking at two different inflation numbers. So, what is PCE in gold trading, and why does the measure nobody quotes matter more than the one everybody quotes? The short answer is that the Fed’s two per cent target is not written in terms of CPI at all. It is written in terms of PCE, and the two disagree far more often than most traders realise.
This article does the arithmetic. I pulled the monthly Personal Consumption Expenditures price index from the Bureau of Economic Analysis, 812 months from January 1959 to August 2026, and the monthly Consumer Price Index from the Bureau of Labor Statistics, measured the gap between them month by month, then checked which of the two actually lines up with how gold moves. The results are not close.
What is PCE in gold trading, in the only sense that matters
PCE stands for Personal Consumption Expenditures. The price index built from it is produced monthly by the Bureau of Economic Analysis, and it measures what Americans actually spent on goods and services, including spending made on their behalf by employers and government programmes. CPI, by contrast, measures the cost of a fixed basket bought directly out of pocket by urban consumers.
That difference in construction sounds like a statistician’s quibble. It is not, because of one sentence. In its Statement on Longer-Run Goals and Monetary Policy Strategy, the Federal Open Market Committee writes that it “reaffirms its judgment that inflation at the rate of 2 percent, as measured by the annual change in the price index for personal consumption expenditures, is most consistent over the longer run with the Federal Reserve’s statutory maximum employment and price stability mandates.” You can read that statement in full on the Federal Reserve’s own site.
Read it slowly. The target is two per cent. The yardstick is the PCE price index. CPI is not mentioned. So when a CPI print lands and you reason forward to what the Fed will do, you are using a proxy for the committee’s actual measure without knowing how big the error on that proxy is.
That is why this matters to a gold trader. Gold pays no coupon and no dividend, so what it competes against is the real return available on cash and bonds, roughly the nominal rate minus inflation. The chain runs from inflation data, to what the market expects the Fed to do, to real rates, to the opportunity cost of holding a metal that yields nothing. If the first link is a measure the Fed does not target, the chain is weaker than you think.
How far apart are the two numbers, actually
Here is the measurement. Take the twelve month inflation rate on both measures, the figure quoted in every headline, and compare them in the same month. Across 703 months from January 1968 to August 2026:
- CPI inflation runs above PCE inflation by a mean of 0.508 percentage points and a median of 0.437 points.
- CPI is the higher of the two in 83.9 per cent of all months.
- The two measures differ by at least 0.3 points in 66.0 per cent of months, by at least 0.5 points in 47.4 per cent of months, and by at least a full percentage point in 15.2 per cent of months.
- The widest the gap has ever been is 3.74 points, in June 1980. The most negative was minus 1.78 points, in August 1983.
Sit with the third line. In roughly one month out of every two, the two official inflation measures for the same economy in the same month differ by half a percentage point or more. These are not rounding errors. Half a point is the difference between a number that sounds tolerable and a number that sounds like a problem.
The bias is persistent and it has a known cause. CPI holds its basket relatively fixed, while PCE reweights as spending patterns shift, so when people substitute away from whatever is getting expensive, PCE captures that and CPI largely does not. PCE also has broader scope, most notably in health care, where it counts spending made on a consumer’s behalf. The Bureau of Economic Analysis sets out the construction on its PCE price index page. The direction of the bias is not random, which is why CPI sits on top more than four times out of five.
The same month, read two ways
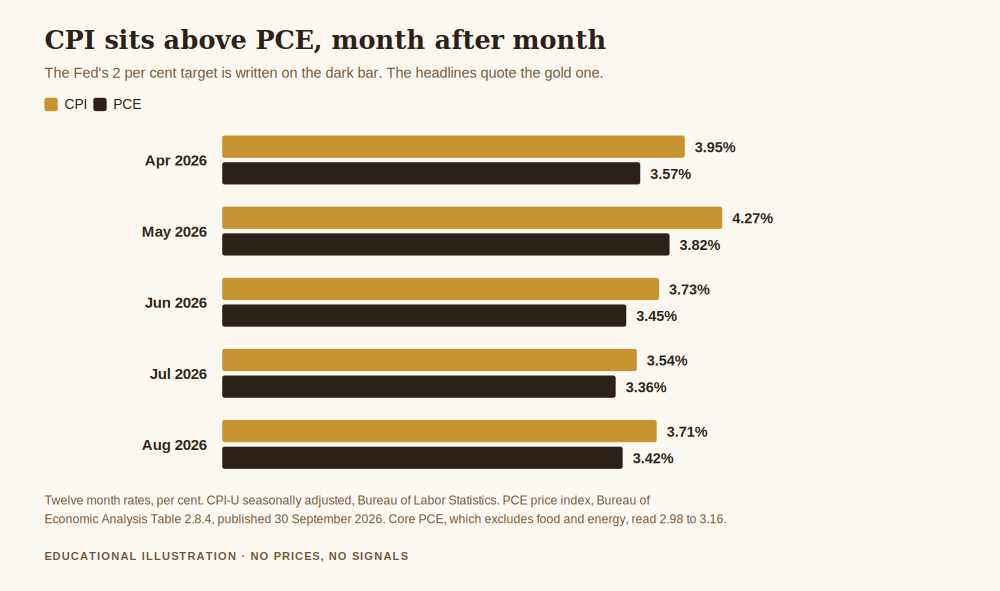
Abstractions are easy to nod along to, so here are the last few months of data as they actually arrived. All figures are twelve month rates, in per cent.
- April 2026: CPI 3.95, PCE 3.57, core PCE 3.08. Gap of 0.37 points.
- May 2026: CPI 4.27, PCE 3.82, core PCE 3.16. Gap of 0.45 points.
- June 2026: CPI 3.73, PCE 3.45, core PCE 3.04. Gap of 0.27 points.
- July 2026: CPI 3.54, PCE 3.36, core PCE 2.98. Gap of 0.18 points.
- August 2026: CPI 3.71, PCE 3.42, core PCE 3.01. Gap of 0.29 points.
Look at May. A trader watching CPI saw 4.27 per cent, a number comfortably more than double the target, the sort of print that gets described as inflation running out of control. The committee’s own measure said 3.82 per cent, and the core version of it, which strips food and energy, said 3.16 per cent. Those are three materially different stories about the same month, and the one that governs policy is the one that was quoted least. Note too how much steadier core is across those five months: it moves between 2.98 and 3.16 while headline CPI swings from 3.54 to 4.27.
Why the Fed watches the boring version
Across all 800 months for which both are available, the standard deviation of headline PCE inflation is 2.382 percentage points, against 2.084 points for core PCE, which excludes food and energy. The sharper difference is month to month: the median change in the headline twelve month rate from one release to the next is 0.149 percentage points, against 0.086 points for core. The headline figure jumps around roughly 1.7 times as much between releases as the core figure does.
That is the practical case for core. It is not that food and energy do not matter to households, because obviously they do. It is that they swing for reasons monetary policy cannot address within the horizon over which policy works, so a committee trying to read the underlying trend gets a cleaner signal from the series without them. When officials talk about the trend, they are usually talking about core PCE.
One more figure worth keeping in perspective. Of those 800 months, the PCE twelve month rate sat within a quarter of a point of the two per cent target in only 12.5 per cent of them, and in 19.7 per cent of months since 1995. For about four months in five, inflation is not at target. Being away from target is the normal state of the world, not a crisis.
What gold actually tracks, measured
Now the part that connects this to a chart. I took monthly gold returns from the World Bank’s commodity price series, the monthly ten year US Treasury yield from the Federal Reserve’s H.15 release of selected interest rates, and PCE inflation from the BEA, over the 283 months from February 2003 to August 2026. Then I built a crude real yield as the nominal ten year yield minus the trailing twelve month PCE inflation rate, and measured how monthly gold returns correlate with changes in each quantity.
- Change in the real yield: correlation minus 0.308, which is an R squared of 9.5 per cent.
- Change in the nominal ten year yield: correlation minus 0.263, an R squared of 6.9 per cent.
- Change in PCE inflation on its own: correlation plus 0.152, an R squared of 2.3 per cent.
The ordering is the finding. Gold’s monthly behaviour lines up with the direction of real yields about four times more strongly, measured by variance explained, than with the direction of inflation by itself. The sign on the real yield is negative, which is what the opportunity cost argument predicts: when the real return on bonds rises, the case for holding a metal that pays nothing weakens.
This is exactly why a hot inflation print does not mechanically send gold up. A hot print raises inflation, which taken alone is the plus 0.152 column and faintly supportive. But the same print can raise the expected path of policy rates by more, which lifts the real yield, and that is the minus 0.308 column and the stronger effect. Two forces, opposite directions, and the stronger one often wins. That is a better explanation for the ninety second move that reverses than irrationality.
What this does not say
An R squared of 9.5 per cent is a real relationship and a weak one. Roughly ninety per cent of gold’s monthly variation comes from things not in this calculation, so anyone telling you real yields determine the gold price is overstating what I can measure. The honest claim is narrower: of the three quantities tested, real yields are the one gold attends to most, and inflation alone the one it attends to least.
My real yield is also computed after the fact, from inflation already published. The real yield the market actually prices is forward looking and best read from inflation protected securities, which is a different series. I used the cruder version because it can be built entirely from two primary sources a reader can check, and I would rather flag the approximation than hide it. Monthly data cannot see the first minutes after a release either, so nothing here measures an intraday reaction.
Finally, none of this is directional. There is no state of the inflation data that tells you what gold will do next. The arithmetic explains why the relationship you were taught is unreliable, and it does not replace it with a better rule, because there is not one, and no entry, stop or target discussed should be treated as a signal.
How I would actually use this
Three things follow, and none of them is a trade.
First, when you are reasoning about what the Fed might do, reason about PCE, and preferably core PCE, because that is the measure in the committee’s own mandate sentence. CPI is a decent proxy with a known bias of about half a point and an error that exceeds a full point in one month out of seven. Use it knowing that.
Second, stop expecting inflation prints to push gold in a fixed direction. Gold attends to real yields roughly four times more than to inflation on its own, and a single print moves both at once. Expecting a clean reaction to a messy, two sided input is how people end up convinced the market is rigged against them.
Third, treat PCE day as a scheduled event in the same way as CPI day and FOMC day. It arrives monthly, the date is published in advance, and the only cost you can genuinely control is the cost of being surprised by a calendar you could have read a week earlier.
So that is the answer to what is PCE in gold trading. It is the measure that actually defines the Fed’s two per cent target, it runs on average about half a point below the CPI figure in the headlines, it disagrees with that figure by more than a full point in fifteen per cent of months, and its core version is the steadier series officials lean on. If you trade around inflation data, watch the number the decision makers are watching.
Get the free Gold Empire survival sheet, a one-page guide to protecting your account through the kind of market this article describes. One email, no spam, unsubscribe anytime.
Frequently asked questions
What is PCE in gold trading, in one sentence?
It is the Personal Consumption Expenditures price index, the inflation measure the Federal Reserve actually uses to define its two per cent target, which makes it the more relevant of the two official inflation numbers when you are reasoning about interest rates and therefore about the opportunity cost of holding gold.
Is PCE more important than CPI?
For working out what the Fed is likely to do, yes, because the committee’s own mandate sentence names PCE and does not name CPI. For understanding what households are paying out of pocket, CPI is the closer fit. They answer different questions, which is why both are published.
How different are CPI and PCE in practice?
Over 703 months to August 2026, CPI inflation ran above PCE inflation by a mean of 0.508 percentage points, and was the higher number in 83.9 per cent of months. The two differed by at least half a point in 47.4 per cent of months and by more than a full point in 15.2 per cent of months.
Why did gold fall when the inflation number came in hot?
Most likely because the print moved two things at once. It raised inflation, which on its own is mildly supportive of gold, but it also raised the expected path of interest rates, which lifts real yields, and the measurements in this article show gold is roughly four times more responsive to real yield changes than to inflation changes alone. The stronger force often wins.
What is core PCE and why do officials keep mentioning it?
Core PCE is the same index with food and energy excluded. It is the steadier series: its twelve month rate moves by a median of 0.086 percentage points between releases against 0.149 points for the headline measure, so it gives a cleaner read on the underlying trend that policy can actually influence.
What Gold Empire actually does
Gold Empire is a free channel about surviving in gold rather than getting rich in it. There is no signal service here and nothing is sold on the promise of a return. The free Gold Survival Sheet is a single page on protecting an account through exactly the kind of week this article describes, and the only thing it asks for is an email address you can unsubscribe from. The risk management guide that sits underneath all of this is simply published, as is the rest of the scheduled macro calendar series: what CPI is in gold trading, what the FOMC is and why gold reacts, and what nonfarm payrolls means in gold trading.
The model is deliberate. Follow along for free, read the arithmetic, and decide for yourself. If a piece of writing ever makes you feel you must act immediately, that is a reason to be suspicious of the writing, including mine.
About the author
Matthew writes Gold Empire. He spent years assuming the inflation number on the news was the inflation number that mattered, which is a cheap mistake to fix and an expensive one to keep, and he now reads the committee’s own wording instead of the headline. He has no interest in telling anyone where price is going. You can read more about the approach on the about page.
This article is educational and is not financial advice. Trading gold carries a high risk of losing money rapidly, and no entry, stop or target discussed should be treated as a signal. Figures are computed from the published Personal Consumption Expenditures price index from the Bureau of Economic Analysis, the Consumer Price Index from the Bureau of Labor Statistics, the Federal Reserve H.15 interest rate release and the World Bank monthly commodity price series, as described above, and were accurate at the time of writing. Past behaviour of any data series is not a prediction of its future behaviour. Decide your own risk, and never trade money you cannot afford to lose.
One step first
Where should we send the Gold Survival Sheet?
Leave your email and we will send the free one page checklist, then take you straight to the Telegram channel.
No cost and no obligation. Educational only, not financial advice, and nothing here promises a return. Unsubscribe any time in one click.
Leave a Reply