Category: Gold / XAU-USD Basics

  • What Is an OCO Order in Gold Trading, and Why MetaTrader Has None

    What Is an OCO Order in Gold Trading, and Why MetaTrader Has None

    Sooner or later every gold trader asks the same question in the same tone of mild frustration: what is an oco order, and why can I not find one in my platform? You read about OCO orders on a stock forum, or someone in a chat told you to “just set an OCO around the range,” and then you open MetaTrader, look through the order ticket, and there is no such button. You start to wonder whether your broker gave you a cut down version of the platform.

    Your broker did not. The button is not there because the order type is not there, and understanding why is worth more to your account than the button would have been.

    What an OCO order actually is

    OCO stands for one cancels the other. It is a pair of orders joined by a rule: if either one executes, the platform automatically cancels the other. The whole point is exclusivity. You are telling the venue that exactly one of two things may happen, never both, and never neither by accident.

    People reach for it in two very different situations, and it matters which one you are in.

    The first is a bracket around a position you already hold. You are long, and you want out at a loss below or a gain above, whichever arrives first. The moment one side fills, the other must vanish, because otherwise it would open a fresh position in the opposite direction.

    The second is a breakout straddle on a position you do not hold yet. Gold is coiled in a range before a data release, you do not care which way it breaks, so you put a buy stop above and a sell stop below and let the market choose. Whichever triggers, the other should be cancelled. If the difference between those two order types is not yet second nature, buy stop and buy limit explained is the groundwork for this article.

    Those two uses look similar on a chart. In terms of what can go wrong, they are nothing alike, and most of the trouble I have watched people walk into comes from treating the second like the first.

    What is an OCO order in gold trading, and what MetaTrader gives you instead

    Here is the part nobody says plainly. MetaTrader 5 has no OCO order type. Not hidden, not premium, not broker dependent. It simply does not exist in the platform’s order model.

    You can check this against the platform’s own documentation rather than taking my word for it. The MQL5 reference for order properties lists every value the platform recognises in its ENUM_ORDER_TYPE enumeration. There are nine of them: two market orders, buy and sell; six pending orders, being buy limit, sell limit, buy stop, sell stop, buy stop limit and sell stop limit; and one housekeeping type for closing a position with an opposite one. That is the complete list. There is no OCO entry, and the words “one cancels the other” do not appear on the page at all.

    So when someone tells you to set an OCO in MetaTrader, they are describing something the platform cannot do as a single instruction. What you can do is one of two things, and the difference between them is the whole article.

    The stop and the target you already have are an OCO pair

    If your OCO is a bracket around an open position, you already have it, and you have had it all along.

    Attach a stop loss and a take profit to a position in MetaTrader and you have built a one cancels the other pair without knowing it. The two levels are properties of the position, not independent orders sitting in the market. When one of them triggers, the position closes. Once the position is closed there is nothing left for the other level to act on, so it stops existing as a matter of arithmetic rather than as a matter of the platform remembering to cancel something.

    This is the quietly important bit. A native OCO relies on the venue’s cancel logic firing correctly in a fast market. A stop and target attached to a position rely on the position simply no longer being there. The second is structurally safer, because there is no cancellation that can arrive late. Where those two levels belong is a separate and harder question, which I have worked through in where to place a stop loss on XAUUSD.

    If you have ever wondered why the platform’s own trading concepts documentation treats stop loss and take profit as attributes of a position rather than as orders in a list, that is why. They are not two orders that happen to be related. They are two exit conditions on one thing.

    So for the bracket use case, the honest answer to what is an oco order in MetaTrader is: it is your stop and your target, and it is already working. Nothing to install, nothing to ask your broker for.

    The breakout straddle is where it goes wrong

    The second use case is the one that costs money, and it costs money precisely because there is no native OCO to protect you.

    You want to catch a break out of a range in either direction, so you place a buy stop above and a sell stop below. Two independent pending orders. Neither one knows the other exists. There is no rule joining them, because the platform has no way to express that rule.

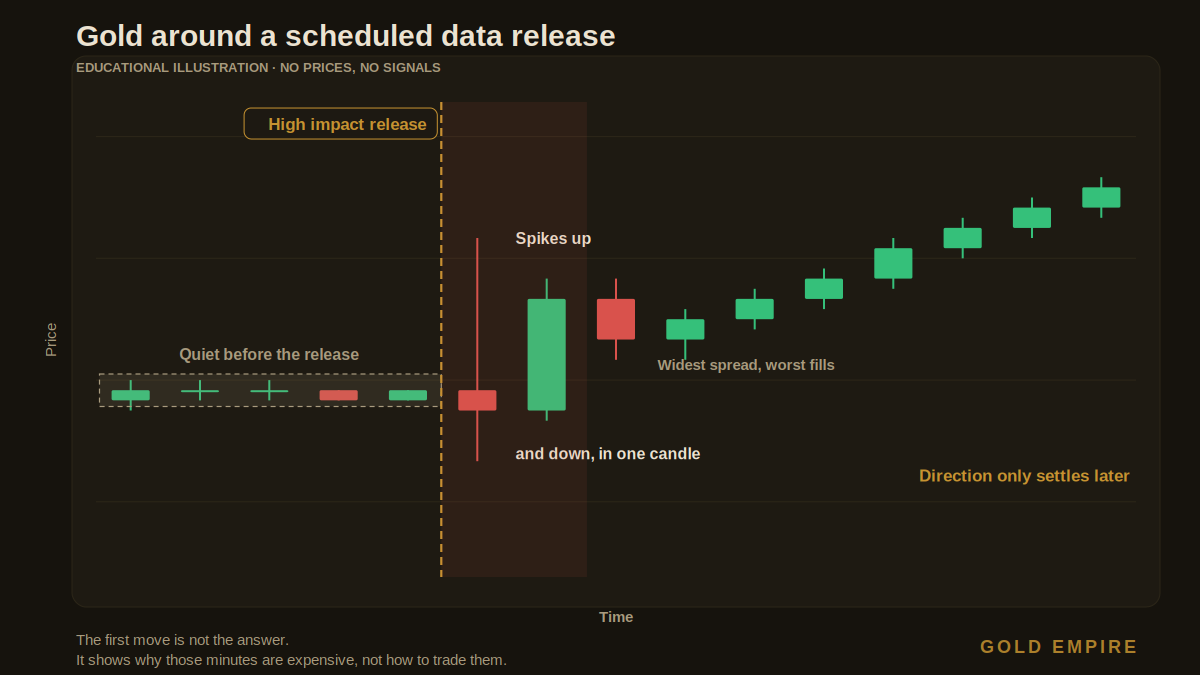
    Now ask what happens in the exact market condition you placed them for. A data release lands, gold spikes up through your buy stop, reverses hard within the same minute, and runs down through your sell stop. Both orders fill. You are now long and short at the same time.

    People’s first reaction is relief: net exposure zero, so no harm done. That reaction is wrong, and it is wrong in a way that shows up on the statement rather than on the chart.

    Chart for what is an oco order showing the cost of a double fill when both simulated OCO legs trigger in gold trading
    What is an OCO order worth in MetaTrader: the cost of a double fill when both legs of a simulated bracket trigger.

    The arithmetic, with every assumption named

    Let me put real figures on it. I am going to state every assumption, because a number without its assumptions is decoration.

    Assume a standard retail gold contract where 1.00 lot is 100 troy ounces. Assume you placed each leg at 0.10 lot, so 10 ounces per side. Assume the spread at the moment of fill is 0.30 US dollars per ounce, which is wide but realistic in the seconds after a release. Assume commission of 3.50 US dollars per lot per side. Notice that no gold price appears anywhere in this calculation. Every figure below is a difference, not a level, which is exactly why the arithmetic holds whatever gold happens to be doing.

    Spread cost on one side is 10 ounces at 0.30, so 3.00 dollars. Commission on one side is 3.50 dollars per lot times 0.10 lot, so 0.35 dollars. Opening one position therefore costs 3.35 dollars.

    If both legs fill, you paid that twice: 6.70 dollars to open. And because you now hold two positions instead of one, you have to close two, so you pay the exit side twice as well. The intended trade, opened and closed, costs 6.70 dollars in total. The double fill, opened and closed, costs 13.40 dollars.

    That is a 100 percent cost penalty for a net position of zero. You paid double to achieve nothing. And that is before the two positions sit overnight and collect two separate financing charges, one on each side, which is a subject I have written about separately in what swap is in gold trading.

    Scale it and the point sharpens. At 1.00 lot per leg rather than 0.10, opening one position costs 33.50 dollars, and the same arithmetic gives 67.00 dollars for the intended round trip against 134.00 dollars for the double fill. The percentage does not change. The dollars do.

    Fill policy decides what happens to the rest of your order

    There is a second mechanism here that most people never look at, and it is on the same documentation page as the order types.

    Every order carries a fill policy, and MetaTrader defines three. Fill or kill means, in the documentation’s own words, that “an order can be executed in the specified volume only. If the necessary amount of a financial instrument is currently unavailable in the market, the order will not be executed.” Immediate or cancel means “a trader agrees to execute a deal with the volume maximally available in the market within that indicated in the order. If the request cannot be filled completely, an order with the available volume will be executed, and the remaining volume will be canceled.” Return means “in case of partial filling, an order with remaining volume is not canceled but processed further.”

    Read that third one again with the straddle in mind. Under a return policy, a partially filled leg leaves a live remainder in the market. So the failure mode is not only “both legs filled.” It can be “one leg filled, the other partially filled, and a fragment of the second is still sitting there waiting.” You now hold a position whose size you did not choose and a working order you have forgotten about.

    None of this is exotic. It is the ordinary behaviour of a platform that has no OCO order type, being asked to do an OCO order’s job by a trader who assumed the platform would join the two orders up.

    Free gold survival sheet

    Get the free Gold Empire survival sheet, a one-page guide to protecting your account through the kind of market this article describes. One email, no spam, unsubscribe anytime.

    Get the free survival sheet →

    What to do instead, in plain terms

    For a bracket on an open position, use the stop and target attached to the position. That is your OCO, it is structurally safer than a native one, and it needs nothing added.

    For a two sided breakout, accept that you are running two unlinked orders and manage the consequence rather than pretending it away. That means being present when the orders can trigger, because the only thing that cancels the losing leg is you. It means sizing each leg on the assumption that both could fill, not one. And it means knowing your fill policy, so a partial fill does not leave a fragment behind.

    If a genuine linked OCO matters to how you trade, then it is a platform question rather than a technique question, and it belongs in the same conversation as spreads, execution and financing when you are choosing a broker for gold trading. Some venues outside the MetaTrader family do offer native OCO. That is a legitimate reason to prefer one, as long as you are honest that you are choosing it for the order type and not because a new platform will fix a process problem.

    The wider habit is the one I keep coming back to. Every order you place is a promise about what will happen without you. When you know exactly what the platform has promised, you can plan. When you assume it promised something it never did, the market finds the gap for you, usually on a release day, usually at the worst size you have traded all month. Sizing that survives that discovery is the subject of risk management in gold trading, and it is the piece I would read next.

    Frequently asked questions

    What is an OCO order in the simplest possible terms?

    Two orders joined by a rule that says if one executes, cancel the other. The purpose is to guarantee that exactly one of two outcomes happens.

    Does MetaTrader 4 have OCO orders?

    No. MetaTrader 4 has a smaller order set than MetaTrader 5, not a larger one, so if MT5 has no OCO type then MT4 certainly does not. The same workaround and the same double fill risk apply.

    Is a stop loss and take profit really an OCO?

    Functionally yes, and arguably better. Both are exit conditions on one position, so when either fires the position is gone and the other has nothing left to close. There is no cancellation instruction that could arrive too late.

    Can an expert advisor create a real OCO in MetaTrader?

    It can imitate one. A script can watch for one leg filling and then delete the other. That is a monitoring loop, not an exchange level rule, so it depends on your terminal running, your connection holding and the loop reacting faster than the market. It narrows the gap without closing it.

    Where did the figures in this article come from?

    The order type list and the three fill policy descriptions are quoted from the MQL5 order properties documentation, linked above. The cost figures are my own arithmetic from the assumptions stated in the article, being 100 ounces per lot, 0.10 lot per leg, 0.30 dollars per ounce of spread and 3.50 dollars per lot per side of commission. No gold price is used in any of them.

    If both legs fill, should I close both immediately?

    That is a decision about your own plan and your own risk, and it is not something a stranger should hand you as an instruction. What I will say is that holding a long and a short in the same instrument means paying two sets of costs for zero net exposure, and that is a position worth understanding rather than leaving to drift.

    Where Gold Empire fits

    Gold Empire is a free place to learn how gold actually behaves and how accounts actually die, written for people who would rather survive the first two years than have a spectacular first month. Everything on the site is free to read. If you are new here, start here is the guided way in, and it explains who writes this and why. There is a free survival sheet if you want the one page version, and an optional kit for people who want the whole framework in order. Nothing here promises you a return, because nobody honest can.

    About the author

    Matthew has spent a long time around gold, most of it learning things the slow way, and now writes them down so other people can learn them the fast way. He is more interested in the mechanics that quietly drain accounts than in the setups that fill timelines. Nothing in this article is personal advice, and no entry, stop or target discussed should be treated as a signal.


    This article is educational content about how orders and platforms work. It is not investment advice, not a recommendation, and not a solicitation to trade. Trading gold carries a real risk of losing money, including more than you deposit in some account types. Nothing here accounts for your personal circumstances, and no entry, stop or target discussed should be treated as a signal. If you are unsure, speak to someone properly qualified in your own jurisdiction before you risk anything.


  • What Is Spot Gold? Meaning, Settlement, and What You Actually Own

    What Is Spot Gold? Meaning, Settlement, and What You Actually Own

    There is a question that turns up in the Gold Empire group every single week, usually from someone who has already been trading gold for a month or two and has quietly realised they never actually checked. It arrives as a search, what is spot gold meaning, and it is a much better question than it looks. Most people trading XAUUSD have never been told what the word spot refers to, which market it belongs to, or what is physically happening behind the number on their screen. They know the price moves. They do not know what the price is a price of.

    That gap matters more than it sounds, because almost every confusing thing about gold trading comes from it. Why your broker’s quote differs slightly from the one on a news site. Why the futures price is not the same number. Why the phrase owning gold means something very different to a London bank than it does to someone with a coin in a drawer. All of it resolves once you know what spot actually is, so let us do that properly, with the source documents open.

    Chart showing what is spot gold meaning in practice, comparing the size of a London vault bar with a standard retail lot and a 0.01 lot ticket
    What is spot gold meaning in practical terms: the unit the market settles in is far larger than the unit you trade.

    What is spot gold meaning, in one sentence

    Spot gold is the price of gold for immediate delivery, as opposed to delivery on some agreed date in the future. That is the whole definition. The United States regulator puts it in almost exactly those words. The CFTC glossary defines a spot price as “the price at which a physical commodity for immediate delivery is selling at a given time and place.”

    Read that last part again, because it is the part people skip: at a given time and place. A spot price is not a universal constant floating above the world. It is the price in a particular market, with particular rules about how metal changes hands. For gold, that place has a name, and once you know the name, a great deal of the confusion clears up.

    The market the word spot actually points at

    The reference market for spot gold is London, and the trade is known as loco London, meaning the metal is located in London. This is not a small technicality. It is the plumbing that the number on your screen ultimately traces back to. The London Bullion Market Association sets out how that market is built, and it rests on a few things worth knowing.

    Trades between the clearing members are cleared and settled electronically on a net basis, through a body called London Precious Metals Clearing Limited. Storage is not scattered: six LBMA members plus the Bank of England provide the secure vaulting and act as gatekeepers to the market. Only bullion from refiners who meet the LBMA Good Delivery standards can be traded there at all. And the gold, silver, platinum and palladium prices set in London are treated as global benchmarks, which is why they end up feeding, directly or indirectly, into what your platform shows you.

    So when you buy XAUUSD, you are not transacting in some abstract global gold. You are trading an instrument whose price is anchored to a specific, rule bound wholesale market in one city, run by a defined set of institutions.

    Nine thousand tonnes, and why the average bar weighs 12.5 kilos

    Here is where it becomes concrete. The LBMA publishes what is actually sitting in those London vaults. As at the end of July 2026, the published vault data shows 9,534 tonnes of gold held in London, a 0.74 percent increase on the previous month, held in approximately 762,723 bars. There were also 28,213 tonnes of silver.

    Those two numbers, the tonnage and the bar count, let you work something out for yourself, and I would rather show you the arithmetic than ask you to trust me. A tonne is 1,000 kilograms, so 9,534 tonnes is 9,534,000 kilograms. Divide that by 762,723 bars and the average bar in a London vault weighs 12.50 kilograms. A troy ounce is 0.0311034768 kilograms by definition, so 12.50 divided by that is 401.9 troy ounces.

    The market settles, on average, in units of roughly 400 troy ounces. Nobody had to tell us that. It falls straight out of two published aggregates and a calculator. And it is the single most useful fact in this article, because now compare it with what you trade. On a standard retail gold contract, one lot is 100 troy ounces, so the smallest ticket most platforms accept, 0.01 lots, is one troy ounce. The unit the wholesale market physically moves is about four hundred times the size of the smallest unit you can click.

    That is not a criticism of retail trading. It is the reason retail gold trading exists in the form it does. You are not being handed a share of a bar. You are being given a contract whose price tracks a market that deals in bars you could not practically take delivery of anyway.

    Allocated and unallocated, the distinction that actually matters

    Now the part that most articles about spot gold leave out entirely, and the part I would want a new trader to understand before anything else.

    In the London market there are two ways to hold metal. An allocated account means specific, identified bars belong to you. An unallocated account means you have a general entitlement to an amount of metal, without owning any particular bar. The LBMA is direct about which one dominates: most bullion trading and settlement in London uses unallocated accounts, where customers do not own specific bars but have a general entitlement to an amount of metal.

    Sit with that for a second. The reference market for the gold price, the one your XAUUSD quote descends from, runs mostly on claims rather than on bars moving around. Gold at the wholesale level is, for the most part, a book entry backed by metal, transferred between accounts, with physical movement being the exception rather than the rule.

    This is not a scandal and it is not a conspiracy. It is how a market clears enormous volume without forklifts. But it does mean that the word owning is doing a lot of quiet work in gold conversations, and it means very different things at different points in the chain. If you want the retail version of that same question, we went through it in gold CFDs compared with physical gold, which is the closest thing to this article on the site.

    Spot is not futures, and it is not exactly your platform’s price either

    Why the futures number is different

    A futures contract is an agreement to deliver at a specified time in the future, so its price carries the cost of waiting: financing, storage, the time value of holding metal until the delivery month. Spot carries none of that, because spot means now. Two different prices for the same metal, both correct, describing two different questions. If you have ever pulled up a gold chart on one site and a different number on another, this is very often why. We took that comparison apart in the difference between gold and gold futures.

    Why your broker’s quote is not the London price

    Your platform does not show you the London benchmark. It shows you your broker’s own bid and ask, derived from its liquidity providers, with a spread applied. It will track the underlying market closely, and it will not match it to the last decimal, and it should not surprise you when it does not. The practical consequence is that the spread and the swap are real costs you pay for the convenience of trading a wholesale market in one ounce clips, and they deserve the same attention you give the chart. Ours on that is what the spread in gold trading really costs you.

    What this actually changes for you

    You could argue none of this changes a single decision, and I would push back on that. Three things follow from it directly.

    First, you stop treating the gold price as a fact of nature and start treating it as a quote from a specific market with specific mechanics. That alone kills a category of bad reasoning, the kind that leads people to believe a price is wrong rather than that they misunderstood which price they were looking at.

    Second, you get honest about what you are holding. A leveraged contract on spot gold is not a hedge against the world falling apart in the way a bar in a safe might be. It is a trading instrument. Those are both legitimate things to want, and they are not the same thing, and confusing them is how people end up holding a leveraged position through a weekend for reasons they cannot articulate.

    Third, and this is the one that actually keeps accounts alive, understanding that you trade in one ounce increments of a four hundred ounce market should make you more careful about size, not less. The instrument is frictionless. The losses are not. If you have not read it yet, risk management in gold trading is the article on this site I would keep if I could only keep one, and how much to risk per trade is the arithmetic that sits underneath it.

    Free gold survival sheet

    Get the free Gold Empire survival sheet, a one-page guide to protecting your account while you are still learning how this market is put together. One email, no spam, unsubscribe anytime.

    Get the free survival sheet →

    Frequently asked questions

    What is spot gold meaning in the simplest possible terms?

    It is the price of gold for delivery now, rather than on a future date. The regulator’s own wording is the price at which a physical commodity for immediate delivery is selling at a given time and place. Everything else in this article is detail hanging off that sentence.

    Is spot gold the same as XAUUSD?

    Closely related, not identical. XAUUSD on a retail platform is your broker’s quoted price for a contract that tracks spot gold, with the broker’s own spread applied. It follows the underlying market, and it is the broker’s price rather than the London benchmark itself.

    Do I own any actual gold when I trade spot gold?

    On a leveraged retail contract, no. You hold a contract whose value moves with the gold price. It is worth knowing that even at the wholesale level most London trading uses unallocated accounts, where the holder has a general entitlement to metal rather than title to specific bars, so the question of who owns which bar is more layered than most people assume.

    Why is the futures price different from the spot price?

    Because a futures contract delivers later, so its price includes the cost of waiting, mainly financing and storage. Spot excludes that by definition. Two prices, same metal, different questions.

    Does knowing this help me trade better?

    Indirectly, and honestly that is the most I would claim. It will not tell you which way gold goes next, and anyone who says otherwise is selling something. What it does is stop you making decisions based on a wrong mental picture of the instrument, which is a quieter benefit and a real one.

    What Gold Empire actually does

    Gold Empire is a free education channel for people trading gold, and the order is deliberate: survive first, then grow. We publish the mechanics of this market, the ways accounts get destroyed, and the habits that keep people around long enough to get good. The free gold survival sheet is the one page version of that, and it costs nothing.

    Everything here is free to read. There is an optional kit for people who want the material organised into a working system, and following along without ever buying it is a completely normal way to use this channel. We share our own results openly, and signals are part of what the channel offers, but we do not promise profits, because no honest channel can. If you want the next steps in order, start with risk management in gold trading, then how much to risk per trade, and if you are still choosing where to trade, how to pick a broker for gold trading covers what to look for.

    About the author

    Matthew writes the Gold Empire material. He spent his first years in this market learning the expensive way that the size of a position matters more than the direction of it, and most of what he publishes now is the article he wishes had existed then. He reads every message in the group and answers the ones about risk first. You can read more about the Gold Empire approach here.


    This article is educational content, not financial advice. It does not account for your personal circumstances, your tax position, or your risk tolerance, and nothing in it is a recommendation to buy or sell any instrument. Trading leveraged products carries a high risk of losing money rapidly, and no entry, stop or target discussed should be treated as a signal. Consider speaking to a licensed professional in your jurisdiction before making decisions about your money.


  • Gold ETF vs Physical Gold Returns: Where the Difference Actually Comes From

    Gold ETF vs Physical Gold Returns: Where the Difference Actually Comes From

    Every few weeks someone in the Gold Empire group asks a version of the same question, and it is a good question: if I want exposure to gold, should I buy a fund or should I buy the metal? Usually it arrives phrased as a search, gold ETF vs physical gold returns, as though one of the two quietly pays more than the other. It does not. Both hold the same metal. What differs is the toll booth you drive through on the way in, the one you drive through on the way out, and the small fee that is taken from you every year you stay parked. That is the whole story, and once you can see it as an arithmetic problem instead of a loyalty question, the answer for your own situation falls out in about two minutes.

    I want to be careful about the word returns here, because it is the word that gets people into trouble. Nobody, including me, knows what gold will do next year. This article is not about that. It is about the part you can actually control and actually calculate, which is how much of your metal survives the wrapper you chose to hold it in.

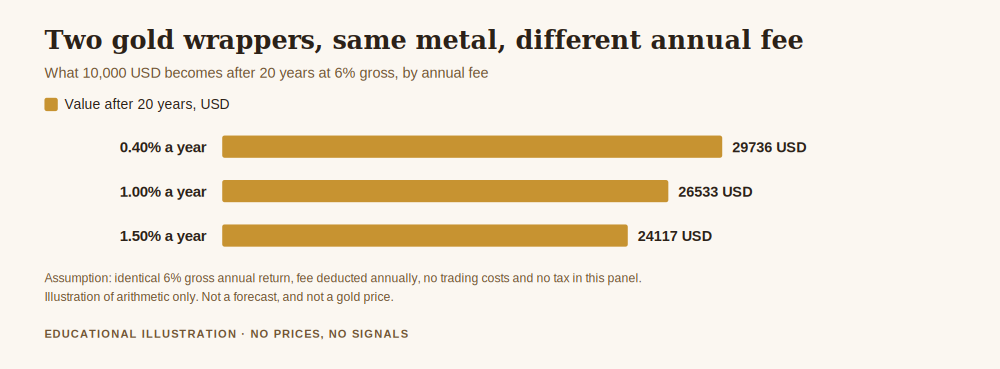
    Chart comparing gold ETF vs physical gold returns as a cost gap over one to twenty years
    Gold ETF vs physical gold returns, seen honestly: a difference in wrapper costs, not a difference in the metal.

    The part nobody actually argues about

    A physically backed gold ETF is a fund that owns bullion sitting in a vault and issues shares against it. The World Gold Council, which tracks this market, describes a data set covering “more than 100 physically-backed gold ETFs and similar products worldwide”, so this is not a niche corner of the market, it is a mature one. When you buy a share, you own a claim on a slice of that bullion. When you buy a coin from a dealer, you own the coin.

    The metal does not know which one you picked. An ounce in a vault in London and an ounce in a safe in your house track the same reference price. If gold rises twenty percent, both rise twenty percent before costs. Anyone who tells you that one wrapper “performs better” than the other in some structural way is either selling you something or has confused a cost difference with a price difference.

    So the honest question is not which one returns more. It is which one leaks less, given how long you plan to hold and how much you are putting in.

    Gold ETF vs physical gold returns: the difference is a cost difference

    Here is the structure, stripped down. An ETF charges an annual expense ratio, which is taken out of the fund’s metal continuously. It is small, it is invisible, and it never stops. Physical gold charges you a spread, which is the gap between what a dealer sells at and what a dealer buys back at. It is large, it is very visible, and you pay it essentially twice in one round trip. Then, if you do not keep the metal at home, you add storage and insurance on top.

    One is a small recurring fee. The other is a large one time fee. That is the entire trade off, and it means the answer depends almost completely on your holding period.

    Let me put numbers on it, and let me be explicit that these are worked assumptions rather than quoted prices, because dealer spreads and fund fees vary a great deal and I am not going to pretend otherwise. Assume a fund charging 0.40 percent a year, and assume a physical round trip that costs you 5 percent all in. Run both forward:

    • After 1 year, the fund has consumed 0.40 percent of your metal. The physical round trip has consumed 5.00 percent.
    • After 5 years, the fund has consumed 1.98 percent. Physical is still at 5.00 percent, because you paid it once.
    • After 10 years, the fund has consumed 3.93 percent. Physical is still at 5.00 percent.
    • After 13 years, the fund has consumed 5.08 percent, and physical, still sitting at 5.00 percent, has quietly become the cheaper wrapper.
    • After 20 years, the fund has consumed 7.70 percent against physical’s 5.00 percent.

    That crossover point is the whole answer, and it moves around depending on your inputs. Cut the dealer spread to 3 percent and the fund loses its advantage after roughly 8 years. Find a fund at 0.25 percent and hold against a 5 percent spread, and the fund stays ahead for about 20 years. Add 0.5 percent a year of vaulting and insurance to the physical side, and physical never catches up at all, because now it is also paying a recurring fee, just a different one.

    None of this requires you to have a view on the gold price. It is arithmetic, and you can redo it with your own numbers in the time it takes to finish a coffee.

    What the fund actually charges you

    The expense ratio is deducted from the fund’s holdings rather than billed to you, which is why most people never feel it. The share count stays the same, but the amount of metal behind each share drifts down a fraction every year. Over a year you will not notice. Over two decades, at 0.40 percent, you have handed over roughly seven and a half percent of your metal without a single line item ever appearing on a statement.

    On top of that sits the brokerage cost of buying and selling the shares, and the bid ask spread on the exchange, which for large funds is usually small but is not zero. If you are the sort of person who buys a little every month, those small trading costs add up faster than the expense ratio does, and it is worth checking whether your broker charges per trade.

    The counterpart benefit is the one people forget to price: you can sell it on a Tuesday afternoon in about four seconds, at a price you can see on a screen, without meeting anyone. Liquidity is a real feature, and in the specific situation where you need money quickly, it is worth considerably more than the fee difference we have been discussing.

    What physical actually charges you

    The spread you pay on the way in and on the way out

    Retail physical gold does not trade at the reference price. It trades at a premium over it when you buy and at a discount under it when you sell, and the width of that gap is the dealer’s business model. Smaller units carry proportionally bigger premiums, because the cost of minting, shipping, and authenticating a one gram bar is not one four hundredth of the cost of doing the same for a large one.

    This is where the wholesale market becomes relevant to a retail decision. The LBMA Good Delivery standard, which defines the bars that clear between banks and vaults, is built around bars of approximately 400 troy ounces. That is the unit the professional market is designed around. Everything smaller than that, which is to say everything a retail buyer would realistically own, is a retail product with a retail markup attached. The further you get from the wholesale unit, the more you pay for the privilege.

    Storage, insurance, and the problem of the lumpy unit

    Keeping metal at home costs nothing in fees and quite a lot in risk, and most household insurance policies have a limit on bullion that is lower than people assume. Vaulted storage solves the risk and reintroduces the annual fee, which puts physical back into the same category as the fund, only usually at a higher rate.

    There is a second, subtler cost. Physical gold does not divide well. If you hold four coins and you need the value of half a coin, you sell a whole coin and pay the spread on the whole coin. A fund holding lets you sell exactly the amount you need. For anyone whose gold is part of an emergency reserve rather than a museum piece, that granularity matters more than a few basis points of annual fee.

    The four questions that settle it

    Rather than argue the general case, answer these four about your own situation and the choice usually makes itself.

    How long is this staying put? Under five years, the recurring fee barely registers and the one time spread dominates, which favours the fund. Over fifteen, the recurring fee compounds against you and the one time spread starts to look cheap, which favours the metal.

    How much are you putting in? Small and regular contributions suit a fund, because you are not paying a fresh retail premium every month. A single large allocation you intend to forget about suits physical, because you pay the spread once on a large unit with a proportionally smaller markup.

    What is it for? If the answer is “so I can sell it quickly if something goes wrong”, a fund does that job better. If the answer is “so I own something that exists outside the financial system”, then a fund does not do that job at all, whatever its fee is, and the fee comparison is beside the point. That is a legitimate reason to accept a higher cost, as long as you know you are accepting it.

    Where do you actually live, tax wise? Fund shares and physical metal are frequently taxed differently, and the size of that difference will usually dwarf the fee difference we have spent this article measuring. I am not qualified to advise you on this and neither is anyone in a forum. It is the one part of this decision genuinely worth paying a professional to answer for your jurisdiction.

    If you are trading gold rather than holding it, this is a different question

    Most people who read Gold Empire are not deciding where to park a decade of savings. They are trading XAUUSD, which is a third thing entirely, and it does not belong in the comparison above. A leveraged position is not ownership. You are not accumulating metal, you have no wrapper cost to compound, and your dominant cost is spread and overnight financing, not an annual expense ratio.

    It also comes with a risk profile that regulators have looked at directly. When ESMA introduced its restrictions on contracts for difference in March 2018, it recorded that “74-89% of retail accounts typically lose money on their investments”, and it capped leverage on gold at 20:1 for retail clients specifically because of that. Read that number next to the ones earlier in this article. We spent several hundred words on whether a wrapper costs you 4 percent or 5 percent over a decade. The trading decision is operating on a completely different scale of risk, and it deserves proportionally more of your attention.

    Which is the actual point I want to leave you with. The fund versus metal question is worth getting right, and it is worth about half an hour. If you are also trading, your position size is worth considerably more than that, because it is the thing that decides whether you are still here in three years. If you have not read our piece on risk management in gold trading, that is the one to read after this one. It is the article on this site I would keep if I could only keep one.

    Free gold survival sheet

    Get the free Gold Empire survival sheet, a one-page guide to protecting your account through the kind of market this article describes. One email, no spam, unsubscribe anytime.

    Get the free survival sheet →

    Frequently asked questions

    Does a gold ETF actually hold real gold?

    A physically backed one does, in allocated form in a vault, and publishes its bar list. There are also synthetic products that track the gold price using derivatives rather than owning metal, and those are a different instrument with different counterparty risk. If this matters to you, and it should, check the fund’s own documentation for the words physically backed and allocated before you buy.

    Which one gives higher returns over ten years?

    Neither, structurally. They hold the same metal, so the gross move is the same and the difference is the wrapper cost. On the worked assumptions in this article, a fund at 0.40 percent a year costs about 3.93 percent over ten years against a 5.00 percent physical round trip, so the fund is slightly ahead at that horizon and behind it by year thirteen. Change the assumptions and the crossover moves.

    Is physical gold safer than a fund?

    It removes the fund and custodian from the chain, which is exactly why some people want it, and it adds theft, storage, and authentication risk, which is exactly why others do not. Safer is not one axis. Decide which of those two risks you would rather be exposed to, because you cannot avoid both.

    Can I convert a gold ETF holding into physical metal?

    For a retail holder, usually not in any practical sense. Redemption in metal is generally reserved for authorised participants dealing in wholesale bar quantities, which is to say the 400 ounce scale described above. If the ability to take delivery is the reason you are buying, buy the metal.

    Does the same comparison apply to trading XAUUSD?

    No, and it is worth being clear about it. Trading a leveraged gold contract is not an ownership decision, and the costs that matter there are spread, swap, and above all position size. See our article on gold CFDs compared with physical gold for that side of it.

    What Gold Empire actually does

    Gold Empire is a free education channel for people trading gold, and the priority order is deliberate: survive first, then grow. We publish the mechanics of the market, the ways accounts get destroyed, and the habits that keep people in the game long enough to get good at it. The free gold survival sheet is the one page summary of that, and it costs nothing.

    Everything on the site is free to read. There is an optional kit for people who want the material organised into a working system, and following along without ever buying it is a completely normal way to use this channel. We share our own results openly, and signals are part of what the channel offers, but we do not promise profits, because no honest channel can. If you want the next steps in order, start with risk management in gold trading, then how much to risk per trade, and if you are still choosing where to trade, how to pick a broker for gold trading covers what to look for.

    About the author

    Matthew writes the Gold Empire material. He spent his first years in this market learning the expensive way that the size of a position matters more than the direction of it, and most of what he publishes now is the article he wishes had existed then. He reads every message in the group and answers the ones about risk first. You can read more about the Gold Empire approach here.


    This article is educational content, not financial advice. It does not account for your personal circumstances, your tax position, or your risk tolerance, and nothing in it is a recommendation to buy or sell any instrument. Trading leveraged products carries a high risk of losing money rapidly, and no entry, stop or target discussed should be treated as a signal. Consider speaking to a licensed professional in your jurisdiction before making decisions about your money.


  • Gold CFD vs Physical Gold: What One Bad Day Does to Each

    Gold CFD vs Physical Gold: What One Bad Day Does to Each

    Gold CFD vs physical gold is usually presented as a matter of taste, as though one suits traders and the other suits savers and there is nothing more to say. That framing hides the only difference that has ever emptied an account. A physical holder and a CFD holder can watch the identical percentage move on the identical chart and walk away with completely different outcomes, because one of them posted the full value and the other posted a fraction of it.

    So rather than write another feature table, I measured it. I took the published afternoon gold benchmark over the last ten and a half years, asked what each holder experiences on the same day, then worked out what it costs each of them to simply keep holding. Two numbers came out of that which I had not expected to be quite so blunt, and I have put both below with the arithmetic attached.

    What Gold CFD vs Physical Gold Actually Means

    Strip the marketing away and there are three differences that matter, in order of how much damage they do.

    The first is what you posted. Buy metal and you pay the whole value. Your position cannot be closed by anyone but you, because there is nothing to call in. Buy a contract for difference and you post margin, a fraction of the value, and you have agreed that if the market moves against that fraction far enough, the position is closed for you whether or not you still believe in it.

    The second is rent. Metal is bought once. A CFD long is a financed position, which is a polite way of saying the full value is borrowed and charged for every day you hold it. The charge is small measured against the value of the contract and very large measured against the money you actually put up, and that gap is where most of the confusion lives.

    The third is what you own. A CFD is a contract with a firm. Metal in your possession is metal in your possession. This is the difference everyone writes about and, on any ordinary week, the least likely of the three to affect you.

    Everything else, the ticket size, the platform, the ability to go short, follows from those three. The first two can be measured, so that is what the rest of this article does.

    The First Difference: What One Bad Day Does to Each Holder

    The arithmetic here is not complicated, it is just rarely written down. A loss shows up on your statement as a percentage of the money you put up, not as a percentage of the contract. At 1:1, which is what a physical holder is whether they use the word or not, a 5 percent fall is a 5 percent loss. At 1:20 the same fall is a 100 percent loss, because you posted a twentieth of the value.

    Put the other way round, here is the adverse move that takes the whole of your margin, by leverage:

    • 1:5 needs a 20.000 percent move
    • 1:10 needs a 10.000 percent move
    • 1:20 needs a 5.000 percent move
    • 1:50 needs a 2.000 percent move
    • 1:100 needs a 1.000 percent move
    • 1:500 needs a 0.200 percent move

    Those are ceilings, and generous ones. I have ignored margin close out rules, which act earlier, and I have ignored the cost of the spread. Reality arrives sooner than this list says.

    Now the question that makes the list mean something. How often has gold actually delivered moves of that size? I measured every session of the LBMA gold benchmark, afternoon fix, from 4 January 2016 to 14 August 2026. That is 2,663 published sessions and 2,662 steps between them.

    The median absolute daily move is 0.4998 percent. Half of all days are smaller than that. It is a quiet market most of the time, and that is precisely the problem, because quiet markets are what convince people that high leverage is survivable.

    Counting only the falls:

    • a fall of 1 percent or more in one session happened 281 times, 10.556 percent of sessions
    • a fall of 2 percent or more happened 79 times, 2.968 percent of sessions
    • a fall of 3.33 percent or more happened 11 times, 0.413 percent of sessions
    • a fall of 5 percent or more happened 6 times, 0.225 percent of sessions
    • a fall of 7.5 percent or more happened once, 0.038 percent of sessions
    Gold cfd vs physical gold compared by the adverse move that wipes posted margin at each leverage, against how often gold actually fell that far
    Gold CFD vs physical gold, measured: the move that takes your whole margin, beside how often the market has actually delivered it.

    The Session That Settles the Argument

    The worst single session in the sample was a fall of 7.83 percent, on 30 January 2026. I want to sit on that number for a moment, because of what it does to the list above.

    A 7.83 percent adverse move takes the entire posted margin of anyone at 1:20 or higher. Not most of it. All of it, with room to spare, in one session, without a gap, on a benchmark that publishes once a day.

    Here is the part I find genuinely striking. Under the European regulator’s retail rules, the maximum leverage a retail client may be offered on gold is 20:1. That cap exists to protect people. And 20:1 is exactly the leverage that one real session in this sample would have wiped out completely. The legal maximum and the demonstrated danger line are the same number. Anyone trading gold above that cap, in a jurisdiction that permits it, is not taking a slightly larger version of the same risk.

    The physical holder’s experience of 30 January 2026 was different in kind, not degree. Their holding was worth 7.83 percent less that evening. Nothing was closed, nothing was called, and the decision about what to do next remained theirs. That is the whole of the first difference, in one day.

    Stretch the window and it gets starker. The deepest peak to trough fall on closing prices in the sample was 26.11 percent, from 29 January 2026 down to 16 July 2026. To still hold a leveraged position through that entire fall, without adding margin, you would have needed leverage below 1:3.83. Below four to one. The same regulator’s cap of 20:1 is five times too generous to survive the drawdown this market actually produced, and most retail gold trading happens well above the cap.

    The physical holder rode it and, on the published benchmark, watched the level recover afterwards. The point is not that holding metal is clever. The point is that a drawdown and a liquidation are different events, and leverage is the thing that converts one into the other.

    The Second Difference: What It Costs to Simply Keep Holding

    This is the part that gets left out, and for a certain kind of position it does more damage than volatility ever does.

    A long CFD is financed. The firm has effectively lent you the full contract value, and it charges for that every day, normally at a benchmark rate plus a markup. To put a real benchmark on it rather than an invented one, I used the Federal Reserve H.15 series, three month Treasury constant maturity, averaged over the 2,585 days of my sample that have a published value. That average is 2.34 percent per year.

    Charged on the contract value, 2.34 percent sounds like nothing. Now express it as a share of the money you actually posted, which is the number that matters to you, at a benchmark plus 3 percent markup:

    • at 1:1, carry costs 5.34 percent of your money per year
    • at 1:5, 26.68 percent
    • at 1:10, 53.35 percent
    • at 1:20, 106.70 percent
    • at 1:50, 266.76 percent

    Read the 1:20 line again. At the European retail cap, at that financing rate, the carry alone consumes slightly more than your entire posted margin over a year. The market does not need to move at all. A position held open for twelve months at that leverage costs you more than you put up, purely in rent, and every percent the market gives you is being handed straight back before you see it.

    This is why the honest answer to “should I hold a gold CFD for the long term” is not a matter of opinion. The instrument is built for short holding periods and it prices itself accordingly.

    Where the CFD Is Genuinely the Cheaper Tool

    I am not making the case for metal here, and it would be a poor article that only argued one way. Physical gold has a cost too, and it is front loaded: you pay a dealer’s buying spread going in and a selling spread coming out, plus storage or insurance if you are not keeping it somewhere unwise.

    So there is a crossover, and it is calculable. Take a one off physical round trip cost, compare it to financing charged continuously on the same contract value, and ask how long the CFD takes to overtake it. At a benchmark plus 3 percent, which is 5.34 percent per year on my sample average:

    • a 1 percent physical round trip is overtaken after about 68 days
    • a 2 percent round trip after about 137 days
    • a 3 percent round trip after about 205 days
    • a 5 percent round trip after about 342 days
    • an 8 percent round trip after about 548 days

    You will have to put your own dealer’s numbers into that, because round trip costs vary enormously by product and by country and I am not going to invent a universal figure. But the shape of the answer holds: for a position measured in days or a few weeks, the CFD is usually the cheaper way to take the exposure. For a position measured in years, it is not close, and the gap widens every single day the position stays open.

    Note also that leverage does not appear in that crossover calculation at all. Both costs are measured against the same contract value. Leverage changes what the carry costs you relative to your margin, and it changes what a bad day does to you, but it does not change the date on which financing overtakes a one off cost.

    What This Does Not Say

    Several things, and they matter enough to list.

    It does not say physical gold is safe. A 26.11 percent peak to trough fall is a real loss to a physical holder too, just an unforced one. It does not say the sample predicts anything. Ten and a half years of a public benchmark is history, not a forecast, and the next worst session is not obliged to resemble the last one. It does not say CFDs are a scam, they are a tool with a stated cost that most users never convert into the units that would make the cost legible. And it does not say anything at all about which you should hold, because that depends on why you want the exposure and for how long, which I do not know.

    What it does say is that the phrase “gold CFD vs physical gold” describes two positions with different failure modes. One can lose value. The other can lose value and be closed while it does. Those are not the same risk wearing different clothes.

    Free gold survival sheet

    Get the free Gold Empire survival sheet, a one page guide to sizing a leveraged gold position so that an ordinary bad session stays an ordinary bad session. One email, no spam, unsubscribe anytime.

    Get the free survival sheet →

    Frequently Asked Questions

    Is a gold CFD the same as owning gold?

    No. It is a contract with a firm whose value tracks the gold price. You have exposure to the price without title to any metal, which is fine as long as you know that is what you bought and you have considered what happens if the firm fails.

    Which is better for a beginner, gold CFD vs physical gold?

    I would not frame it as better. They answer different questions. Metal answers “I want exposure and I will hold it”. A CFD answers “I want exposure for a short period and I am willing to post margin and pay rent for it”. The failure mode of the second is faster and less forgiving, which is worth knowing before rather than after.

    Can I lose more than I put in with a gold CFD?

    In jurisdictions with negative balance protection for retail clients, no, your loss is capped at the account. Elsewhere, or as a professional client, it is possible. Check which category you are in before it matters rather than during the session where it does.

    Does the financing cost apply if I close the position the same day?

    Normally financing is charged on positions held over the daily rollover, so a position opened and closed inside the day usually avoids it. That is exactly the usage pattern the instrument is designed around, and it is why the carry arithmetic above bites hardest on positions held for months.

    Why measure everything in percentages instead of prices?

    Because a percentage move does the same thing to any account size, and because quoting a gold price in an article that will be read for years is a good way to mislead somebody. The arithmetic here works identically whatever the level happens to be.

    Where did the 7.83 percent figure come from?

    I computed it myself from the published LBMA afternoon benchmark across 2,663 sessions between 4 January 2016 and 14 August 2026. It is the largest single session fall in that window, dated 30 January 2026. The full list of assumptions is in the disclaimer below.

    Where Gold Empire Fits

    Gold Empire is a free Telegram channel where I post gold analysis with the reasoning written down before the move rather than after it, losing days included. Nothing has to be bought to follow along, and there is an optional Kit later for people who want more structure. I make no profit claims and I do not rank brokers for payment.

    The free survival sheet is the one page version of the sizing discipline that decides whether a 5 percent session is an inconvenience or an ending. If this piece was useful, what is leverage in gold trading takes the mechanism apart properly, the difference between gold and gold futures covers the third way of taking this exposure, and risk management for gold trading is where the sizing arithmetic lives.

    About the author. Matthew writes Gold Empire. He is interested in the unglamorous half of this business, cost, size, frequency and the arithmetic of staying solvent, on the view that most accounts are lost to ordinary errors repeated patiently rather than to any single dramatic trade.

    Disclaimer: This article is general educational content comparing two ways of taking exposure to the gold price. It is not financial advice, not a recommendation of any instrument, broker or product, and not a suggestion to open any particular position. Trading leveraged products carries a high risk of losing money rapidly. No entry, stop or target discussed should be treated as a signal. The price figures were computed by me from the published LBMA gold benchmark, afternoon fix, over the 2,663 published sessions from 4 January 2016 to 14 August 2026, using closing benchmark values only, with no intraday data, no dealing costs and no bid to offer spread. The financing figures use the Federal Reserve H.15 three month constant maturity yield averaged over the 2,585 sample days with a published value, plus a stated markup, charged on full contract value; the markup is an assumption for illustration and not a quote from any firm. Margin wipeout figures ignore margin close out rules that would act earlier, so they are the generous case. The leverage cap and retail client rules referenced are from ESMA and apply to retail clients in the European Union; your jurisdiction may differ. No gold price level is quoted anywhere in this article and no trading results are represented. Past behaviour of a public benchmark is not a prediction.


  • The Difference Between Gold and Gold Futures, and What It Costs You to Wait

    The Difference Between Gold and Gold Futures, and What It Costs You to Wait

    The difference between gold and gold futures is not really a difference in what you own. Both give you exposure to the same metal, priced off the same global benchmark, moving on the same news. The difference is a deadline and a bill. One of these positions has an expiry date printed on it and the other one does not, and one of them charges you for time in a way you can see while the other buries the same charge inside the price you paid. Traders who lose money on the distinction almost never lose it because they picked the wrong instrument. They lose it because nobody told them time was on the invoice at all.

    This matters more than the usual comparison articles suggest, because the two products fail in different ways. A futures position can be perfectly correct about direction and still end because the contract ran out. A spot position can be perfectly correct about direction and still bleed out because it was held long enough for the financing to matter. Neither of those is a trading mistake in the ordinary sense. Both are structural, both are knowable in advance, and both are avoidable with about ten minutes of arithmetic.

    What Each One Actually Is

    Strip the marketing away and there are only a few moving parts.

    Gold futures

    A gold futures contract is a standardised agreement, traded on an exchange, to exchange a fixed quantity of gold at a fixed date in the future. Three features follow from that sentence and they are the whole story. It is standardised, so the quantity and the delivery terms are not negotiable and not chosen by your broker. It is exchange traded, so the counterparty risk sits with a clearing house rather than with the firm you opened an account with. And it expires, so the position has an end date that exists whether or not your idea has run its course.

    The price you buy at is not the spot price. It is the spot price plus the cost of carrying gold to the delivery date, which is mostly interest, plus storage and insurance. That premium is not a fee anyone charges you. It is arithmetic, and it is already inside the number on the screen.

    Spot gold, and the retail CFD built on it

    Spot gold has no expiry. The retail product most people actually trade, a contract for difference on gold, is built to mirror spot and to roll indefinitely. You are not going to take delivery of anything. Your counterparty is the broker, not a clearing house, which is a genuine difference in who has to stay solvent for your position to be worth what your screen says.

    Because there is no delivery date, there is no carry baked into the entry price. So the carry is charged separately, every day you hold, as a financing debit or credit. Different firms call it swap, rollover or overnight financing. It is the same economic thing that the futures premium represents, presented as a daily line item rather than as part of the purchase price.

    That is the entire structural difference. One product charges you for time up front and hands you a deadline. The other charges you for time daily and hands you no deadline at all, which sounds like the better deal and is the reason people hold losing positions for months.

    The Difference Between Gold and Gold Futures Shows Up in the Carry

    Since the carry is the part nobody quotes, it is worth pricing rather than describing.

    The dominant component is the risk free interest rate, because holding metal means having capital tied up in metal instead of earning interest. Take that rate from the source rather than from memory. The Federal Reserve’s H.15 release of selected interest rates puts the three month US Treasury constant maturity yield at 3.90% per year on its 6 August 2026 observation. That is a published number, updated continuously, and free.

    From there the arithmetic is short. A three month carry at that rate is 3.90% multiplied by a quarter of a year, which is 0.9750% of the position’s value. Spread across calendar days, the same figure is 0.01068% per day. Over a full year it is simply 3.90%.

    Two things need saying plainly about that number. First, it is a floor and not a full cost, because real forward pricing also reflects storage, insurance and lending terms in the metal itself, and the retail version adds a broker markup on top that varies by firm and is nothing to do with the Federal Reserve. Second, it applies to the whole notional value of the position, not to the margin you deposited. A trader with a small deposit controlling a large position pays the carry on the large number. That asymmetry is where the surprise usually lives.

    Difference between gold and gold futures, chart comparing the cost of carry against how often gold cleared it over 90 and 365 day windows
    The difference between gold and gold futures priced as carry, against how often the LBMA gold benchmark actually cleared that carry between 2016 and 2025.

    How Often the Carry Actually Costs You the Trade

    A cost only matters relative to what you are trying to earn, so I measured it against what gold actually did.

    The test uses the published LBMA gold benchmark across the ten calendar years from 2016 to 2025, which is 2,506 daily fixings. For every fixing I looked forward ninety calendar days and asked a single question: did gold rise by more than the 0.9750% carry over that window? That gives 2,445 complete windows.

    Gold cleared the carry in 1,516 of them, which is 62.00%. The median ninety day move was a gain of 3.287%, comfortably above the cost. So far the instrument looks cheap.

    Now read the other side of the same sentence. In 38.00% of ninety day windows, the financing consumed the entire move and more. Nearly two windows in five. Stretch the horizon to a full year and the picture barely improves: across 2,255 rolling 365 day windows, gold beat the 3.90% annual carry 61.73% of the time, with a median twelve month gain of 8.666%.

    The honest reading of those figures is not that carry is trivial because gold usually beats it. It is that gold beats it about six times in ten, in the strongest decade the metal has had in a generation. A directional view that is right slightly more often than a coin toss is not a strong enough view to fund a permanent daily charge, and a flat decade would turn every one of those percentages against you. This is also why the same holding cost that is a rounding error on a two day trade is a structural drag on a two year one.

    Expiry Is a Deadline Your Idea Does Not Have

    The futures side has a different problem, and it is the one that catches people who came from equities.

    Contracts expire on a schedule set by the exchange, not by you. If your view needs another two months and the contract has three weeks left, you do not get to simply wait. You either close, take the contract into its delivery period, or roll into the next month by closing one contract and opening another.

    Rolling is the normal choice and it is not free. Each roll pays the spread twice, once to exit and once to enter, and it re establishes the position at the next contract’s price, which contains its own fresh carry to its own later date. Roll four times a year and you have paid four sets of transaction costs and purchased the carry four times over. Nothing about that is hidden or unfair. It is simply a cost that a spot position presents to you as a small daily debit and a futures position presents as an occasional large one, and traders reliably underestimate the version that arrives in lumps.

    The mirror image is worth stating too, because the spot product’s lack of a deadline is not purely a benefit. A position with no expiry is a position with no forced review. Futures impose a decision on a known date. Spot lets an unexamined trade sit for a year while the financing quietly accumulates, and there is no moment at which the market makes you look at it.

    Where Leverage Turns a Cost Into a Failure

    Both products are usually sold with leverage, and leverage does something specific to everything above: it leaves the carry attached to the full position while shrinking the capital that has to absorb it.

    The arithmetic needs no prices at all. At 10:1, a 1.00% adverse move takes 10% of the margin you posted, and it takes a 10.00% adverse move to erase that margin entirely. At 20:1, the same 1.00% move takes 20%, and 5.00% wipes you out. At 50:1, one percent costs half your margin and 2.00% ends the position. At 100:1, a single 1.00% move against you is the whole of it.

    Set that beside the carry figures. On a highly leveraged position the annual financing can exceed the deposit itself, which means a trader can be right about gold, hold patiently, and still be closed out by the accumulated cost of patience. Regulators have been blunt about the general outcome here, and the CFTC’s investor education material on leveraged retail products is worth the ten minutes it takes to read. For the version of this arithmetic applied to position size rather than instrument choice, what is leverage in gold trading works through it in more detail, and what is swap in gold trading covers the daily financing line specifically.

    What This Comparison Is Not

    Two misreadings are worth closing off.

    This is not an argument that futures are better than spot, or the reverse. They are different shapes of the same exposure, and the right one depends on your holding period, your capital, your jurisdiction and what you are actually allowed to trade. A trader holding for two days is barely touched by carry and should care about spread. A trader holding for two quarters should care about carry more than almost anything else. The instrument follows the horizon, not the other way round.

    It is also not a claim about what any particular broker will charge you. The carry figure above is built from a published government interest rate, and it describes the economic floor beneath both products. What you actually pay is that floor plus a markup set by a private firm and written in your contract specification. Only the floor is something I can show you honestly. The markup is something you have to read for yourself, and the fact that it is rarely displayed next to the leverage figure in any advertisement is itself informative.

    Four Questions Before You Choose

    None of this requires new software. It requires four answers.

    How long do you intend to hold? Days, and carry is noise. Months, and carry is a main cost that belongs in the plan before entry, not in a surprise on the statement.

    Do you know your financing rate? Not the leverage, not the spread, the actual overnight rate on the product you are trading, in your account, for a long position. If you cannot find it in under five minutes, that is the answer to a different and more important question.

    What ends the position if you do nothing? For futures it is an expiry date you can look up today. For spot it is a margin level you can calculate today. Both are knowable now and neither should be discovered later.

    Who is your counterparty? A clearing house and a retail broker are not the same promise. This does not make one product safe and the other dangerous. It makes them different risks, and knowing which one you hold is part of knowing what you own.

    Free gold survival sheet

    Get the free Gold Empire survival sheet, a one page guide to knowing what a position costs you to hold before you open it rather than after. One email, no spam, unsubscribe anytime.

    Get the free survival sheet →

    Frequently asked questions

    In one line, what is the difference between gold and gold futures?

    Gold futures are a dated exchange traded contract whose price already contains the cost of carrying metal to a fixed expiry, while spot gold and the retail products built on it never expire and charge that same carry as a daily financing line instead. Same exposure, different deadline, different place on the invoice.

    Which one is cheaper to hold?

    Neither is inherently cheaper, because both are paying for the same thing. Futures bundle the carry into the entry price and add transaction costs each time you roll. Spot spreads it across daily debits with a broker markup on top. Over a short horizon the roll costs dominate and spot often works out cheaper; over a long horizon the daily markup compounds and futures often do. The horizon decides it, not the label.

    Where does the 3.90% carry figure come from?

    From the Federal Reserve’s H.15 selected interest rates release, three month US Treasury constant maturity yield, observation dated 6 August 2026. The link is above. A three month carry is that rate times 0.25, which is 0.9750% of position value, or 0.01068% per calendar day. It is a floor, since storage, lending terms and any broker markup sit on top of it.

    How were the 62.00% and 61.73% figures calculated?

    From the LBMA gold benchmark, 2,506 daily fixings across 2016 to 2025. For every fixing I measured the move ninety calendar days later, giving 2,445 windows, and counted those exceeding the 0.9750% quarterly carry: 1,516, or 62.00%. The same method over 365 days gives 2,255 windows and 1,392 clearing the 3.90% annual carry, which is 61.73%. The source is linked so you can rebuild it.

    Does the carry disappear if I am short?

    Usually the sign flips rather than the cost vanishing, so a short position can receive financing instead of paying it. Do not treat that as free income. The rate you receive is generally worse than the rate you pay on the same product, the difference is the firm’s margin, and a position held for the financing rather than for the view is a position with no exit criteria.

    Do gold ETFs solve this?

    They move the cost rather than removing it. A physically backed fund charges an annual management fee that covers storage and administration, which is the same carry appearing under a third name. What changes is the leverage: a fund bought with cash cannot produce a margin call, which is a meaningful difference in failure mode rather than in cost.

    I only hold for a day or two. Can I ignore all of this?

    Largely yes, on cost. At 0.01068% per day the financing floor on a two day hold is negligible next to the spread. What you cannot ignore is the expiry question if you are in futures, and the counterparty question in either. Those do not scale with holding time.

    Where This Leaves You

    The choice between these two products is usually presented as a question about sophistication, as though futures were the grown up version and spot the beginner’s. That framing is not useful and it is not true. The real question is much narrower: how long do you intend to hold, and have you priced what holding costs?

    Answer that and the instrument mostly picks itself. Fail to answer it and you will discover the answer anyway, in the form of a financing line you did not budget for or an expiry you did not diarise. The market is indifferent to which. Both endings look identical on a statement, and both are entirely preventable with a number you can look up in a minute and a date you can write down today.

    Where Gold Empire Fits

    Gold Empire is a free Telegram channel where I post gold analysis with the reasoning stated before the move rather than after it, losing days included. There is nothing to buy in order to follow along, and an optional Kit if you want more structure later. I publish no profit claims and I do not rank brokers for payment.

    The free survival sheet is the one page version of the cost discipline described here. If you want the neighbouring mechanics, risk management in gold trading is the piece everything else hangs off, and what is the spread in gold trading covers the cost you pay on the way in rather than the one you pay for waiting.

    About the author. Matthew writes Gold Empire. He is interested in the unglamorous half of this business, cost, size, frequency and the arithmetic of staying solvent, on the view that most accounts are lost to ordinary errors repeated patiently rather than to any single dramatic trade.

    Disclaimer: This article is general educational content about how two instrument structures differ. It is not financial advice, not a recommendation of any broker, product, instrument or method, and not a suggestion to open any particular position. Trading gold, futures, CFDs and leveraged products carries a high risk of losing money rapidly. No entry, stop or target discussed should be treated as a signal. The 3.90% financing rate is the published three month US Treasury constant maturity yield from the Federal Reserve H.15 release dated 6 August 2026, used as a transparent floor for the cost of carry; it is not a quote for any broker’s financing charge, which is set privately and will be higher. The 2.00 percentage point markup mentioned in relation to retail pricing is an illustrative assumption, not a rate offered by anyone. All frequency figures are computed from the published LBMA daily gold benchmark over 2016 to 2025, describe the behaviour of that public benchmark rather than any account, and the sources are linked so you can verify them. Past behaviour of a benchmark is not a prediction. No gold price is quoted anywhere in this article and no real trading results are represented.


  • Buy Stop and Buy Limit Explained: What Each One Costs You in a Fast Market

    Buy Stop and Buy Limit Explained: What Each One Costs You in a Fast Market

    Here is buy stop and buy limit explained the way I wish someone had explained it to me, which is not with two definitions and a diagram, but with the question that actually matters: what does each one do to you when the market is moving fast and you are not watching. The definitions take a paragraph. The consequences take a decade to learn by accident, and they are the reason two traders with the same view of gold can end a week with completely different results.

    Both orders exist to get you into a position at a price you have chosen in advance rather than a price you panic into. That is where the similarity ends. One of them buys strength above the market. The other buys weakness below it. From the same idea, on the same chart, they produce different entries, different fill rates, and different failure modes.

    What Each Order Actually Instructs Your Broker to Do

    Strip away the jargon and each order is a sentence you are handing to a machine.

    The buy stop

    A buy stop sits above the current market. It says: if price reaches this level, buy me in at the market. The word stop is doing something specific here. It does not mean protection. It means the order does nothing until price touches the trigger, and once it does, the order converts into a market order and takes whatever is available.

    People use it to buy a breakout, or to enter only if the move confirms itself. The logic is reasonable. You are refusing to buy until the market proves something.

    The buy limit

    A buy limit sits below the current market. It says: if price falls to this level, buy me in, and do not pay more than this. The word limit is also doing something specific. It caps your price. The order will fill at your level or better, never worse, and if the market never comes down to you it simply does not fill at all.

    People use it to buy a pullback, or to enter only at a price they consider good value. That logic is also reasonable. You are refusing to chase.

    So far this is a textbook. The textbook is where most explanations stop, and it is exactly where the useful part begins.

    Buy Stop and Buy Limit Explained by the Data, Not the Definition

    I wanted to know how differently these two orders behave in practice on gold, so I measured it rather than argued about it.

    The test uses the published LBMA gold benchmark over the ten years from 2016 to 2025, which is 2,506 fixings. On each day I imagined placing both orders at the same distance from that day’s fixing, a buy stop 0.5% above and a buy limit 0.5% below, and then looked forward five fixings to see which levels the market actually reached. That gives 2,501 cases.

    Two assumptions need stating plainly, because they shape the answer. First, the only price I can observe is the daily fixing, so an order counts as reached only when a later fixing prints at or beyond its level. Real intraday touches are invisible to this test, which means every figure below understates how often both orders would have triggered. Second, 0.5% is roughly one median daily move, since the median absolute change between fixings across this period was 0.48%. It is a normal distance, not a stretch.

    Buy stop and buy limit explained, chart of how often each order level was reached within five LBMA gold fixings
    Buy stop and buy limit explained through fill rates on the LBMA gold benchmark, 2016 to 2025.

    The buy stop above the market was reached in 62.06% of cases. The buy limit below the market was reached in 52.66%. Both levels were reached in 17.83% of cases, and neither was reached in only 3.12%.

    Read those last two lines again, because they carry the whole article.

    In nearly one case in five, the market went and touched both of them inside a working week. The same idea, expressed with two different order types, would have put you in the market twice at prices a full one percent apart, in opposite directions from where you started. Neither order was wrong. They were answering different questions.

    And in only 3.12% of cases did the market sit still enough to leave both untouched. Placing a resting order on gold and assuming nothing will happen is not a neutral act. Something happens almost every time.

    The Part of a Buy Stop Nobody Prices In

    A buy stop converts to a market order when triggered. That sentence contains a cost, and it is worth measuring rather than accepting on faith.

    In the same test, when the buy stop was reached, I recorded how far beyond the trigger the first observable price actually printed. The median was 0.47% past the trigger. The 90th percentile was 1.39% past it. The worst case in ten years was 4.74% past it.

    Put that in proportion. You placed the order 0.5% away from the market. On a typical fill, the first price you could actually see was another 0.47% beyond your own trigger, which is very nearly the same distance again. In 46.71% of filled cases, the first observable print was at least 0.5% past the trigger.

    Now, the honest caveat, because this figure is easy to abuse. A daily fixing series is a coarse instrument. In a liquid market with an intraday feed, most buy stops fill far closer to the trigger than these figures suggest, and the number above is not a slippage estimate for your broker. What the figure genuinely establishes is the shape of the risk: the market that triggers a buy stop is, by construction, a market that was already moving in that direction, and the distance it travels once it starts is not something your order controls. Your trigger sets where the decision fires. It does not set where you get filled.

    That distinction is the entire practical difference between the two orders, and it is why sizing has to be done from the fill, not from the trigger. If you size a position on the assumption of entering at your trigger, and the market hands you an entry meaningfully beyond it, your stop distance has shrunk and your real risk per trade has grown, silently, at the exact moment the market was most active. This is the same arithmetic problem that risk management in gold trading deals with from the other end.

    The Part of a Buy Limit Nobody Prices In

    The buy limit has the opposite profile, and it is not the safer order. It is a differently dangerous one.

    Its price is guaranteed. You will not pay more than your level. What is not guaranteed is anything else. In the test above the limit went unreached in 47.34% of cases, and an unfilled order is not a neutral outcome. It is a trade you decided to take and then did not take, which means your record no longer reflects your thinking, and the trades that got away are exactly the ones you will misremember later.

    There is a subtler problem underneath. Consider what has to happen for a buy limit to fill. The market has to come down to you. Sometimes that is an ordinary pullback in a market that then continues. Sometimes it is the first leg of a move that is not going to stop where you hoped. Your limit order cannot tell the difference, and it fills identically in both cases. The buy limit gets its best price precisely when the market is going against the idea, which is a real cost that never shows up as slippage on any statement.

    So the choice is not between a risky order and a safe one. It is between an order that guarantees participation while surrendering control of price, and an order that guarantees price while surrendering control of participation. There is no third option that guarantees both, and any explanation suggesting otherwise is selling something.

    Why Scheduled Events Change the Answer

    Resting orders behave differently around known events, and gold has an unusually predictable calendar of them.

    The Federal Open Market Committee publishes its meeting dates a year in advance. According to the Federal Reserve’s own calendar, there are eight scheduled FOMC meetings in 2026, of which three remain at the time of writing: 15 to 16 September, 27 to 28 October, and 8 to 9 December. Those dates are not a forecast. They are published fact, and they are free.

    The reason this matters for order types is mechanical rather than mystical. A resting buy stop left across a scheduled announcement is an instruction to buy into whatever the release produces, at whatever price exists a moment later, with no human in the loop. A resting buy limit across the same event is an instruction to buy if the market falls to your level, including in the case where the release is the reason it fell. Both of those may be exactly what you intend. The failure is intending neither and finding out afterwards which one you left switched on.

    The cheapest habit in this whole article is checking the calendar before leaving an order unattended. It costs one minute. For the wider point about leverage and how quickly a fast market compounds a sizing error, the CFTC’s advisory on retail foreign currency trading is worth ten minutes of anyone’s time, particularly the section on how quickly leveraged positions move against small accounts.

    What This Argument Is Not

    I want to close off the two ways this gets misread.

    It is not an argument that buy limits are better than buy stops, or the reverse. The data above says they are different, not that one wins. A trader whose method depends on confirmation needs the stop and should accept the fill risk that comes with it. A trader whose method depends on price levels needs the limit and should accept the participation risk that comes with it. Choosing the order type that does not match the method is where the damage happens.

    It is also not a claim about your broker’s execution. Everything above is computed from a public daily benchmark, not from any account, and your fills are a matter for your own statement and your own contract specification. What I have measured is what the underlying market did. What you receive is that, plus your broker’s execution, plus your own timing, and only the first of those three is something I can show you honestly.

    Four Things to Check Before You Place Either One

    None of this requires new software. It requires four answers you can find today.

    Which question you are answering. Are you refusing to buy until the market confirms, or refusing to buy above a price you consider fair? Those are different questions with different correct orders, and most order type mistakes are actually unanswered question mistakes.

    Where your risk is measured from. If you size from the trigger rather than the fill, a fast market quietly increases your risk per trade. Size from a realistic fill, or check your position after it opens rather than assuming.

    What happens if it does not fill. Write down in advance what you do when a buy limit is left behind by the market. Deciding this in the moment is how a missed trade becomes a chased one, which is covered in missed entries are not losses.

    What is on the calendar. Before leaving anything resting overnight or over a weekend, check whether a scheduled release sits inside that window. If one does, that is a decision to make deliberately, not a detail to discover later.

    Free gold survival sheet

    Get the free Gold Empire survival sheet, a one page guide to sizing a gold position from the fill you actually receive rather than the price you hoped for. One email, no spam, unsubscribe anytime.

    Get the free survival sheet →

    Frequently asked questions

    In one line, what is the difference between a buy stop and a buy limit?

    A buy stop sits above the market and buys strength at whatever price is available once triggered. A buy limit sits below the market and buys weakness at your price or better, or not at all. The buy stop trades price certainty for participation certainty. The buy limit does the reverse.

    Which one is safer?

    Neither, and the question hides the real trade off. The buy stop can fill worse than you planned, which is a price risk. The buy limit can fail to fill, or fill precisely because the market is heading lower, which is a participation risk and a selection risk. Safety comes from matching the order to your method and from sizing correctly, not from the order type itself.

    Where do the fill rate figures come from?

    From the LBMA gold benchmark over 2016 to 2025, 2,506 fixings, giving 2,501 test cases. On each day both orders were placed 0.5% from that day’s fixing and the next five fixings were checked. The buy stop level was reached in 62.06% of cases, the buy limit in 52.66%, both in 17.83%, neither in 3.12%. The source is linked above so you can rebuild it yourself.

    Why does the article say the figures understate reality?

    Because a daily benchmark shows one price per day. A level touched intraday and left behind before the fixing is invisible to the test. Every fill rate above is therefore a floor, not a ceiling, and the real proportion of orders triggered would be higher on any intraday feed.

    Does a buy stop guarantee I get in at my trigger price?

    No, and this is the most common misunderstanding of the order. The trigger price is where the order activates. The fill price is whatever the market offers at that moment, which in a fast market can be meaningfully different. If your risk calculation assumes the two are the same, your actual risk per trade is larger than you think.

    What about a buy stop limit, which combines the two?

    It triggers like a stop and then fills like a limit, so it will not pay worse than your cap. That solves the price problem by reintroducing the participation problem, since a fast market can trigger it and run past the cap, leaving you with no position in the exact scenario you built the order for. It is a legitimate tool and it is not a way around the trade off, because there is no way around the trade off.

    Should I use resting orders at all if I cannot watch the market?

    Resting orders are usually better than watching badly, because they commit you to a decision made calmly. The condition is that you know what each one will do without you, including across scheduled events, and that you have sized the position for a realistic fill rather than an optimistic one.

    Where This Leaves You

    The two orders are not competitors and there is no correct answer to hold on to. There is a question underneath them, which is whether you want the market to prove something before you commit, or whether you want a price you have decided is worth paying. Answer that first and the order type stops being a choice at all. It becomes the obvious consequence of what you already decided.

    What the data adds is a sense of proportion. On gold, over ten years, the market reached one level or the other in almost every window tested, and reached both in nearly one case in five. Resting orders are not passive. They are decisions you have already made and handed to a machine to execute while you are asleep, and the only way to make that comfortable is to know exactly what you handed over.

    Where Gold Empire Fits

    Gold Empire is a free Telegram channel where I post gold analysis with the reasoning stated before the move rather than after it, losing days included. There is nothing to buy in order to follow along, and an optional Kit if you want more structure later. I publish no profit claims and I do not rank brokers for payment.

    The free survival sheet is the one page version of the sizing discipline described here. If you want the neighbouring mechanics, what is the spread in gold trading covers what you pay on entry, and where to place a stop loss on XAUUSD covers the order on the other side of the position.

    About the author. Matthew writes Gold Empire. He is interested in the unglamorous half of this business, cost, size, frequency and the arithmetic of staying solvent, on the view that most accounts are lost to ordinary errors repeated patiently rather than to any single dramatic trade.

    Disclaimer: This article is general educational content about how two order types behave. It is not financial advice, not a recommendation of any broker, product or method, and not a suggestion to place any particular order. Trading gold, CFDs and leveraged products carries a high risk of losing money rapidly. No entry, stop or target discussed should be treated as a signal. The 0.5% order distance and the five fixing horizon are stated assumptions used as a worked example, not settings to copy. All fill rate and distance figures are computed from the published LBMA daily gold benchmark over 2016 to 2025, describe the behaviour of that public benchmark and not the execution of any broker or account, and the source is linked so you can verify them. The FOMC meeting dates are taken from the Federal Reserve’s published calendar, which is linked. No gold price is quoted anywhere in this article and no real trading results are represented.


  • 5 Price Action Rules Every Trader Needs to Know, Tested Against 10 Years of Gold

    5 Price Action Rules Every Trader Needs to Know, Tested Against 10 Years of Gold

    Ask around in any trading group and you will be handed a dozen patterns before anyone asks what you are actually trying to do. This article takes a narrower path. Below are 5 price action rules every trader needs to know, and rather than assert them, I have tested each one against ten complete years of the daily gold benchmark so you can see the arithmetic underneath.

    These are not entry signals. They are constraints, the sort of thing that decides whether you are still in this business in two years. No entry, stop or target discussed should be treated as a signal.

    Before the rules, one word on where the numbers come from, because a rule without evidence is just an opinion said loudly.

    Where these numbers come from

    Everything I quote below comes from one source: the LBMA Gold Price, the daily benchmark administered in London and used across the industry for settlement and valuation. I downloaded the afternoon benchmark series and measured the window from 1 January 2016 to 31 December 2025, which is 2,506 published benchmark days, ten complete calendar years.

    Two assumptions worth stating plainly, because you should never accept a statistic without them. First, one “day” here means one benchmark publication, so weekends and London holidays simply do not exist in the series. That works out at an average of 250.6 benchmark days per year. Second, every percentage is measured benchmark to benchmark, close of one to close of the next, which means intraday swings are invisible to it. The daily numbers below are therefore the calm version of reality, not the dramatic one.

    Chart supporting the 5 price action rules every trader needs to know, showing how often gold repeated the previous day's direction and how many days were quiet
    The evidence behind the 5 price action rules every trader needs to know: how often the gold benchmark repeated yesterday’s direction, and how many days barely moved. Source: LBMA Gold Price PM, 2016 to 2025.

    The 5 price action rules every trader needs to know, in order

    They are in this order deliberately. The first two decide how often you trade, which matters more than the last three combined.

    Rule 1: The chart records what happened, it does not lean anywhere

    The most common thing a beginner does with a chart is extend it. Yesterday closed strong, so today should follow. It is such a natural way for a mind to work that it barely registers as an assumption.

    Here is what the benchmark actually did. Across 2,492 consecutive pairs of days in that ten year window, the gold benchmark moved in the same direction as the previous day 52.13 percent of the time, and in the opposite direction 47.87 percent of the time.

    Read that carefully, because it is easy to read it as support for momentum. Yesterday’s direction gets you 52 out of 100 rather than 50 out of 100. That is a coin very slightly out of true, and it is nowhere near enough to pay for a spread, a commission and a wrong guess about size. Anyone who tells you gold trends reliably from one day to the next is describing a two percentage point lean as if it were a law.

    What follows from this is not “never trade continuation”. It is that direction alone is close to worthless, so whatever you are trading, the reason had better be something other than “it went up yesterday”. Price action is a record of transactions that already happened. It has no memory and no obligation.

    Rule 2: Most days are not worth your attention

    In the same window, 51.7 percent of benchmark days moved less than half a percent. 78.4 percent moved less than one percent. The average absolute daily move was 0.661 percent, and the median was 0.480 percent, which is lower still because a handful of violent days drag the average up.

    So slightly more than half of all trading days are, for practical purposes, quiet. If you sit at a screen every one of those 250 days looking for something to do, the market will oblige you, because a chart at sufficient magnification always looks like it is doing something.

    This is the rule that saves the most money and gets ignored the most often. The trader who takes twenty positions a month in a market that is genuinely moving on maybe eight of those days is not being more active, they are paying the spread twelve extra times for the privilege of watching noise. Patience is not a personality trait here, it is a cost control measure.

    Rule 3: A level only counts if you marked it before price arrived

    Levels drawn after the fact always look perfect. That is not because you have a good eye, it is because you can see where price turned, and you are drawing to the answer.

    The discipline is simple to state and hard to keep: mark your levels when the market is closed or quiet, write down what you expect to happen at each one, and then do not move them because price is approaching. A level you shifted twenty minutes ago is no longer a level, it is a rationalisation with a line attached.

    I have written separately on how these zones actually form in what support and resistance means in gold trading. The mechanics matter, but the sequencing matters more. Marked first, then traded. Never the other way round.

    Rule 4: Context outranks pattern, every time

    The same candle formation means opposite things depending on where it appears. An engulfing candle at the top of an extended run and the identical shape in the middle of a range are not the same event, and no pattern label captures the difference.

    This is why pattern lists are such a poor way to learn. A list gives you thirty shapes and no way to rank them, and the beginner ends up finding all thirty every session. What you actually need is a read on the structure first, then a look at whether the candle in front of you fits it or fights it. That order of operations is the whole skill, and I laid out the structural side in what market structure is in gold trading.

    If you take one thing from this rule: a pattern is a sentence, and structure is the paragraph it sits in. Reading the sentence alone is how people end up confidently wrong.

    Rule 5: Size the position before you like the trade

    The fifth rule is the one that keeps the other four from mattering.

    Recall that 95.6 percent of benchmark days moved less than two percent. That sounds reassuring until you turn it around: roughly one day in every twenty-three moved more than two percent, and on a leveraged account the arithmetic of those days is what decides whether you are still trading next year. You do not get to know in advance which day it is.

    So the size and the exit have to be decided while you are indifferent, before the chart has had a chance to persuade you. Once you like a trade, every number you choose will be a little more generous than it should be. That is not weakness, it is how anyone behaves when they already want something. The defence is sequence: decide the risk, then look at the setup. Where that line belongs is the subject of where to place a stop loss on XAU/USD, and the broader framework sits in risk management for gold trading.

    Why rules beat instinct here

    There is a reason I keep pushing constraints rather than techniques, and it is not modesty about my own reading of a chart.

    The European Securities and Markets Authority, when it introduced its product intervention measures on contracts for difference, published what national regulators had found across EU jurisdictions. Their analyses showed that 74 to 89 percent of retail accounts typically lose money, with average losses per client ranging from 1,600 to 29,000 euros.

    That is a wide band because different regulators measured different populations, and it is worth reading honestly rather than as a scare statistic. What it says is that the base rate for this activity is poor, and it is poor across every jurisdiction that looked. Nothing in that finding is about pattern recognition. It is about cost, size, frequency and staying power, which is exactly what rules 2 and 5 govern.

    If the base rate is that unforgiving, then the sensible first goal is not to find a better entry. It is to stop doing the things that make the base rate what it is.

    How to actually put these into practice

    Reading a rule and running one are different activities. Here is the version I would give someone starting on Monday.

    Write the five rules on one page, in your own words, and keep the page where you can see it. Rules held in memory quietly soften. Then, for a month, log every position against them: which rule, if any, you broke. Do not try to improve your results during that month. Just measure.

    Most traders discover the same thing, which is that rule 2 accounts for the bulk of the damage. Not bad analysis, simply too many positions on days that were never going anywhere. If that is what your log says, you now have a specific problem to fix rather than a vague sense that you should be more disciplined.

    If reading charts calmly is the part you find hardest, how to read a gold chart with a clear head covers the practical side of that.

    Free gold survival sheet

    Get the free Gold Empire survival sheet, a one page guide to the constraints that keep an account alive through exactly the kind of market this article describes. One email, no spam, unsubscribe anytime.

    Get the free survival sheet →

    Frequently asked questions

    Are these 5 price action rules every trader needs to know enough on their own?

    No, and I would be suspicious of anyone who said otherwise. They are constraints, not a method. They tell you when not to act and how much to risk when you do, which leaves the question of what you are actually looking for entirely open. What they do is stop the two errors that end most accounts, trading too often and sizing after falling in love with a chart.

    Does the 52.13 percent figure mean momentum trading does not work?

    It means daily direction on its own carries almost no information for this instrument in this period. Momentum approaches that work tend to operate on different horizons, with filters and position management doing much of the work. The figure is a warning against the naive version, the one that reads a green day as a reason to buy.

    Why measure a daily benchmark rather than intraday candles?

    Because the LBMA benchmark is a published, auditable price with a documented methodology, which means you can check every number in this article yourself. Intraday feeds vary between brokers, so any statistic drawn from one is really a statistic about that broker. The tradeoff is that daily data understates intraday movement, and I would rather understate it than quote something you cannot verify.

    Do these rules apply to instruments other than gold?

    The rules do. The specific percentages do not, and you should not carry them across. Every market has its own distribution of quiet and violent days, and the honest thing to do is measure your own rather than borrow mine.

    How long before rules like these show up in results?

    Longer than most people are willing to wait, because the benefit arrives as an absence. You do not see the losses you did not take. This is why the month of logging matters, it gives you something to look at other than the balance, which is far too noisy to judge a change of behaviour by.

    Is it worth trading at all if 74 to 89 percent of accounts lose money?

    That is a fair question and it deserves a straight answer rather than a sales one. That base rate is real, and anyone deciding to trade should decide it with the number in front of them. What I can say is that the figure describes a population that overwhelmingly trades too large and too often, and that the sensible response is either to fix those two things or to conclude that the activity is not for you. Both are respectable answers.

    Where Gold Empire fits

    Gold Empire is a free Telegram channel where I post gold analysis with the reasoning stated before the move rather than after it, losing days included, because a record that only shows the good days is not a record. There is nothing to buy in order to follow along, and an optional Kit if you want more structure later. I do not publish profit claims, and given the ESMA figures above, you should be wary of anyone who does.

    The free survival sheet is the one page version of the constraints in this article, meant to sit next to your screen rather than in a folder.

    About the author. Matthew writes Gold Empire. He is interested in the unglamorous half of this business, cost, size, frequency and the arithmetic of staying solvent, on the view that most accounts are lost to ordinary errors repeated patiently rather than to any single dramatic trade.

    Disclaimer: This article is general educational content about how price data and leveraged markets behave. It is not financial advice and it is not a recommendation to buy or sell anything. Trading gold, CFDs and leveraged products carries a high risk of losing money rapidly. No entry, stop or target discussed should be treated as a signal. All statistics are computed from the published LBMA Gold Price PM benchmark for 2016 to 2025, with the assumptions stated in the article, and external figures are linked so you can check them yourself.


  • What Is Nonfarm Payrolls, and Why Does Gold React?

    What Is Nonfarm Payrolls, and Why Does Gold React?

    Every few weeks a single American statistic empties the order book, widens the spread and moves gold further in ninety seconds than it moved in the previous nine hours. That statistic is nonfarm payrolls, and if you have been trading gold for more than a month or two you have already been on the wrong side of one, probably without understanding what actually happened.

    This week is a heavy one for exactly that reason. The American calendar is stacked with labour market releases, and the payrolls report lands at the end of it. So this is a good moment to explain the machinery properly, because most of what gets said about this release in trading groups is wrong in a way that costs money.

    I am not going to tell you how to trade it. I am going to tell you what the number is, where it comes from, how precise it actually is, and why the honest answer to “what will gold do on payrolls day” is that nobody knows, including the people who sound most certain.

    Chart of monthly nonfarm payrolls changes against the survey margin of error, showing most months fall inside it
    Nonfarm payrolls: the monthly change against the survey’s own margin of error. Source: US Bureau of Labor Statistics.

    What nonfarm payrolls actually measures

    The Employment Situation report is published by the US Bureau of Labor Statistics. The headline everyone quotes, the payrolls number, is the estimated change in the number of people on American payrolls over the past month, excluding farm workers, the self employed, private household staff and a few other categories. That is where the slightly odd word “nonfarm” comes from. It is a leftover from an era when agricultural employment swung so violently with the seasons that leaving it in made the rest of the picture unreadable.

    The number is an estimate from a survey, not a count. The Bureau surveys roughly 119,000 businesses and government agencies each month, covering about 622,000 individual worksites, which together represent around 26 percent of all nonfarm payroll jobs. A second and completely separate survey of about 60,000 households produces the unemployment rate.

    Two surveys, two methods, two sets of numbers, released in the same document at the same minute. That alone should tell you the report is not the single clean fact it gets treated as.

    Why a metal cares about an American jobs number

    Gold does not care about employment. Gold cares about what employment does to interest rate expectations, and there the link is direct and official rather than a matter of opinion.

    The Federal Reserve has what is known as a dual mandate. In its own words, Congress has assigned it to conduct monetary policy “to support the goals of maximum employment and stable prices“. Employment is not one input among many. It is one of the two things the central bank is legally pointed at.

    So the chain runs like this. A jobs report changes the market’s view of how strong the labour market is. That changes expectations of what the Fed will do with rates. Rate expectations move the dollar and real yields. And gold, which pays no interest to anyone who holds it, becomes relatively more or less attractive as the return available on cash moves. That is the whole transmission, and it is the same chain I walked through in the piece on the FOMC and why gold reacts to it. Payrolls is not a competing story. It is one of the main pieces of evidence the committee is reading.

    This is why a strong jobs number often pressures gold and a weak one often supports it. Note the word “often”. It is not a rule, and later in this article you will see why treating it as one is how people get hurt.

    The number everyone quotes is one of four

    Open the report and you will find that the headline payrolls figure sits alongside several other numbers that regularly matter more.

    • The payrolls change itself. The number that flashes on every screen.
    • Revisions to the previous two months. The Bureau states plainly that “the prior 2 months are routinely revised to incorporate additional sample reports and recalculated seasonal adjustment factors.”
    • The unemployment rate, which comes from the household survey, not the business survey, and can move in a direction that appears to contradict the headline.
    • Average hourly earnings. Wage growth feeds directly into the inflation half of the Fed’s mandate, and in some months this is the line the market actually trades.

    A trader who has decided in advance that “strong number equals gold down” is reading one line of a four line document. It is entirely normal for payrolls to beat expectations while the prior two months are revised down by more than the beat, which means the level of employment is now lower than the market believed five minutes ago. The headline was green. The information was red.

    What the margin of error does to the headline

    This is the part almost nobody mentions, and it is the single most useful thing in this article.

    Because payrolls is a survey estimate, it carries sampling error, and the Bureau publishes how much. In its technical note it states that “the confidence interval for the monthly change in total nonfarm employment from the establishment survey is on the order of plus or minus 122,000” at 90 percent confidence.

    Sit with that number for a second. It means that when the report says employment rose by 90,000, the survey itself cannot distinguish that from zero with 90 percent confidence. It also cannot distinguish it from 200,000.

    I pulled the official series from the Bureau’s public data service and checked how often that matters. Over the 24 months to June 2026, the average absolute monthly change was about 91,000. Fifteen of those 24 months, that is 62 percent of them, reported a change smaller than the survey’s own margin of error. Those are the faded bars in the chart above.

    To put the scale in perspective: total nonfarm employment is running near 159 million. A typical monthly change of 91,000 is under six hundredths of one percent of that level. We are watching a small difference between two very large estimated numbers, and then trading it in the first second.

    Now, I want to be careful and fair here, because the wrong conclusion is easy to draw. This does not mean the data is worthless. The direction over several months carries real information, the level is meaningful, and the Fed is genuinely reading it. What it means is narrower and more practical: a single month’s headline is a noisy estimate, and a “miss” of 40,000 against forecast is statistical noise being reported as news. The market will still react to it. That reaction is real and it will move your position. But the confidence some people project about what the number means is not supported by the number itself.

    Why the revisions matter more than the release

    Follow the logic of that margin of error one step further and the revisions stop being a footnote.

    The first print of any month is the estimate with the least data behind it. More responses arrive over the following two months, and the Bureau updates the figure accordingly. So the number the market violently repriced on the first Friday is, by design, the least reliable version of that month’s employment picture, and the more accurate version arrives quietly weeks later when nobody is watching.

    There is a lesson in that which goes well beyond this one release. The market’s biggest reaction happens at the moment of maximum uncertainty, not the moment of maximum information. That is not a flaw you can exploit. It is simply the shape of the thing, and knowing it should make you humbler about the first ninety seconds rather than more excited about them.

    What the release window does to your account

    Whatever you believe about the number, the mechanical conditions during the release are hostile, and this part is not a matter of interpretation.

    Liquidity thins out before the print as market makers pull back. Spreads widen, sometimes dramatically, which I covered in more detail in the article on the spread in gold trading. Price can move through a range in a single tick with nothing traded in between. And that last point is the one that hurts people, because a stop loss is an instruction to exit at the market once your level is touched, not a promise of the price you will get. In a fast market it can fill materially worse than where you placed it.

    This is worth being blunt about. If your risk plan assumes your stop fills exactly where you put it, your actual risk on a payrolls Friday is larger than the number in your head. That is not a reason to trade without a stop, which would be far worse. It is a reason to size as though the stop might slip, and it is one of the reasons execution quality and who you trade through matters more on these days than on any other.

    None of this is exotic. It is the same set of conditions I described in the general guide to trading gold through high impact news, and payrolls is simply the clearest monthly example of it.

    How careful traders treat a payrolls Friday

    I am not going to give you an entry, and I would be suspicious of anyone who does. What I can describe is how people who are still trading after several years tend to behave around this release. There are broadly three approaches, and all three are legitimate.

    The first is to be flat. Close what you have before the release, sit it out, and come back when spreads normalise. This is not cowardice and it is not missing out. Choosing not to have an opinion during the least predictable minutes of the month is a decision with a real edge behind it, and plenty of consistently profitable traders do exactly this every month.

    The second is to already be positioned, with size chosen specifically so that a violent move against you is survivable rather than terminal. The key word is “already”. The position was taken for reasons that existed before the release, and the release is a risk to be endured rather than the reason for the trade.

    The third is to wait. Let the print land, let the first reaction happen, let the fake move in the wrong direction burn itself out, and only then consider whether the market has told you something. The cost of this approach is that you never get the best price. The benefit is that you are reacting to what happened rather than betting on what might.

    What all three share is that the decision was made in advance, calmly, and the position size was set so that being wrong is affordable. That is the whole discipline, and it is the same one described in the risk management guide that underpins everything else on this site.

    What none of them involve is deciding at 13:29 to take a large position because you have a feeling about the number.

    A quick word before the questions

    If this is the kind of explanation you find useful, the Gold Empire Telegram channel is where I post market context through the week, free and with no upsell attached. And the free Gold Survival Sheet is a one page checklist for exactly these situations: how to size, where risk actually sits, and what to check before a scheduled event lands.

    Free gold survival sheet

    Get the free Gold Empire survival sheet, a one-page guide to protecting your account through the kind of market this article describes. One email, no spam, unsubscribe anytime.

    Get the free survival sheet →

    Frequently asked questions

    When is nonfarm payrolls released?

    It is usually released on the first Friday of the month at 8:30 in the morning New York time, covering the previous month. The Bureau of Labor Statistics publishes its schedule in advance, so the date is never a surprise. There is no excuse for being caught unaware by a scheduled release.

    Does a strong jobs number always push gold down?

    No, and this is the most common mistake. The market trades the difference between the outcome and what was already expected, not the raw number. A strong figure that is weaker than the market had positioned for can send gold up. Add in revisions, wage growth and the unemployment rate pulling in different directions, and single line rules break down quickly.

    Why does gold sometimes move in both directions within a minute?

    Because the report contains several numbers that can conflict, because liquidity is thin enough that a modest amount of buying or selling moves price a long way, and because a lot of automatic orders trigger at once. The first move is frequently not the move that lasts. That is a description of what commonly happens, not a prediction you can rely on.

    Is the payrolls number accurate?

    It is a carefully constructed estimate, produced honestly, with its uncertainty published openly. It is not a precise count, and the Bureau has never claimed it is. The 90 percent confidence interval on the monthly change is around plus or minus 122,000, and that is a fact about survey mathematics rather than a criticism of the statisticians.

    Should a beginner trade the payrolls release?

    In my honest opinion, no. Spreads are at their worst, slippage risk is at its highest, and the informational content of the first move is at its lowest. If you are still building consistency, this is a poor place to learn, and there are twenty other trading days in the month with better conditions.

    What about the other labour releases in the same week?

    Reports such as job openings, private payroll estimates and jobless claims all feed the same picture, and they can move gold too, usually less. They are worth knowing about mainly so that you are not surprised by volatility on a day you assumed was quiet. Knowing what is on the calendar is basic operational hygiene.

    Where this leaves you, and what we do about it

    Nonfarm payrolls is a good teacher because it strips away the comfortable illusion that there is a knowable answer if you just read enough analysis. Here is a number produced by a rigorous public agency, published with its own error bars, revised twice as more evidence arrives, and interpreted through four separate lines that regularly disagree. If certainty were available anywhere, it would be available here, and it is not.

    So the honest position is the one this channel keeps arriving at from every direction. You cannot control what the number says or how the market reads it. You can control whether the size of your position makes a bad ninety seconds survivable. That is not a consolation prize. Over a career it is very nearly the whole game.

    Gold Empire is a free Telegram channel where we work through this kind of market mechanic in public. There is no promise of profit here and there never will be, because nobody can honestly make one. What we can do is make sure you understand the machinery before it teaches you the expensive way.

    If this was useful, the free Gold Survival Sheet is the natural next step. It is a one page checklist covering position size, stop placement and the questions worth asking before a scheduled event lands. It costs nothing and it does not require you to trade anything.

    About the author. Matthew writes the Gold Empire market notes and has spent his time in this market mostly learning what not to do. He is not a licensed adviser and does not want to be one. His interest is in the part of trading nobody posts screenshots of: staying in the game long enough for a method to matter.

    Disclaimer: This article is general educational content about market mechanics and public economic data. It is not financial advice, not a recommendation, and not a solicitation to trade. Trading leveraged products carries a high risk of losing money rapidly. No entry, stop or target discussed should be treated as a signal. Past market behaviour does not predict future behaviour. Consider your own circumstances and seek independent regulated advice if you need it.


  • What Is a Weekend Gap in Gold Trading?

    What Is a Weekend Gap in Gold Trading?

    A weekend gap in gold trading is what you see when Monday’s first price is nowhere near Friday’s last one. No candle connects them. Nothing traded in between. You go to bed on Friday with the chart in one state and you come back to a market that has already moved without you, and without giving anybody a chance to buy or sell inside that space.

    This past weekend was a clean example of why the subject matters. Headlines moved over a Saturday and a Sunday while every gold desk in the world was shut. By the time the market reopened, the first tradeable price already reflected the new information. Traders who were flat spent Monday morning reading a chart. Traders who were holding size spent Monday morning finding out what they had been holding.

    This article explains what a gap actually is, why gold in particular produces them, what a gap does to a stop loss and to margin, and what a sensible person does about it on a Friday afternoon. It contains no prices, no entries and no targets. It is about the mechanics.

    Chart showing a weekend gap in gold trading between Friday close and Monday open
    A weekend gap in gold trading: the shaded band is the zone where no price traded at all.

    What a weekend gap in gold trading actually is

    Every price on your chart is a record of a transaction. Somebody was willing to sell, somebody was willing to buy, and the number where they agreed became a print. A chart is a list of those agreements in time order.

    A gap is the absence of one. When the market shuts on Friday, the last agreement of the week is recorded. When it opens again, a new agreement is recorded. If the two numbers are far apart, the space between them contains no agreements at all, because there was no market in which to make them.

    That is the whole idea. A gap is not a special kind of move. It is an ordinary move that happened while the door was locked, so the chart has no way to draw it.

    Three consequences follow from that, and they are the reason gaps matter more than they look:

    • Nobody has a position taken inside the gap, because nobody could trade there.
    • Nobody’s stop loss could be filled inside the gap, for the same reason.
    • The first tradeable price after the gap is the market’s new opinion, formed in the dark, with no argument along the way.

    Why the gold market shuts at all

    Gold has a reputation for trading around the clock, and that reputation is broadly earned. The London Bullion Market Association describes the over the counter market plainly: “Internationally, precious metals are traded on a 24-hour basis,” and it puts the scale of it at “approximately 25 billion dollars worth of gold is settled each day in the global OTC market, with London at its centre” (LBMA, About Loco London).

    Notice the words “each day”. Twenty four hours a day is not the same as seven days a week. The benchmark makes the point even more sharply. The LBMA Gold Price, the reference number the industry settles against, is set by auction twice a day, at 10:30 and 15:00 London time, and it runs on business days only (ICE Benchmark Administration). On a Saturday there is no auction, because there is no market to auction into.

    Put a number on the hole that leaves. If you treat the week as continuous trading from Sunday evening to Friday evening, the shutdown runs roughly 48 hours out of the 168 hours in a calendar week. That is about 29 percent of every week with no tradeable gold price anywhere on earth. The assumption there is a standard week with no holidays, and your own broker’s hours may differ by an hour or two at each end, but the order of magnitude is the point: for two days out of seven, the world keeps generating news about gold and the market has no way to answer.

    Gold is unusually exposed to this because of what moves it. Interest rate expectations, the dollar, inflation prints and geopolitical risk are the main drivers, and none of them respect a trading calendar. A central banker gives a speech on a Saturday. A conflict escalates or de-escalates on a Sunday. If you have never worked through the full list of drivers, our piece on what moves the price of gold lays them out.

    What a gap does to your stop loss

    This is the part that costs people real money, and it is the part almost nobody thinks about until the first time it happens to them.

    A stop loss is an instruction, not a guarantee. What you are telling your broker is: when the market reaches this price, get me out at the best available price. In a liquid, continuously trading market, “the best available price” is usually very close to the level you named, and the distinction feels academic.

    A gap removes the distinction. If your stop sits inside the gap, the market never traded there. Your instruction is triggered at the reopen and filled at the first available price, which can be well beyond the level you chose. The loss you sized for is not the loss you take.

    People discover this and conclude that stops are useless. That is the wrong lesson. The right lesson is that a stop protects you from the ordinary case and does not protect you from the extraordinary one, so the extraordinary case has to be handled somewhere else, which is in your position size. Our guide on where to place a stop loss on XAU/USD covers the mechanics of placement, and position sizing for gold covers the part that actually caps the damage.

    Margin arrives before you are awake

    There is a second-order effect that beginners rarely anticipate. A leveraged position that gaps against you does not just book a bigger loss than planned. It also consumes margin instantly, at the open, before you have looked at a screen. If the account was already carrying several positions, the reopen can produce a margin call in the first minutes of the week, on a chart you have not even read yet.

    This is not an argument for panic. It is an argument for arithmetic. If you would not be comfortable with a position that moved several times its usual distance against you before you could react, then the position is too large to hold through a closed market. That is a sizing decision made on Friday, not a reaction made on Monday.

    Execution quality is a broker question too

    How a gap is handled in practice depends partly on who is filling your orders: the reopen spread, whether stop orders are treated as market orders, and how slippage is applied. This is one of the few moments where the choice of counterparty shows up directly in your P&L, which is why it belongs in the same conversation as choosing a broker for gold trading rather than being treated as a chart topic.

    Working through this with us. We publish gold market context daily in the free Gold Empire Telegram channel, and the free Gold Survival Sheet is the one page checklist we use before holding anything through a closed market. Both are free, and neither asks you to trade.

    Four things a gap can do next, not one

    There is a piece of folklore that says gaps always fill. It gets repeated because it is memorable and because it is often enough true to feel like a rule. It is not a rule. It is a tendency with no timetable attached, and a tendency with no timetable is not something you can plan around.

    Here is the honest version. After a gap, price can do four different things, and none of them is announced in advance:

    • Fill quickly. The move was an overreaction to a headline, participants who could not trade over the weekend take the other side, and the gap closes within hours.
    • Fill slowly. The market drifts back over days or weeks, long after anyone who traded the reopen has been shaken out.
    • Fill partially, then continue. Price dips back into part of the untraded zone, finds sellers or buyers there, and carries on in the direction of the gap. This is the case drawn in the chart above.
    • Never fill in any timeframe that matters to you. The repricing was real, the market accepted it, and the empty space stays empty.

    If four outcomes are possible and you cannot tell which one you are in, then “the gap will fill” is not analysis. It is a hope with a chart attached. The useful question is not what the gap will do. It is what you will do in each of the four cases, decided before the market opens.

    Reading the Monday open without guessing

    The reopen is one of the lowest quality information environments of the week. Spreads are typically wider than normal, volume is thin until the Asian session properly gets going, and the first prints often move more than they should because there is very little on the book to absorb them. If you want the wider context on why different hours behave differently, we covered it in the best time to trade gold.

    A few practical points that hold up regardless of your method:

    • The first price is not a verdict. It is the first offer in a negotiation that has not started yet. Treating the opening print as the market’s settled opinion is how people end up buying the extreme of the week.
    • Wait for the market to trade, not just to open. A gap becomes readable once there is enough activity to see whether the new level attracts business or repels it. That usually takes hours, not minutes.
    • The gap edges become reference points. Friday’s close and Monday’s open are levels the whole market can see, which makes them worth marking on the chart. That is exactly the same logic as any other structural level, and our piece on support and resistance in gold trading applies to them without modification.
    • Standing aside is a decision. If the reopen is unreadable, not trading it is a position with a defined cost of zero.

    A gap driven by a scheduled event is a different animal from a gap driven by a surprise, and if the weekend contained something that was on the calendar, the approach we set out in trading gold through high impact news is closer to what you want.

    You cannot control whether the market gaps. You can control how much of your account is exposed to it when it does.

    Three Friday habits that cost nothing

    None of what follows requires a view on direction. All of it is available to a complete beginner.

    1. Decide your weekend exposure deliberately, not by default. The question is not “should I hold over the weekend”, because sometimes the answer is genuinely yes. The question is whether the size you are holding is a size you chose for a two-day blind spot, or just the size you happened to have on at 4pm on Friday. Those are different numbers for most people.

    2. Assume the stop can be jumped, and size for that. Work out what the position costs if it opens well past your stop. If that number changes how you feel, reduce until it does not. This single exercise removes most of the horror from Monday mornings, and it is the same discipline described in our guide to risk management in gold trading.

    3. Write down what you will do in each of the four cases. Two sentences is enough. If it gaps in my favour, I will do this. If it gaps against me, I will do that. The value is not in the prediction, it is in having a plan that was written by a calm person rather than by a person looking at a red number.

    Free gold survival sheet

    Get the free Gold Empire survival sheet, a one-page guide to protecting your account through the kind of market this article describes. One email, no spam, unsubscribe anytime.

    Get the free survival sheet →

    Frequently asked questions

    Do all weekend gaps get filled?

    No. Many do, which is why the myth persists, but plenty do not, and among those that do, some take months. There is no timetable, so a gap fill cannot be treated as an expected outcome you can build a plan on.

    Can I avoid gap risk completely?

    Only by being flat when the market closes. That is a legitimate choice with a real cost, since you also give up any move that happens in your favour. Most of the difference between traders who survive gaps and traders who do not is size, not timing.

    Why does gold gap when it trades 24 hours a day?

    Because 24 hours a day applies to business days. The benchmark auction runs twice a business day and there is no weekend session, so roughly two days a week the market is closed while the news that drives gold carries on.

    Does a bigger gap mean a bigger move is coming?

    Not reliably. Gap size tells you how much the consensus changed while the market was shut. It says nothing about what happens next, and large gaps are followed by continuation and by full reversal often enough that neither can be assumed.

    Should a beginner trade the reopen?

    There is nothing magic about it, and it has wider spreads and thinner liquidity than almost any other part of the week. If you are still building consistency, there are better hours to be learning in.

    Where this leaves you, and what we do about it

    Gaps are one of the clearest illustrations of the idea this whole channel is built around. You cannot control the market. You can control the size of the bet you have on the table when the market does something you did not authorise. Everything else is commentary.

    Gold Empire is a free Telegram channel where we publish gold market context and work through this kind of mechanic in public. There is no promise of profit here, and there never will be, because nobody can honestly make one. What we can do is make sure you understand the machinery you are dealing with before it teaches you the expensive way.

    If this article was useful, the free Gold Survival Sheet is the natural next step. It is a one page checklist covering position size, stop placement and the questions worth asking before you hold anything through a closed market. It costs nothing and it does not require you to trade anything.

    About the author. Matthew writes the Gold Empire market notes and has spent his time in this market mostly learning what not to do. He is not a licensed adviser and does not want to be one. His interest is in the part of trading nobody posts screenshots of: staying in the game long enough for a method to matter.

    Disclaimer: This article is general educational content about market mechanics. It is not financial advice, not a recommendation, and not a solicitation to trade. Trading leveraged products carries a high risk of losing money rapidly. No entry, stop or target discussed should be treated as a signal. Past market behaviour does not predict future behaviour. Consider your own circumstances and seek independent regulated advice if you need it.


  • What Is the FOMC and Why Does Gold React to It?

    What Is the FOMC and Why Does Gold React to It?

    Eight times a year, the gold market stops behaving like a market and starts behaving like a courtroom waiting for a verdict. Volume thins out. Spreads widen. Price drifts in a narrow band as if someone pressed pause. Then a statement is released, and within seconds gold can travel further than it did in the previous six hours.

    That is an FOMC day. So what is the FOMC, and why does a committee that never once mentions gold move the gold price within seconds of speaking? If you trade gold without knowing the answer, you are not trading a chart, you are standing on a railway line with headphones on.

    The good news is that the mechanism is not complicated. It is not insider knowledge, and it is not something you need a degree to follow. But it does require understanding one chain of cause and effect, because almost every beginner mistake around these events comes from skipping a link in that chain.

    How an FOMC meeting reaches the gold priceFour links in one chain. Gold sits at the end of it, not the beginning.STEP 1FOMC decisionand tonestatement, votes, pressSTEP 2Expectations forfuture rateshigher for longer, or notSTEP 3Dollar andreal yields movethe cost of holding goldSTEP 4Gold pricereactslast link in the chainWHY THE OBVIOUS TRADE OFTEN FAILSMost of the expected decision is already in the price before the announcement.Gold reacts to the gap between what the market expected and what it heard,which is why a rate hold can move price as violently as a change.EDUCATIONAL ILLUSTRATION · NO PRICES, NO SIGNALS
    Why gold reacts to the FOMC: the chain from a Federal Reserve decision to the gold price

    What the FOMC actually is

    The FOMC is the Federal Open Market Committee. It is the group inside the US Federal Reserve that decides the direction of American interest rates.

    Three practical facts are worth memorising:

    • It meets on a published schedule. The Federal Reserve states plainly that the committee “holds eight regularly scheduled meetings during the year,” and it publishes those dates years ahead on its own FOMC meeting calendar. Eight dates a year, known in advance. There is no excuse for being surprised by one.
    • It releases a written statement at a fixed time, followed shortly after by a press conference with the Fed Chair.
    • It sets a target range for the rate at which American banks lend to each other overnight. Everything else in the financial system, from mortgages to government bonds to the value of the dollar, prices off that anchor.
    • Exactly twelve people vote. Under the structure the Fed describes in its own explanation of the committee, the FOMC has twelve voting members: the seven members of the Board of Governors, the president of the New York Fed, and four of the remaining eleven Reserve Bank presidents serving one-year rotating terms. That number matters for a practical reason we come back to below. When two or three of twelve vote against the decision, that is a quarter of the committee disagreeing in public, and markets read it as a signal about the next meeting rather than this one.
    • The minutes arrive three weeks later. The Fed releases the full account of the discussion three weeks after the decision, which is a second, quieter market event that most retail traders never diarise.

    Notice what the committee never does: it never mentions gold. Nobody in that room votes on the gold price. And yet gold reacts, sometimes violently, within the same second. That is the part worth understanding.

    Why a metal cares about an American interest rate

    Gold has one defining feature that explains almost all of its behaviour around central banks: it pays you nothing.

    A bond pays a coupon. A savings account pays interest. A share can pay a dividend. Gold sits there. It costs money to store and it produces no income of its own. So the question every large holder of money keeps asking is simple: what am I giving up by holding something that pays nothing?

    When safe interest rates are high, the answer is: quite a lot. Parking money in short-term government debt pays you a real return with almost no risk, so the cost of choosing gold instead goes up. When safe rates are low, the answer is: not much. Gold looks less expensive to hold, so money drifts back toward it.

    That is the whole relationship in one sentence. The FOMC does not set the gold price, it sets the cost of holding gold. Everything else is a consequence.

    There is a second channel that runs alongside it. Interest rate expectations move the US dollar, and gold is priced in dollars almost everywhere on earth. A firmer dollar makes gold more expensive for buyers using other currencies, which softens demand at the margin. A weaker dollar does the reverse. If you want the wider map of these forces, we broke it down in what moves the price of gold. The Fed sits upstream of two of the four forces on that map, which is why one committee gets so much attention.

    The three things the market is actually listening to

    Beginners think an FOMC release is one event. It is closer to three, and they can pull in opposite directions.

    1. The decision itself. Rates go up, down, or stay where they are. This is the headline number every news site leads with, and it is very often the least important part of the day, for reasons we will get to in a moment.

    2. The wording of the statement. The committee describes how it sees inflation, employment and growth, and it hints at what it might do next. Analysts read this the way lawyers read contracts. A phrase removed, a word softened, a reference to future decisions changed from one adjective to another: these are the details that shift expectations. The vote split matters here too. With only twelve votes on the table, a decision carried nine to three is a very different message from one carried unanimously, and traders treat public dissent as evidence the committee is closer to changing course.

    3. The press conference. The Chair takes questions live and unscripted. This regularly moves markets more than the statement did, and sometimes in the opposite direction, because a single answer can reframe how the whole statement is read. Traders who close their charts after the statement and walk away are frequently surprised by what happens forty-five minutes later.

    Why the obvious trade so often loses money

    Here is the single most useful thing on this page, and it is the reason most beginners lose money around news events.

    The market does not price what happens. It prices the difference between what happens and what was already expected.

    Big institutions do not wait for the announcement. They position for it days or weeks ahead, based on economic data, previous Fed comments and market-implied probabilities. By the time the statement lands, the expected outcome is already reflected in the price. If the committee does exactly what everyone thought it would, there may be very little left to react to.

    Which produces two situations that confuse new traders every single time:

    • Rates change, and gold barely moves. The change was fully anticipated, so it was already in the price. Nothing new was learned.
    • Rates stay exactly the same, and gold moves hard. The decision was expected, but the tone was not. A hold delivered with a warning about future increases is not the same event as a hold delivered with concern about slowing growth, even though the headline number is identical.

    This is why reading a headline and taking a position is not a strategy. The headline is public information the instant it exists, and public information that everyone acted on ten seconds before you did has no edge left in it.

    You are never trading the news. You are trading the crowd’s reaction to how the news differed from what it expected. Those are not the same thing, and only one of them is visible on your chart.

    What the release window does to your account

    Set the economics aside for a minute, because there is a mechanical problem that hurts more beginners than any misread statement ever has.

    In the minutes around a major release, the market stops functioning normally.

    Spreads widen. The gap between the buy price and the sell price can expand to several times its usual size while liquidity providers protect themselves. You can pay far more to enter, and receive far less to exit, than your practice sessions taught you to expect. Execution quality varies significantly between brokers here, which is one of the less glamorous reasons we care about choosing a broker properly.

    Slippage becomes normal. Your order fills at the next available price, not the one you clicked. In a fast market those can be a long way apart, and that includes your stop loss. A stop is an instruction, not a guarantee of price.

    Price can go both ways before it goes anywhere. A common pattern is a violent spike in one direction, followed by a full reversal within minutes as the market digests the detail behind the headline. Traders positioned either way can both be stopped out of the same move. The candle left behind looks obvious in hindsight and was unreadable in real time.

    None of this is a broker cheating you or the market being rigged. It is what a market looks like when everyone repositions at once. But it means that during the release window, your risk is genuinely less controllable than it is at any other time of day. We covered the practical handling of these windows in more depth in how to trade gold through high-impact news.


    Want the boring rules that keep beginners in the game? Our free Survival Sheet covers the risk limits that decide whether a volatile week is an inconvenience or the end of your account, and we talk through market conditions daily with our community on Telegram. No hype, no promises.

    Get the free Survival Sheet


    How careful traders treat an FOMC day

    This is not a set of instructions and it is certainly not a strategy to copy. It is a description of habits that experienced traders tend to share, and every one of them is about protecting capital rather than capturing the move.

    They know the date before the week starts. The calendar is published. Checking it takes thirty seconds and belongs in your routine, in the same place as checking whether you slept.

    They decide their plan before the event, not during it. The decision that matters is made while you are calm: am I flat through this, do I reduce what I already hold, or do I stand aside completely and look afterwards. Deciding in the middle of a spike is not deciding, it is reacting.

    They treat existing positions as the first priority. Traders who already hold something going into a release often think about that exposure long before they think about new opportunities. Reducing size ahead of an event you cannot forecast is not timidity, it is arithmetic.

    Many of them simply do not trade the window. This is worth saying plainly, because nobody selling you excitement will say it. Sitting out the fifteen minutes around a major release costs you nothing except the fear of missing out, and it removes an entire category of avoidable damage. The market is open for many hours after the noise settles.

    They wait for structure to return. Once the dust clears, the chart usually tells a cleaner story than it did mid-spike. Levels get tested properly, ranges re-form, and normal analysis becomes possible again. Patience is not a personality trait here, it is a technical advantage.

    Where this fits into the bigger picture

    The reason to learn what the FOMC is has nothing to do with predicting it. You will not out-forecast institutions with research desks, and you do not need to.

    The reason is context. Gold behaves differently depending on what the market believes about the direction of rates, and knowing which environment you are in changes how much you should expect from a level, how wide a normal daily range looks, and how much confidence any pattern deserves. A trader who understands the environment reads the same chart more sensibly than one who does not.

    And there is the survival argument, which matters more. Most accounts are not destroyed by a lack of clever ideas. They are destroyed by a position that was far too large when a fifteen-minute window turned unpredictable. Knowing when those windows are scheduled is one of the cheapest forms of risk management available to you. It requires no skill at all, only the discipline to look at a calendar.

    Free gold survival sheet

    Get the free Gold Empire survival sheet, a one-page guide to protecting your account through the kind of market this article describes. One email, no spam, unsubscribe anytime.

    Get the free survival sheet →

    Frequently asked questions

    What does FOMC stand for?

    Federal Open Market Committee. It is the policy-setting body within the US Federal Reserve that decides the target range for American short-term interest rates. It meets on a published schedule roughly eight times a year and releases a statement at a fixed time on the final day of each meeting.

    Does gold always fall when interest rates rise?

    No, and expecting that relationship to hold mechanically is a common way to lose money. Higher rates raise the cost of holding an asset that pays no income, which is a headwind for gold in general. But the reaction depends on what was already expected, on what the same decision implies about growth and inflation, and on whether fear is pushing money toward safety at the same time. Several forces act on gold at once, and they do not always agree.

    Why did gold move so much when rates were left unchanged?

    Because the market prices expectations, not announcements. If the decision was already anticipated, the new information is in the tone: how the committee described inflation, whether members disagreed, what the Chair said under questioning. A change in expectations about future decisions moves price even when today’s decision changed nothing.

    Should I trade during an FOMC release?

    That is a personal decision and this article cannot make it for you. What is worth knowing is that spreads widen, slippage becomes likely and price frequently moves in both directions before settling, so your risk is measurably harder to control in that window than at any other time. Many experienced traders deliberately stand aside and look for cleaner conditions afterwards.

    How can I find out when the next FOMC meeting is?

    The Federal Reserve publishes its meeting calendar on its own website well in advance, and every serious economic calendar lists the dates and release times. Checking the week’s scheduled events before you trade is a basic habit, not an advanced one.

    Is the press conference more important than the statement?

    Sometimes, yes. The statement is carefully worded and released first, but the Chair answers unscripted questions afterwards, and a single answer can change how the market interprets the whole statement. It is not unusual for the second reaction to be larger than the first, or to reverse it.

    Where this leaves you, and what we do about it

    Here is the practical close, and it is deliberately unexciting.

    Gold Empire exists to make the boring half of this job normal. The community on Telegram is free to follow, and what we actually do there is talk through conditions in plain language: what is on the calendar this week, what the market appears to expect, what a sensible risk decision looks like when the answer is genuinely unknown. No promises of profit, no win-rate claims, no countdown timers. Alongside it there is a free Survival Sheet with the risk limits that keep a beginner’s account alive long enough to build judgement, and an optional Kit for people who want the material organised.

    If you take one thing from this article, let it be the cheapest habit in trading: open the calendar before the week starts, and know what you are holding into the eight dates a year when the rules of the market change for fifteen minutes. Then pick up the Survival Sheet and make the rest of it routine.

    About the author

    Matthew runs the Gold Empire community. He spends far less time forecasting central banks than most people expect, mostly because he watched several traders build convincing macro arguments and then lose their accounts to position sizes those arguments could not survive. His view of an FOMC day is unromantic: know when it is, know what you are holding into it, and accept that the clean part of the chart comes later.

    Risk disclaimer

    This article is educational content only and is not financial advice, investment advice, or a recommendation to trade. Trading gold and other leveraged instruments carries a high level of risk and can result in the loss of your entire capital. Nothing here is a prediction of future price movement, and no entry, stop or target discussed should be treated as a signal. Past market behaviour does not indicate future results. Consider your own circumstances and seek independent advice from a licensed professional before trading.