
Gold CFD vs physical gold is usually presented as a matter of taste, as though one suits traders and the other suits savers and there is nothing more to say. That framing hides the only difference that has ever emptied an account. A physical holder and a CFD holder can watch the identical percentage move on the identical chart and walk away with completely different outcomes, because one of them posted the full value and the other posted a fraction of it.
So rather than write another feature table, I measured it. I took the published afternoon gold benchmark over the last ten and a half years, asked what each holder experiences on the same day, then worked out what it costs each of them to simply keep holding. Two numbers came out of that which I had not expected to be quite so blunt, and I have put both below with the arithmetic attached.
What Gold CFD vs Physical Gold Actually Means
Strip the marketing away and there are three differences that matter, in order of how much damage they do.
The first is what you posted. Buy metal and you pay the whole value. Your position cannot be closed by anyone but you, because there is nothing to call in. Buy a contract for difference and you post margin, a fraction of the value, and you have agreed that if the market moves against that fraction far enough, the position is closed for you whether or not you still believe in it.
The second is rent. Metal is bought once. A CFD long is a financed position, which is a polite way of saying the full value is borrowed and charged for every day you hold it. The charge is small measured against the value of the contract and very large measured against the money you actually put up, and that gap is where most of the confusion lives.
The third is what you own. A CFD is a contract with a firm. Metal in your possession is metal in your possession. This is the difference everyone writes about and, on any ordinary week, the least likely of the three to affect you.
Everything else, the ticket size, the platform, the ability to go short, follows from those three. The first two can be measured, so that is what the rest of this article does.
The First Difference: What One Bad Day Does to Each Holder
The arithmetic here is not complicated, it is just rarely written down. A loss shows up on your statement as a percentage of the money you put up, not as a percentage of the contract. At 1:1, which is what a physical holder is whether they use the word or not, a 5 percent fall is a 5 percent loss. At 1:20 the same fall is a 100 percent loss, because you posted a twentieth of the value.
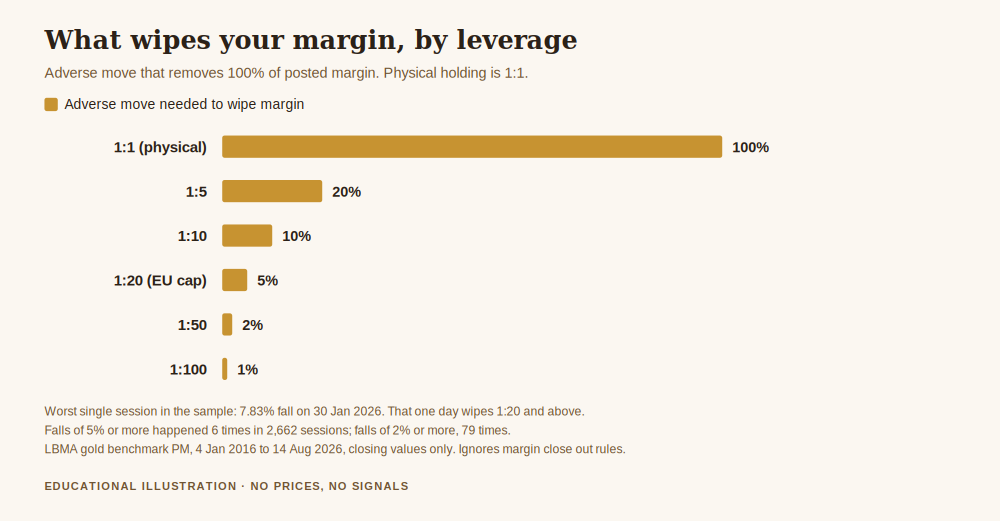
Put the other way round, here is the adverse move that takes the whole of your margin, by leverage:
- 1:5 needs a 20.000 percent move
- 1:10 needs a 10.000 percent move
- 1:20 needs a 5.000 percent move
- 1:50 needs a 2.000 percent move
- 1:100 needs a 1.000 percent move
- 1:500 needs a 0.200 percent move
Those are ceilings, and generous ones. I have ignored margin close out rules, which act earlier, and I have ignored the cost of the spread. Reality arrives sooner than this list says.
Now the question that makes the list mean something. How often has gold actually delivered moves of that size? I measured every session of the LBMA gold benchmark, afternoon fix, from 4 January 2016 to 14 August 2026. That is 2,663 published sessions and 2,662 steps between them.
The median absolute daily move is 0.4998 percent. Half of all days are smaller than that. It is a quiet market most of the time, and that is precisely the problem, because quiet markets are what convince people that high leverage is survivable.
Counting only the falls:
- a fall of 1 percent or more in one session happened 281 times, 10.556 percent of sessions
- a fall of 2 percent or more happened 79 times, 2.968 percent of sessions
- a fall of 3.33 percent or more happened 11 times, 0.413 percent of sessions
- a fall of 5 percent or more happened 6 times, 0.225 percent of sessions
- a fall of 7.5 percent or more happened once, 0.038 percent of sessions
The Session That Settles the Argument
The worst single session in the sample was a fall of 7.83 percent, on 30 January 2026. I want to sit on that number for a moment, because of what it does to the list above.
A 7.83 percent adverse move takes the entire posted margin of anyone at 1:20 or higher. Not most of it. All of it, with room to spare, in one session, without a gap, on a benchmark that publishes once a day.
Here is the part I find genuinely striking. Under the European regulator’s retail rules, the maximum leverage a retail client may be offered on gold is 20:1. That cap exists to protect people. And 20:1 is exactly the leverage that one real session in this sample would have wiped out completely. The legal maximum and the demonstrated danger line are the same number. Anyone trading gold above that cap, in a jurisdiction that permits it, is not taking a slightly larger version of the same risk.
The physical holder’s experience of 30 January 2026 was different in kind, not degree. Their holding was worth 7.83 percent less that evening. Nothing was closed, nothing was called, and the decision about what to do next remained theirs. That is the whole of the first difference, in one day.
Stretch the window and it gets starker. The deepest peak to trough fall on closing prices in the sample was 26.11 percent, from 29 January 2026 down to 16 July 2026. To still hold a leveraged position through that entire fall, without adding margin, you would have needed leverage below 1:3.83. Below four to one. The same regulator’s cap of 20:1 is five times too generous to survive the drawdown this market actually produced, and most retail gold trading happens well above the cap.
The physical holder rode it and, on the published benchmark, watched the level recover afterwards. The point is not that holding metal is clever. The point is that a drawdown and a liquidation are different events, and leverage is the thing that converts one into the other.
The Second Difference: What It Costs to Simply Keep Holding
This is the part that gets left out, and for a certain kind of position it does more damage than volatility ever does.
A long CFD is financed. The firm has effectively lent you the full contract value, and it charges for that every day, normally at a benchmark rate plus a markup. To put a real benchmark on it rather than an invented one, I used the Federal Reserve H.15 series, three month Treasury constant maturity, averaged over the 2,585 days of my sample that have a published value. That average is 2.34 percent per year.
Charged on the contract value, 2.34 percent sounds like nothing. Now express it as a share of the money you actually posted, which is the number that matters to you, at a benchmark plus 3 percent markup:
- at 1:1, carry costs 5.34 percent of your money per year
- at 1:5, 26.68 percent
- at 1:10, 53.35 percent
- at 1:20, 106.70 percent
- at 1:50, 266.76 percent
Read the 1:20 line again. At the European retail cap, at that financing rate, the carry alone consumes slightly more than your entire posted margin over a year. The market does not need to move at all. A position held open for twelve months at that leverage costs you more than you put up, purely in rent, and every percent the market gives you is being handed straight back before you see it.
This is why the honest answer to “should I hold a gold CFD for the long term” is not a matter of opinion. The instrument is built for short holding periods and it prices itself accordingly.
Where the CFD Is Genuinely the Cheaper Tool
I am not making the case for metal here, and it would be a poor article that only argued one way. Physical gold has a cost too, and it is front loaded: you pay a dealer’s buying spread going in and a selling spread coming out, plus storage or insurance if you are not keeping it somewhere unwise.
So there is a crossover, and it is calculable. Take a one off physical round trip cost, compare it to financing charged continuously on the same contract value, and ask how long the CFD takes to overtake it. At a benchmark plus 3 percent, which is 5.34 percent per year on my sample average:
- a 1 percent physical round trip is overtaken after about 68 days
- a 2 percent round trip after about 137 days
- a 3 percent round trip after about 205 days
- a 5 percent round trip after about 342 days
- an 8 percent round trip after about 548 days
You will have to put your own dealer’s numbers into that, because round trip costs vary enormously by product and by country and I am not going to invent a universal figure. But the shape of the answer holds: for a position measured in days or a few weeks, the CFD is usually the cheaper way to take the exposure. For a position measured in years, it is not close, and the gap widens every single day the position stays open.
Note also that leverage does not appear in that crossover calculation at all. Both costs are measured against the same contract value. Leverage changes what the carry costs you relative to your margin, and it changes what a bad day does to you, but it does not change the date on which financing overtakes a one off cost.
What This Does Not Say
Several things, and they matter enough to list.
It does not say physical gold is safe. A 26.11 percent peak to trough fall is a real loss to a physical holder too, just an unforced one. It does not say the sample predicts anything. Ten and a half years of a public benchmark is history, not a forecast, and the next worst session is not obliged to resemble the last one. It does not say CFDs are a scam, they are a tool with a stated cost that most users never convert into the units that would make the cost legible. And it does not say anything at all about which you should hold, because that depends on why you want the exposure and for how long, which I do not know.
What it does say is that the phrase “gold CFD vs physical gold” describes two positions with different failure modes. One can lose value. The other can lose value and be closed while it does. Those are not the same risk wearing different clothes.
Get the free Gold Empire survival sheet, a one page guide to sizing a leveraged gold position so that an ordinary bad session stays an ordinary bad session. One email, no spam, unsubscribe anytime.
Frequently Asked Questions
Is a gold CFD the same as owning gold?
No. It is a contract with a firm whose value tracks the gold price. You have exposure to the price without title to any metal, which is fine as long as you know that is what you bought and you have considered what happens if the firm fails.
Which is better for a beginner, gold CFD vs physical gold?
I would not frame it as better. They answer different questions. Metal answers “I want exposure and I will hold it”. A CFD answers “I want exposure for a short period and I am willing to post margin and pay rent for it”. The failure mode of the second is faster and less forgiving, which is worth knowing before rather than after.
Can I lose more than I put in with a gold CFD?
In jurisdictions with negative balance protection for retail clients, no, your loss is capped at the account. Elsewhere, or as a professional client, it is possible. Check which category you are in before it matters rather than during the session where it does.
Does the financing cost apply if I close the position the same day?
Normally financing is charged on positions held over the daily rollover, so a position opened and closed inside the day usually avoids it. That is exactly the usage pattern the instrument is designed around, and it is why the carry arithmetic above bites hardest on positions held for months.
Why measure everything in percentages instead of prices?
Because a percentage move does the same thing to any account size, and because quoting a gold price in an article that will be read for years is a good way to mislead somebody. The arithmetic here works identically whatever the level happens to be.
Where did the 7.83 percent figure come from?
I computed it myself from the published LBMA afternoon benchmark across 2,663 sessions between 4 January 2016 and 14 August 2026. It is the largest single session fall in that window, dated 30 January 2026. The full list of assumptions is in the disclaimer below.
Where Gold Empire Fits
Gold Empire is a free Telegram channel where I post gold analysis with the reasoning written down before the move rather than after it, losing days included. Nothing has to be bought to follow along, and there is an optional Kit later for people who want more structure. I make no profit claims and I do not rank brokers for payment.
The free survival sheet is the one page version of the sizing discipline that decides whether a 5 percent session is an inconvenience or an ending. If this piece was useful, what is leverage in gold trading takes the mechanism apart properly, the difference between gold and gold futures covers the third way of taking this exposure, and risk management for gold trading is where the sizing arithmetic lives.
About the author. Matthew writes Gold Empire. He is interested in the unglamorous half of this business, cost, size, frequency and the arithmetic of staying solvent, on the view that most accounts are lost to ordinary errors repeated patiently rather than to any single dramatic trade.
Disclaimer: This article is general educational content comparing two ways of taking exposure to the gold price. It is not financial advice, not a recommendation of any instrument, broker or product, and not a suggestion to open any particular position. Trading leveraged products carries a high risk of losing money rapidly. No entry, stop or target discussed should be treated as a signal. The price figures were computed by me from the published LBMA gold benchmark, afternoon fix, over the 2,663 published sessions from 4 January 2016 to 14 August 2026, using closing benchmark values only, with no intraday data, no dealing costs and no bid to offer spread. The financing figures use the Federal Reserve H.15 three month constant maturity yield averaged over the 2,585 sample days with a published value, plus a stated markup, charged on full contract value; the markup is an assumption for illustration and not a quote from any firm. Margin wipeout figures ignore margin close out rules that would act earlier, so they are the generous case. The leverage cap and retail client rules referenced are from ESMA and apply to retail clients in the European Union; your jurisdiction may differ. No gold price level is quoted anywhere in this article and no trading results are represented. Past behaviour of a public benchmark is not a prediction.
One step first
Where should we send the Gold Survival Sheet?
Leave your email and we will send the free one page checklist, then take you straight to the Telegram channel.
No cost and no obligation. Educational only, not financial advice, and nothing here promises a return. Unsubscribe any time in one click.
Leave a Reply