
If you have been trading gold through news events for any length of time, you have met the big three: inflation, payrolls and the Fed. GDP sits slightly outside that club, which is why people ask what is GDP in gold trading and then quietly skip it. It arrives less often, it moves gold less violently than a payrolls surprise, and it feels like something for economists rather than traders.
I want to make a narrower case for paying attention to it, and it is not the one you would expect. GDP is worth understanding less because of what it tells you about the economy and more because of what it tells you about the reliability of economic numbers in general. It is the clearest published example of a figure that markets react to instantly and that the issuing agency itself revises substantially afterwards.
Every figure below comes from the Bureau of Economic Analysis, which produces the number, or is worked out by me from BEA’s published figures with the assumption stated. There are no prices here and no forecasts.
What is GDP in gold trading, in plain terms
Gross domestic product is the total value of everything an economy produces in a period, reported in the United States as an annualised quarterly percentage change. Real GDP strips out inflation. Current-dollar GDP does not.
Gold has no earnings, no coupon and no dividend. Holding it costs you whatever you could have earned risk free instead. That is the whole mechanism, and everything else is downstream of it. So gold does not react to output as such. It reacts to what output implies about interest rates.
The chain runs like this. Strong GDP suggests an economy that can tolerate tighter policy, which argues for higher rates, which raises the opportunity cost of holding a metal that pays you nothing. Weak GDP argues the other way. GDP is therefore an input to the rate decision, and the rate decision is what gold is really pricing. If you want that chain laid out properly, the piece on what the FOMC is and why gold reacts covers the end of it.
This is also why GDP tends to move gold less than CPI or payrolls. By the time GDP is published, most of the quarter it describes has already been reported piece by piece through monthly data. The market has largely assembled the answer before the official total arrives.
One quarter, three different numbers
Here is the part most traders genuinely do not know, and it is the reason this article exists. BEA does not publish one GDP figure per quarter. It publishes three, and then keeps revising.
The advance estimate comes out near the end of the first month after the quarter ends. BEA is explicit that it rests on source data that are incomplete or still subject to change by the agencies supplying them. The second estimate follows near the end of the next month, and the third near the end of the month after that. Then annual updates, released in late September, revisit at least the five most recent years, and comprehensive updates roughly every five years rework methods and definitions.
So the number that hits your screen and moves the market is the advance estimate: the earliest, thinnest, least complete of the set. The one that will still be correct in five years is published long after anybody has stopped looking.
How much the first number actually moves
BEA publishes its own scorecard on this, which is a creditable thing for a statistical agency to do. Its comparison of revisions to real GDP, covering 1999 through 2023, gives the average revision to quarterly real GDP growth between each pair of estimates.
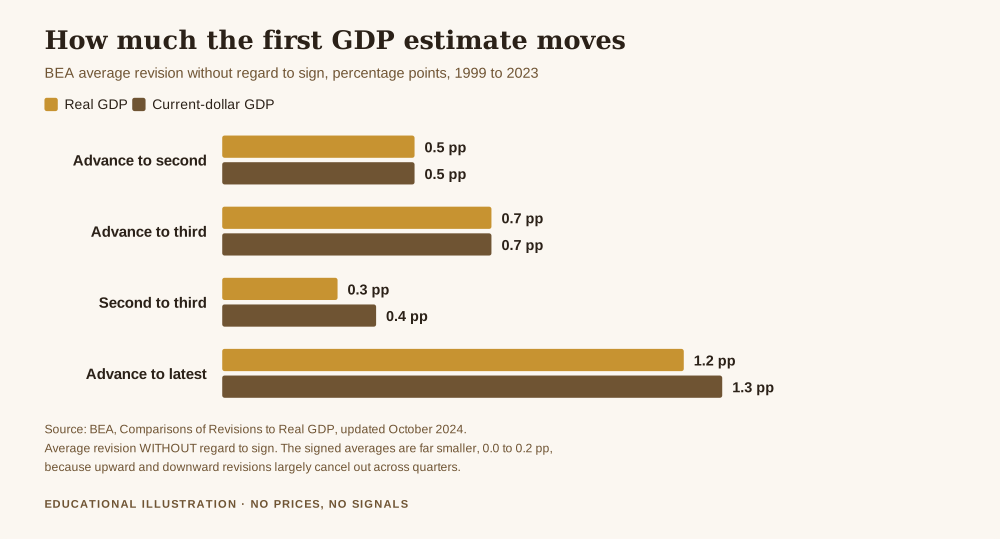
From advance to second, real GDP growth is revised by an average of 0.5 percentage points without regard to sign. From advance to third, 0.7 points. From advance to the latest estimate, after annual and comprehensive updates have done their work, 1.2 points. Current-dollar GDP behaves similarly, at 0.5, 0.7 and 1.3.
Two details in that table deserve more attention than they usually get.
First, the signed averages are tiny: 0.1 points from advance to second, 0.1 to third, 0.1 to latest. Revisions are not biased in one direction. They go up about as often as they go down, which is exactly why you cannot “trade the revision” by assuming the first print is systematically too high or too low. There is no free direction in it.
Second, most of the early correction lands quickly. The second to third revision averages only 0.3 points, which is 43 per cent of the advance to third figure, so the bulk of the near term repair happens at the second estimate rather than the third. The slow, large part comes much later, in the annual and comprehensive updates.
What that looks like next to the headline
A 0.7 percentage point revision sounds modest until you put it beside the number being revised.
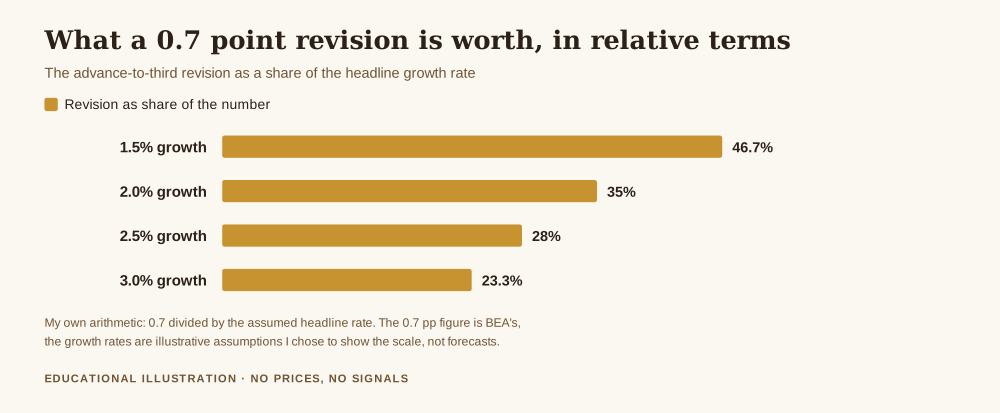
If the economy is growing at 2.0 per cent, a 0.7 point average revision is 35 per cent of the figure. At 2.5 per cent growth it is 28 per cent. At 1.5 per cent it is nearly half the number. I want to be clear that the growth rates there are illustrative values I picked to show the scale; only the 0.7 is BEA’s. But the point holds at any plausible rate: the typical revision is a large fraction of the headline, not a rounding adjustment.
Put plainly, the market reacts within milliseconds to a figure whose own producer expects to move it by roughly a third of its value.
What the advance estimate does get right
It would be lazy to stop there, because the same BEA document makes the case for the other side, and it is a strong one.
The direction of change between the advance and latest estimates matches 97 per cent of the time for real GDP. And the estimates correctly indicate whether growth is above, near or below trend 92 per cent of the time.
That is the honest resolution. The advance estimate is imprecise about magnitude and very reliable about direction. It is a good answer to “is the economy speeding up or slowing down” and a poor answer to “by exactly how much”.
Worth knowing what those percentages mean in practice. A 3 per cent direction failure is about one quarter in 33, or roughly one every eight years. The 8 per cent trend misclassification is about one quarter in 12 or 13, which is closer to one every three years. Those are my divisions of BEA’s percentages. Rare, but not never, and the one that goes wrong will not announce itself on the day.
Why the least settled number is the one that moves gold most
Now the structural problem, which is the real reason a gold trader should care.
Of the three estimates, the advance is the one the market trades. By the second estimate the surprise is largely priced, and the third barely registers. So the release that generates the most order flow, the widest spreads and the fastest moves is precisely the one built on the most incomplete data.
That is not a conspiracy. It is a scheduling fact with an uncomfortable consequence: you take your largest execution risk on the least reliable version of the number, and the correction arrives on a day when nobody is positioned for it.
I should say clearly what I cannot show you. I do not have execution quality data for gold around GDP releases, so I am not going to quote a spread widening figure or a slippage estimate. That the market moves around scheduled releases is well established and the general case is covered in how to trade gold through high impact news. The specific size of the effect at a GDP print is something I have not measured, and I would rather say so than put a number on it.
What actually protects you
The useful conclusion is not a strategy for trading GDP. It is a change in how much weight you let any single release carry.
If a number that its own publisher revises by an average of 0.7 points can decide whether your account survives the week, the problem is not the number. It is the size of the position standing in front of it. A revision of that scale is ordinary and expected. A position that cannot absorb an ordinary, expected event is simply too large.
So the order of operations is the same as everywhere else on this site: fix the sizing first, then worry about the calendar. A trader sized properly can be wrong about GDP and still be trading next month. A trader sized badly can be right and still not make it, because the move went the wrong way first. That argument in full is in risk management for gold trading, which is the piece everything else here sits on top of.
And if you want the two releases that do move gold harder than this one, they are CPI and nonfarm payrolls.
Get the free Gold Empire survival sheet, a one page guide to sizing a position so that a scheduled release stops being the thing that decides your month. One email, no spam, unsubscribe anytime.
Frequently asked questions
What is GDP in gold trading, in one sentence?
It is the total output of an economy, which matters to gold only because it feeds the interest rate outlook, and interest rates set the opportunity cost of holding an asset that pays you nothing.
Which GDP release should I watch?
The advance estimate, because that is the one the market trades. Just hold it loosely. It is the least complete of the three, and BEA revises it by an average of 0.7 percentage points by the third estimate and 1.2 points by the final version.
Does strong GDP always push gold down?
No, and anyone promising that relationship is overselling it. The usual logic is that strong growth supports higher rates and higher rates weigh on gold, but it depends entirely on what was already priced and on what the figure implies for the rate path rather than for growth itself. Strong GDP alongside falling inflation can read as good news for everything. The direction of the surprise relative to expectations matters far more than whether the number itself is high or low.
Why does GDP move gold less than CPI?
Because it is largely old news by the time it lands. The quarter it describes has already been reported through monthly data on retail sales, trade, construction and the rest, so the market has assembled most of the answer in advance. Inflation data arrives with much less of it already known.
If the first number gets revised so much, why does anybody trade it?
Because it is still the best available information at that moment, and because direction is what mostly matters. BEA’s own figures show the advance estimate gets the direction of change right 97 per cent of the time and places growth correctly against trend 92 per cent of the time. It is imprecise, not uninformative. The mistake is treating a figure that is reliable about direction as though it were precise about magnitude.
Where Gold Empire fits
Gold Empire is a free journal about surviving long enough in gold to get good at it. There is no signal service here, nothing is sold on a promise of returns, and I have no arrangement with any broker that depends on you opening an account. The free survival sheet is one page about position sizing, which is the lever that makes most of the other questions smaller. If you want the piece underneath all of it, read risk management for gold trading.
About the author. Matthew writes Gold Empire. He went looking for how far a GDP print typically gets revised, expecting to find nothing published, and instead found the agency’s own table saying the average correction is roughly a third of the figure everyone trades. He has treated first prints differently ever since. He is more interested in what survives a bad month than what wins a good one.
This article is educational and is not financial advice. Trading gold and leveraged products carries a substantial risk of loss and is not suitable for everyone, and no entry, stop or target discussed should be treated as a signal. The revision averages, the 97 per cent direction figure and the 92 per cent trend figure are quoted from the Bureau of Economic Analysis publication Comparisons of Revisions to Real GDP, updated October 2024, covering 1999 through 2023. The relative shares, the per quarter frequencies and the comparison between revision sizes are my own arithmetic from those published figures, with the illustrative growth rates labelled as assumptions in the text. Decide your own risk, and never trade money you cannot afford to lose.
One step first
Where should we send the Gold Survival Sheet?
Leave your email and we will send the free one page checklist, then take you straight to the Telegram channel.
No cost and no obligation. Educational only, not financial advice, and nothing here promises a return. Unsubscribe any time in one click.
Leave a Reply