
If you have been trading gold for more than a month, you have met the eight thirty problem. The chart is quiet, the spread is normal, and then at a fixed minute everything widens at once and your position is suddenly worth something different. Ask what is CPI in gold trading and most answers stop at the definition: it is the Consumer Price Index, a measure of inflation, published monthly by the Bureau of Labor Statistics. True, and almost useless. The definition tells you nothing about the part that actually empties accounts, which is how much a single print moves the number everyone is watching, and how little that one print tells you about the trend it is supposed to measure.
So this article does the arithmetic instead. I pulled the full monthly Consumer Price Index series, 955 observations running from January 1947 to August 2026, and measured the thing nobody measures: the size of the jump in the headline rate from one release to the next, and the gap between what a single month says and what the year actually says. The answers are not subtle, and they change how you should size risk around the calendar.
What is CPI in gold trading, in the only sense that matters
The Consumer Price Index tracks what a fixed basket of goods and services costs over time. The Bureau of Labor Statistics publishes it monthly, on a schedule set a year in advance, at a fixed time in the morning US Eastern time. Two versions matter to anyone watching a screen. The headline number includes everything. The core number strips out food and energy, on the argument that those two swing for reasons that have little to do with underlying inflation.
Gold cares because gold has no yield. It pays no coupon and no dividend, so what it competes against is the real return on cash and bonds, which is the nominal rate minus inflation. When inflation data shifts the market’s view of what the Federal Reserve will do with rates, it shifts the opportunity cost of holding a metal that pays nothing. That is the entire transmission mechanism, and it runs through expectations rather than through the index level itself.
Which is the first thing to understand. The CPI level is not news. It is published, it is known, and by the time you read it the market has already seen it. What moves price is the distance between the number and what the market had already priced. That distance is unknowable in advance, which is why the honest version of this article cannot tell you what to do at eight thirty, only what the distribution of outcomes looks like.
How much does one print actually move the headline rate
Here is the measurement that is missing from almost every explanation of this subject. Take the twelve month inflation rate, the figure quoted in every headline, and ask how much it changes from one monthly release to the next. Across the period since January 2000, which is 318 month to month comparisons:
- The median change in the twelve month rate is 0.238 percentage points.
- The mean change is 0.322 percentage points.
- The largest single month change is 2.631 percentage points.
- The rate moves by at least 0.1 points 79.9 per cent of the time, at least 0.2 points 58.5 per cent of the time, at least 0.3 points 40.9 per cent of the time, and at least 0.5 points 17.0 per cent of the time.
Read that last line again. Four times out of five, the headline inflation rate is a different number than it was a month ago. The thing that is reported as though it were a fixed fact about the economy is in practice a quantity that wobbles by a quarter of a point most months, and occasionally by much more. The market knows this, which is why the release is scheduled as a risk event rather than treated as a routine update.
One month is not the trend, and the gap is bigger than you think
Now the second measurement, and the more useful one. Take a single month’s change in the index and annualise it, which is what a commentator is doing when they say inflation is running at such and such a pace. Then compare it with the trailing twelve month rate over the same period. Since 2000, across 319 observations:
- The median gap between the one month annualised figure and the twelve month rate is 1.792 percentage points.
- The gap is at least 1 point 71.8 per cent of the time.
- The gap is at least 2 points 43.9 per cent of the time.
- The gap is at least 3 points 28.8 per cent of the time.
In other words, the story a single print tells disagrees with the story the year tells by more than a full percentage point in roughly seven months out of ten. The monthly standard deviation of the index change since 2000 is 0.3036 per cent, which annualises to 3.643 percentage points of noise around any single observation. One print is a noisy estimate of a slow variable, and the market reacts to it anyway, because the market is pricing the change in expectations rather than the truth about inflation.
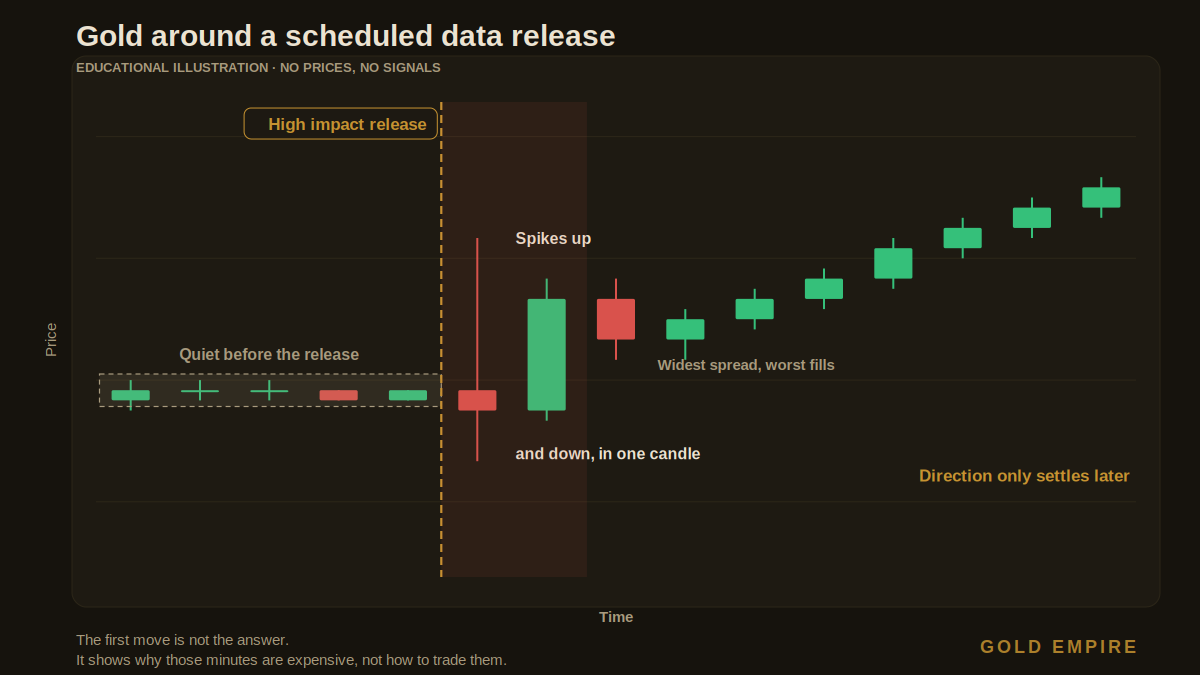
That distinction is the whole reason the first candle after a release so often reverses. The initial move prices the surprise. The minutes after it price the reconsideration of what the surprise actually means. Neither of those is a forecast you can make in advance, and no entry, stop or target discussed should be treated as a signal.
Headline against core, and why both get quoted
The headline and core measures disagree more than most people expect. Comparing the twelve month rates since 2000, the median absolute gap between them is 0.734 percentage points, and the headline figure sits above core in 56.1 per cent of months. As of the August 2026 data, the headline twelve month rate was 3.71 per cent and the core rate 2.76 per cent, a gap of about 0.95 points.
This matters operationally rather than philosophically. Two numbers arrive in the same instant, they frequently point in different directions, and different parts of the market weight them differently. That is part of why the first reaction to a release is often disorderly, and why the spread during that window is the widest it will be all day. You are not being singled out. The liquidity is genuinely thinner, because the people providing it do not know the fair price either until the dust settles.
The calendar is the part you can actually control
Here is the practical turn. You cannot forecast the print. You can know exactly when it lands, and that is a real edge over the version of yourself who gets surprised.
CPI is released twelve times a year. The Federal Reserve’s Open Market Committee met eight times in 2026, on 27 to 28 January, 17 to 18 March, 28 to 29 April, 16 to 17 June, 28 to 29 July, 15 to 16 September, 27 to 28 October and 8 to 9 December, with four of those meetings accompanied by the Summary of Economic Projections, according to the Federal Reserve’s published FOMC calendar. Add roughly twelve employment reports and you are looking at something in the order of thirty two scheduled high attention events in a year. That is about one every eleven days.
Thirty two days out of roughly two hundred and fifty trading days is not a small share of the year, and it is entirely knowable in advance. The survival question is not how to trade those days. It is whether you have decided, before the week starts, what your exposure looks like when one arrives. A position sized for a quiet Tuesday is a different position on a release morning, even though nothing about your analysis changed.
If you want the mechanics of the release window itself, the behaviour of spread and fills during high impact news is covered in more detail in how to trade gold through high impact news. The two other scheduled events in this family have their own pieces: what the FOMC is and why gold reacts, and what nonfarm payrolls means in gold trading. Taken together with this one, that is the full scheduled macro calendar a gold trader actually has to plan around.
What the data does not say
I want to be exact about the limits here, because this is the point where articles like this usually overreach.
Nothing above measures how gold responds to CPI. It measures how CPI itself behaves, which is a different and more reliable thing. I have not computed an average gold move on release days, and I would be sceptical of anyone who quotes you one without showing the method, because the answer depends enormously on the window you choose, the period you sample and how you handle the days when something else was also happening.
Nor does any of this tell you direction. A hot print does not mechanically send gold one way. The same number can be read as inflationary, which historically supports gold, or as something that will force higher rates, which raises the opportunity cost of holding it. Both readings are available in the same instant, which is precisely why the first move reverses so often.
The numbers in this piece come from the monthly Consumer Price Index for All Urban Consumers, seasonally adjusted, produced by the Bureau of Labor Statistics and retrieved from the Federal Reserve Bank of St Louis’s published CPIAUCSL series, together with the core series that excludes food and energy. Every percentage in this article was computed from that data rather than recalled, and the method is stated beside each figure so you can reproduce it.
How I would actually use this
Three things follow, and none of them is a trade.
First, put the release dates in whatever you plan your week in. Not to trade them, but so that no release is ever a surprise. The entire cost of being surprised is paid in the first sixty seconds, and it is avoidable for free.
Second, decide your release day exposure once, in advance, in writing, when nothing is happening. Deciding at eight twenty nine is not deciding, it is reacting, and the arithmetic above says you are reacting to a quantity that disagrees with its own twelve month trend by more than a point most of the time.
Third, stop treating a single print as information about the economy. It is one noisy observation of a slow moving variable, with a standard deviation that annualises to more than three and a half points. The twelve month rate is the signal. The monthly number is mostly the noise around it, and the market trades the noise because the noise is what is new.
That is the honest answer to what is CPI in gold trading. It is a scheduled, measurable, highly repetitive risk event, whose headline figure moves by at least a tenth of a point four times out of five, and whose monthly reading disagrees with its own annual trend by more than a point seven times out of ten. You cannot predict it. You can absolutely plan around it, and the planning is where the survival is.
Get the free Gold Empire survival sheet, a one-page guide to protecting your account through the kind of market this article describes. One email, no spam, unsubscribe anytime.
Frequently asked questions
What is CPI in gold trading, in one sentence?
It is the monthly Consumer Price Index release, a scheduled inflation measurement that moves gold indirectly by changing what the market expects from interest rates, and therefore the opportunity cost of holding an asset that pays no yield.
Does a high CPI number always push gold up?
No, and the assumption that it does has cost people a lot of money. A hot reading can be read as inflation, which has historically supported gold, or as a reason rates stay higher for longer, which works against it. Both interpretations compete in the same minute, which is one reason the first move after a release so frequently reverses.
How much does the inflation rate change between releases?
Since 2000 the twelve month headline rate has changed by a median of 0.238 percentage points from one month to the next, moving at least 0.1 points in 79.9 per cent of months and at least 0.5 points in 17.0 per cent of months. The largest single month change in that period was 2.631 points.
Should I close my positions before CPI?
That is a decision about your own risk tolerance and your own plan, not something an article can answer for you, and nothing here is a recommendation. What the data supports is narrower and more useful: the decision should be made in advance rather than in the minute before the release, because the release window is reliably where the spread is widest and the fills are worst.
Is core CPI more important than headline?
Neither is simply more important. They disagree by a median of 0.734 percentage points, and the headline sits above core in 56.1 per cent of months since 2000. Different participants weight them differently, which is part of why the immediate reaction to a release is often disorderly.
What Gold Empire actually does
Gold Empire is a free channel about surviving in gold rather than getting rich in it. There is no signal service here and nothing is sold on the promise of a return. The free Gold Survival Sheet is a single page on protecting an account through exactly the kind of week this article describes, and the only thing it asks for is an email address you can unsubscribe from. Everything else, including the risk management guide that sits underneath all of this, is simply published.
The model is deliberate. Follow along for free, read the arithmetic, and decide for yourself. If a piece of writing ever makes you feel you must act immediately, that is a reason to be suspicious of the writing, including mine.
About the author
Matthew writes Gold Empire. He spent long enough learning the expensive way that scheduled events are the cheapest risk to manage, because they are the only ones that announce themselves in advance, and he now writes the arithmetic down instead of relearning it. He has no interest in telling anyone where price is going. You can read more about the approach on the about page.
This article is educational and is not financial advice. Trading gold carries a high risk of losing money rapidly, and no entry, stop or target discussed should be treated as a signal. Figures are computed from the published Consumer Price Index series as described above and were accurate at the time of writing. Past behaviour of any data series is not a prediction of its future behaviour. Decide your own risk, and never trade money you cannot afford to lose.
One step first
Where should we send the Gold Survival Sheet?
Leave your email and we will send the free one page checklist, then take you straight to the Telegram channel.
No cost and no obligation. Educational only, not financial advice, and nothing here promises a return. Unsubscribe any time in one click.
Leave a Reply