
The difference between gold and gold futures is not really a difference in what you own. Both give you exposure to the same metal, priced off the same global benchmark, moving on the same news. The difference is a deadline and a bill. One of these positions has an expiry date printed on it and the other one does not, and one of them charges you for time in a way you can see while the other buries the same charge inside the price you paid. Traders who lose money on the distinction almost never lose it because they picked the wrong instrument. They lose it because nobody told them time was on the invoice at all.
This matters more than the usual comparison articles suggest, because the two products fail in different ways. A futures position can be perfectly correct about direction and still end because the contract ran out. A spot position can be perfectly correct about direction and still bleed out because it was held long enough for the financing to matter. Neither of those is a trading mistake in the ordinary sense. Both are structural, both are knowable in advance, and both are avoidable with about ten minutes of arithmetic.
What Each One Actually Is
Strip the marketing away and there are only a few moving parts.
Gold futures
A gold futures contract is a standardised agreement, traded on an exchange, to exchange a fixed quantity of gold at a fixed date in the future. Three features follow from that sentence and they are the whole story. It is standardised, so the quantity and the delivery terms are not negotiable and not chosen by your broker. It is exchange traded, so the counterparty risk sits with a clearing house rather than with the firm you opened an account with. And it expires, so the position has an end date that exists whether or not your idea has run its course.
The price you buy at is not the spot price. It is the spot price plus the cost of carrying gold to the delivery date, which is mostly interest, plus storage and insurance. That premium is not a fee anyone charges you. It is arithmetic, and it is already inside the number on the screen.
Spot gold, and the retail CFD built on it
Spot gold has no expiry. The retail product most people actually trade, a contract for difference on gold, is built to mirror spot and to roll indefinitely. You are not going to take delivery of anything. Your counterparty is the broker, not a clearing house, which is a genuine difference in who has to stay solvent for your position to be worth what your screen says.
Because there is no delivery date, there is no carry baked into the entry price. So the carry is charged separately, every day you hold, as a financing debit or credit. Different firms call it swap, rollover or overnight financing. It is the same economic thing that the futures premium represents, presented as a daily line item rather than as part of the purchase price.
That is the entire structural difference. One product charges you for time up front and hands you a deadline. The other charges you for time daily and hands you no deadline at all, which sounds like the better deal and is the reason people hold losing positions for months.
The Difference Between Gold and Gold Futures Shows Up in the Carry
Since the carry is the part nobody quotes, it is worth pricing rather than describing.
The dominant component is the risk free interest rate, because holding metal means having capital tied up in metal instead of earning interest. Take that rate from the source rather than from memory. The Federal Reserve’s H.15 release of selected interest rates puts the three month US Treasury constant maturity yield at 3.90% per year on its 6 August 2026 observation. That is a published number, updated continuously, and free.
From there the arithmetic is short. A three month carry at that rate is 3.90% multiplied by a quarter of a year, which is 0.9750% of the position’s value. Spread across calendar days, the same figure is 0.01068% per day. Over a full year it is simply 3.90%.
Two things need saying plainly about that number. First, it is a floor and not a full cost, because real forward pricing also reflects storage, insurance and lending terms in the metal itself, and the retail version adds a broker markup on top that varies by firm and is nothing to do with the Federal Reserve. Second, it applies to the whole notional value of the position, not to the margin you deposited. A trader with a small deposit controlling a large position pays the carry on the large number. That asymmetry is where the surprise usually lives.
How Often the Carry Actually Costs You the Trade
A cost only matters relative to what you are trying to earn, so I measured it against what gold actually did.
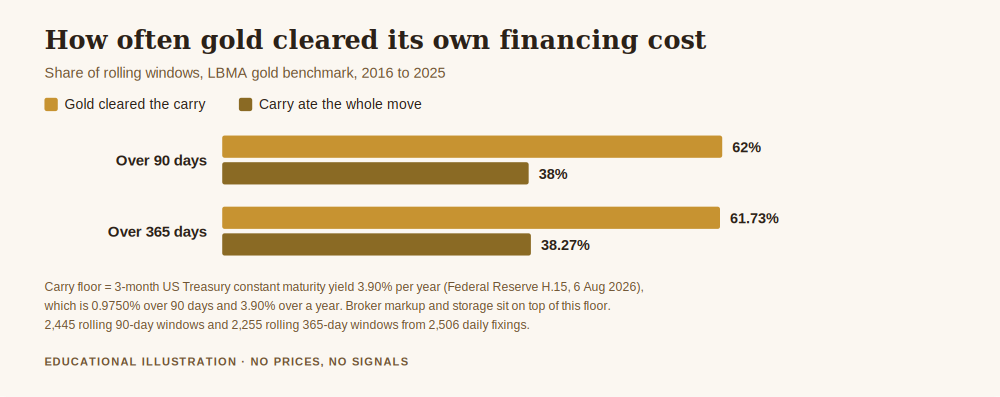
The test uses the published LBMA gold benchmark across the ten calendar years from 2016 to 2025, which is 2,506 daily fixings. For every fixing I looked forward ninety calendar days and asked a single question: did gold rise by more than the 0.9750% carry over that window? That gives 2,445 complete windows.
Gold cleared the carry in 1,516 of them, which is 62.00%. The median ninety day move was a gain of 3.287%, comfortably above the cost. So far the instrument looks cheap.
Now read the other side of the same sentence. In 38.00% of ninety day windows, the financing consumed the entire move and more. Nearly two windows in five. Stretch the horizon to a full year and the picture barely improves: across 2,255 rolling 365 day windows, gold beat the 3.90% annual carry 61.73% of the time, with a median twelve month gain of 8.666%.
The honest reading of those figures is not that carry is trivial because gold usually beats it. It is that gold beats it about six times in ten, in the strongest decade the metal has had in a generation. A directional view that is right slightly more often than a coin toss is not a strong enough view to fund a permanent daily charge, and a flat decade would turn every one of those percentages against you. This is also why the same holding cost that is a rounding error on a two day trade is a structural drag on a two year one.
Expiry Is a Deadline Your Idea Does Not Have
The futures side has a different problem, and it is the one that catches people who came from equities.
Contracts expire on a schedule set by the exchange, not by you. If your view needs another two months and the contract has three weeks left, you do not get to simply wait. You either close, take the contract into its delivery period, or roll into the next month by closing one contract and opening another.
Rolling is the normal choice and it is not free. Each roll pays the spread twice, once to exit and once to enter, and it re establishes the position at the next contract’s price, which contains its own fresh carry to its own later date. Roll four times a year and you have paid four sets of transaction costs and purchased the carry four times over. Nothing about that is hidden or unfair. It is simply a cost that a spot position presents to you as a small daily debit and a futures position presents as an occasional large one, and traders reliably underestimate the version that arrives in lumps.
The mirror image is worth stating too, because the spot product’s lack of a deadline is not purely a benefit. A position with no expiry is a position with no forced review. Futures impose a decision on a known date. Spot lets an unexamined trade sit for a year while the financing quietly accumulates, and there is no moment at which the market makes you look at it.
Where Leverage Turns a Cost Into a Failure
Both products are usually sold with leverage, and leverage does something specific to everything above: it leaves the carry attached to the full position while shrinking the capital that has to absorb it.
The arithmetic needs no prices at all. At 10:1, a 1.00% adverse move takes 10% of the margin you posted, and it takes a 10.00% adverse move to erase that margin entirely. At 20:1, the same 1.00% move takes 20%, and 5.00% wipes you out. At 50:1, one percent costs half your margin and 2.00% ends the position. At 100:1, a single 1.00% move against you is the whole of it.
Set that beside the carry figures. On a highly leveraged position the annual financing can exceed the deposit itself, which means a trader can be right about gold, hold patiently, and still be closed out by the accumulated cost of patience. Regulators have been blunt about the general outcome here, and the CFTC’s investor education material on leveraged retail products is worth the ten minutes it takes to read. For the version of this arithmetic applied to position size rather than instrument choice, what is leverage in gold trading works through it in more detail, and what is swap in gold trading covers the daily financing line specifically.
What This Comparison Is Not
Two misreadings are worth closing off.
This is not an argument that futures are better than spot, or the reverse. They are different shapes of the same exposure, and the right one depends on your holding period, your capital, your jurisdiction and what you are actually allowed to trade. A trader holding for two days is barely touched by carry and should care about spread. A trader holding for two quarters should care about carry more than almost anything else. The instrument follows the horizon, not the other way round.
It is also not a claim about what any particular broker will charge you. The carry figure above is built from a published government interest rate, and it describes the economic floor beneath both products. What you actually pay is that floor plus a markup set by a private firm and written in your contract specification. Only the floor is something I can show you honestly. The markup is something you have to read for yourself, and the fact that it is rarely displayed next to the leverage figure in any advertisement is itself informative.
Four Questions Before You Choose
None of this requires new software. It requires four answers.
How long do you intend to hold? Days, and carry is noise. Months, and carry is a main cost that belongs in the plan before entry, not in a surprise on the statement.
Do you know your financing rate? Not the leverage, not the spread, the actual overnight rate on the product you are trading, in your account, for a long position. If you cannot find it in under five minutes, that is the answer to a different and more important question.
What ends the position if you do nothing? For futures it is an expiry date you can look up today. For spot it is a margin level you can calculate today. Both are knowable now and neither should be discovered later.
Who is your counterparty? A clearing house and a retail broker are not the same promise. This does not make one product safe and the other dangerous. It makes them different risks, and knowing which one you hold is part of knowing what you own.
Get the free Gold Empire survival sheet, a one page guide to knowing what a position costs you to hold before you open it rather than after. One email, no spam, unsubscribe anytime.
Frequently asked questions
In one line, what is the difference between gold and gold futures?
Gold futures are a dated exchange traded contract whose price already contains the cost of carrying metal to a fixed expiry, while spot gold and the retail products built on it never expire and charge that same carry as a daily financing line instead. Same exposure, different deadline, different place on the invoice.
Which one is cheaper to hold?
Neither is inherently cheaper, because both are paying for the same thing. Futures bundle the carry into the entry price and add transaction costs each time you roll. Spot spreads it across daily debits with a broker markup on top. Over a short horizon the roll costs dominate and spot often works out cheaper; over a long horizon the daily markup compounds and futures often do. The horizon decides it, not the label.
Where does the 3.90% carry figure come from?
From the Federal Reserve’s H.15 selected interest rates release, three month US Treasury constant maturity yield, observation dated 6 August 2026. The link is above. A three month carry is that rate times 0.25, which is 0.9750% of position value, or 0.01068% per calendar day. It is a floor, since storage, lending terms and any broker markup sit on top of it.
How were the 62.00% and 61.73% figures calculated?
From the LBMA gold benchmark, 2,506 daily fixings across 2016 to 2025. For every fixing I measured the move ninety calendar days later, giving 2,445 windows, and counted those exceeding the 0.9750% quarterly carry: 1,516, or 62.00%. The same method over 365 days gives 2,255 windows and 1,392 clearing the 3.90% annual carry, which is 61.73%. The source is linked so you can rebuild it.
Does the carry disappear if I am short?
Usually the sign flips rather than the cost vanishing, so a short position can receive financing instead of paying it. Do not treat that as free income. The rate you receive is generally worse than the rate you pay on the same product, the difference is the firm’s margin, and a position held for the financing rather than for the view is a position with no exit criteria.
Do gold ETFs solve this?
They move the cost rather than removing it. A physically backed fund charges an annual management fee that covers storage and administration, which is the same carry appearing under a third name. What changes is the leverage: a fund bought with cash cannot produce a margin call, which is a meaningful difference in failure mode rather than in cost.
I only hold for a day or two. Can I ignore all of this?
Largely yes, on cost. At 0.01068% per day the financing floor on a two day hold is negligible next to the spread. What you cannot ignore is the expiry question if you are in futures, and the counterparty question in either. Those do not scale with holding time.
Where This Leaves You
The choice between these two products is usually presented as a question about sophistication, as though futures were the grown up version and spot the beginner’s. That framing is not useful and it is not true. The real question is much narrower: how long do you intend to hold, and have you priced what holding costs?
Answer that and the instrument mostly picks itself. Fail to answer it and you will discover the answer anyway, in the form of a financing line you did not budget for or an expiry you did not diarise. The market is indifferent to which. Both endings look identical on a statement, and both are entirely preventable with a number you can look up in a minute and a date you can write down today.
Where Gold Empire Fits
Gold Empire is a free Telegram channel where I post gold analysis with the reasoning stated before the move rather than after it, losing days included. There is nothing to buy in order to follow along, and an optional Kit if you want more structure later. I publish no profit claims and I do not rank brokers for payment.
The free survival sheet is the one page version of the cost discipline described here. If you want the neighbouring mechanics, risk management in gold trading is the piece everything else hangs off, and what is the spread in gold trading covers the cost you pay on the way in rather than the one you pay for waiting.
About the author. Matthew writes Gold Empire. He is interested in the unglamorous half of this business, cost, size, frequency and the arithmetic of staying solvent, on the view that most accounts are lost to ordinary errors repeated patiently rather than to any single dramatic trade.
Disclaimer: This article is general educational content about how two instrument structures differ. It is not financial advice, not a recommendation of any broker, product, instrument or method, and not a suggestion to open any particular position. Trading gold, futures, CFDs and leveraged products carries a high risk of losing money rapidly. No entry, stop or target discussed should be treated as a signal. The 3.90% financing rate is the published three month US Treasury constant maturity yield from the Federal Reserve H.15 release dated 6 August 2026, used as a transparent floor for the cost of carry; it is not a quote for any broker’s financing charge, which is set privately and will be higher. The 2.00 percentage point markup mentioned in relation to retail pricing is an illustrative assumption, not a rate offered by anyone. All frequency figures are computed from the published LBMA daily gold benchmark over 2016 to 2025, describe the behaviour of that public benchmark rather than any account, and the sources are linked so you can verify them. Past behaviour of a benchmark is not a prediction. No gold price is quoted anywhere in this article and no real trading results are represented.
One step first
Where should we send the Gold Survival Sheet?
Leave your email and we will send the free one page checklist, then take you straight to the Telegram channel.
No cost and no obligation. Educational only, not financial advice, and nothing here promises a return. Unsubscribe any time in one click.
Leave a Reply