

If you have ever stared at a gold chart and felt like the price was moving at random, you are not alone. Most people who open a chart for the first time see noise. They see a wall of green and red candles and no obvious reason for anything. The good news is that gold is not random. Price moves in a rhythm, and once you can read that rhythm, the chart starts to make sense. That rhythm has a name. It is called market structure, and it is the first thing I look at every single session before I even think about a trade.
Market structure is not a secret indicator or a paid tool. It is simply the pattern of highs and lows that price leaves behind as it moves. Learn to read it and you will always know one thing that most beginners never know: which side the market is currently favouring. That single piece of information keeps you out of more bad trades than any signal ever will.
What market structure actually means
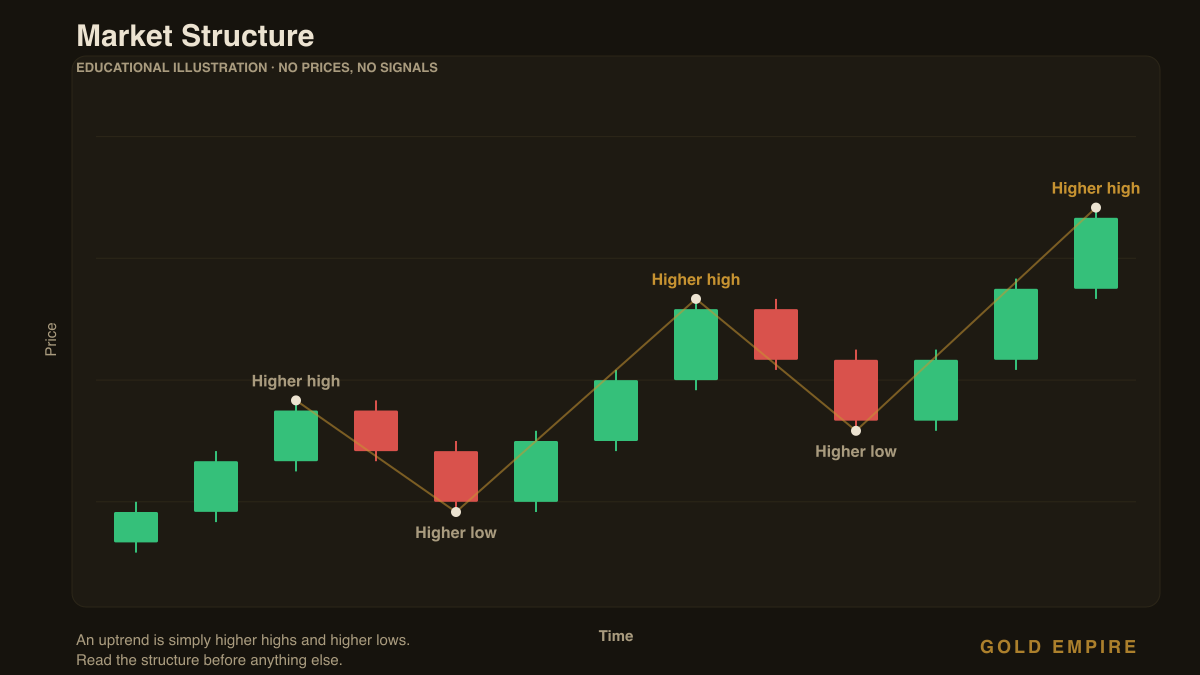
Every trend, up or down, is built from two things: swing highs and swing lows. A swing high is a peak where price turned down. A swing low is a valley where price turned up. Market structure is just the relationship between those peaks and valleys over time.
When gold is climbing, it does not go straight up. It pushes up, pulls back a little, then pushes up again. If each new peak is higher than the last, and each pullback stops at a higher point than the previous one, you are looking at a series of higher highs and higher lows. That is the definition of an uptrend. Nothing more complicated than that.
When gold is falling, you see the mirror image: lower highs and lower lows. Each bounce fails a little sooner, and each drop goes a little deeper. That is a downtrend. And when the market is doing neither, when highs and lows are roughly level and price is chopping sideways, that is a range. Three states, and every gold chart you will ever open is in one of them on any given timeframe.
Why higher highs and higher lows matter so much
Here is the part that changed how I trade. The direction of structure tells you where the pressure is. If price keeps making higher lows, it means buyers are stepping in earlier and earlier on every dip. They are not waiting for a discount anymore. That is a market where demand is winning, and fighting it by looking for shorts is like swimming against a current.
The opposite is true in a downtrend. Lower highs mean sellers are getting more aggressive, unloading sooner on every bounce. Trying to catch the bottom in that environment is one of the fastest ways I know to bleed an account.
You do not need to predict anything. You just read what is already there. Are the lows getting higher, or lower? That question, asked honestly, filters out a huge number of trades that feel tempting but sit on the wrong side of the market.
The break of structure: when the story changes
Trends do not last forever, and market structure is also how you spot the change early. As long as gold keeps printing higher highs and higher lows, the uptrend is intact. The moment price drops below the most recent higher low, something has shifted. That event is called a break of structure, and it is a warning that the buyers who were defending that level have stepped aside.
A break of structure does not guarantee a full reversal. Sometimes it is just a deeper pullback before the trend resumes. But it is the first clue that momentum is changing hands, and it is a signal to tighten up, not to add risk. I treat a break of structure the way a driver treats a yellow light: not a reason to panic, but a reason to slow down and pay attention. If you want to go deeper on this one event, we wrote a full piece on what a break of structure means in gold trading.
Timeframes tell different stories
This is where a lot of beginners get confused, so it is worth being clear. Gold can be in an uptrend on the daily chart and a downtrend on the 15 minute chart at the same time. Both are true. They are just different zoom levels of the same market.
The way I handle it is simple. I let the higher timeframe set the direction, and I use the lower timeframe for timing. If the daily and the four hour structure are both making higher highs and higher lows, I am only interested in buying pullbacks. I ignore the short term wobbles that scream “sell” on the five minute chart, because they are noise inside a bigger uptrend. When the higher and lower timeframes disagree badly, that is usually a sign to stand aside until they line up. Reading a chart with that kind of patience is a skill in itself, and it pairs well with keeping a clear head when you read a gold chart.
Before you place another trade
Structure keeps you on the right side of the market. Risk management keeps you in the game long enough to use it. Grab our free one page Survival Sheet, the same risk checklist I run before every session.
Download the free Survival Sheet › or join the Gold Empire community on Telegram ›
How to actually use structure in a session
Reading market structure is not about drawing dozens of lines until the chart looks like a spider web. Keep it plain. Here is the routine I run, and you can copy it exactly.
- Mark the last few swing highs and lows. Just the obvious ones. If you have to squint to see a swing, it is not important yet.
- Name the trend out loud. Higher highs and higher lows means up. Lower highs and lower lows means down. Flat and messy means range, and a range means smaller size or no trade.
- Trade with the structure, not against it. In an uptrend, look to buy pullbacks into a higher low, not to short every little peak.
- Respect the break. If price breaks the last protected low or high, the trend you were trading is on notice. Do not marry the old idea.
That is genuinely it. Market structure is one of the few tools that gets more powerful the simpler you keep it. The traders who struggle are usually the ones adding more indicators on top, not the ones reading the highs and lows in front of them.
A word on the emotional side
There is a quiet benefit to reading structure that nobody talks about. It gives you permission to do nothing. When the market is in a messy range with no clear higher highs or lower lows, structure tells you plainly: there is no edge here right now. That is not a failure. That is information. Some of the best sessions I have ever had were the ones where I read the chart, saw no structure worth trading, and closed the laptop. Protecting your capital on a bad day is how you stay around for the good ones. That mindset is the whole foundation of our approach to risk management in gold trading.
Get the free Gold Empire survival sheet, a one-page guide to protecting your account through the kind of market this article describes. One email, no spam, unsubscribe anytime.
Frequently asked questions
Is market structure the same as support and resistance?
They are related but not identical. Support and resistance are horizontal price levels where the market has reacted before. Market structure is the sequence of highs and lows that shows the trend’s direction. The two work well together: structure tells you which way to lean, and support or resistance tells you where price might react along the way.
What timeframe is best for reading market structure in gold?
There is no single best timeframe. The professional habit is to read structure on a higher timeframe first, such as the daily or four hour, to set direction, then drop to a lower timeframe like the one hour for timing. Gold moves fast, so leaning on the higher timeframe keeps you from getting shaken out by noise.
Can market structure predict where gold will go next?
No, and be careful with anyone who says it can. Structure describes what has already happened and what side is currently in control. It stacks the odds, it does not remove them. Every trade still needs a stop and a sensible position size, because the market can always break structure and surprise you.
How many swing points do I need to confirm a trend?
As a rough guide, two higher highs and two higher lows are enough to say an uptrend is in place, and the mirror for a downtrend. One swing is not a trend, it is a move. Waiting for that second confirmation keeps you out of a lot of false starts.
About the author
Matthew is the founder of Gold Empire and has spent years trading gold through every kind of market, from quiet summer ranges to violent news driven swings. He writes here as a working trader sharing the way he actually reads a chart, not as a guru with a shortcut to sell. His focus is always the same: protect the account first, keep the process boring, and let structure do the heavy lifting. He would rather you understand one idea deeply than collect a hundred you never use.
Disclaimer: This article is for educational purposes only and is not financial advice. Trading gold and other leveraged products carries a high risk of loss and is not suitable for everyone. Nothing here is a recommendation to buy or sell, and no entry, stop or target discussed should be treated as a signal. Past performance does not guarantee future results. Always trade with money you can afford to lose and consider speaking with a licensed financial professional about your own situation.
One step first
Where should we send the Gold Survival Sheet?
Leave your email and we will send the free one page checklist, then take you straight to the Telegram channel.
No cost and no obligation. Educational only, not financial advice, and nothing here promises a return. Unsubscribe any time in one click.
Leave a Reply