
The question is it better to buy physical gold or gold stocks gets asked as though the two things are the same asset in different packaging, one of them simply more convenient than the other. They are not. A bar of gold and a share in a gold mining company are different kinds of thing entirely, and the difference is not convenience or storage. It is that one of them has a cost line and the other does not.
That single structural fact explains almost everything people find surprising about gold equities, including the part that catches out most newcomers, which is that a gold share can fall on a day when gold rises. If you understand where the cost line sits, that stops being a mystery and becomes arithmetic.
What You Actually Own in Each Case
Hold physical gold and you own a quantity of metal. Its value moves one for one with the price of that metal, less whatever you paid to acquire and store it. There is no management, no payroll, no diesel bill and no mine that might flood. There is also nothing that can turn a 10 per cent move in gold into a 30 per cent move in your position. What the metal does, you get.
Hold a gold mining share and you own a slice of a business whose product happens to be gold. That business digs metal out of the ground at a cost, sells it at the prevailing price, and keeps the difference. You own the difference, not the metal. You also own everything else that comes with a company: the debt, the jurisdiction the mine sits in, the quality of the management, the share count, and the possibility that any of those change without the gold price moving at all.
Gold Empire is mostly about leveraged trading rather than long term holding, so I want to be clear why this matters here. The reason is that traders who move from trading gold to owning gold equities usually assume they are taking less risk, because equities feel tamer than a leveraged position. On the numbers below, that assumption is frequently wrong, and it is wrong in a way that only shows up once you are holding it.
The Cost Line, and Why the Industry Publishes It
Mining companies report a standardised figure called all-in sustaining cost, usually shortened to AISC. It is designed, in the World Gold Council’s own words, to better reflect the full cost of keeping the mine in business, which means it includes not just digging the metal out but the ongoing capital needed to keep doing so next year.
The World Gold Council publishes a quarterly series of the global average AISC of gold production, running from 2012 and updated alongside the Metals Focus Gold Mine Cost Service. You can see the all-in sustaining cost data on Goldhub directly, and the numbers in that series are worth reading slowly.
In the first quarter of 2012, the global average AISC was US$926.78 an ounce. In the first quarter of 2026, the most recent quarter in the series as of 31 March 2026, it was US$1,785.49 an ounce. That is a rise of 92.7 per cent over fourteen years, a compound rate of 4.80 per cent a year. Narrow the window and it is sharper still: the first quarter of 2021 sat at US$1,058.59, so the cost of producing an ounce climbed 68.7 per cent in five years.
Note what this figure is and is not. It is a cost of production, not a gold price, and nothing in this article quotes a gold price. But it is the number standing between the metal price and the shareholder, and it has been moving, upward, for over a decade.
Is It Better to Buy Physical Gold or Gold Stocks for a 10 Per Cent Move?
Now the arithmetic, and it needs no price level at all, only the relationship between the selling price and the cost.
Suppose a producer sells its metal at some multiple of its all-in sustaining cost. Call that multiple m. Its gross margin per ounce is the price minus the cost, which is (m minus 1) times the cost. Now move the metal price by 10 per cent and ask what happens to that margin. The answer falls out of the formula: the margin changes by 0.1m divided by (m minus 1).
Run it at four assumptions:
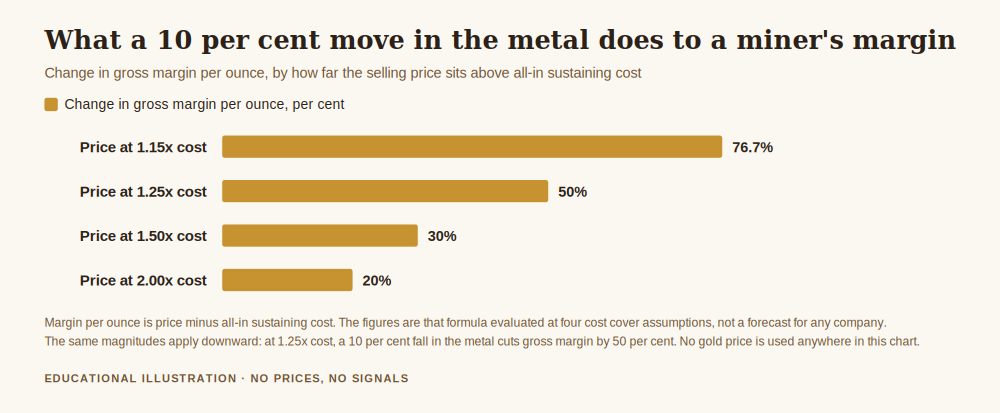
- At a price 1.15 times cost, a margin of 13 per cent on revenue, a 10 per cent move in the metal moves the gross margin 76.7 per cent. An amplification of 7.7 times.
- At 1.25 times cost, a 20 per cent margin, the move is 50 per cent. Amplification of 5 times.
- At 1.50 times cost, a 33 per cent margin, the move is 30 per cent. Amplification of 3 times.
- At 2.00 times cost, a 50 per cent margin, the move is 20 per cent. Amplification of 2 times.
Two things are worth saying plainly about that table.
The first is that this is exactly what leverage looks like, arriving through the income statement rather than through a margin account. A trader who would never open a five times leveraged position on gold may cheerfully buy a miner priced at 1.25 times its production cost, which delivers a similar amplification of the metal’s move into the thing they actually own. Nobody calls it leverage because no broker is lending anything. The mechanism is different, the arithmetic is not.
The second is that it runs both ways, and this is where people get hurt. At 1.25 times cost, a 10 per cent fall in the metal cuts the gross margin by 50 per cent. The same producer, the same mine, the same tonnage, half the margin. The amplification is not a feature that only operates in your favour, and the tighter the margin, the more brutal the effect. A producer at 1.15 times cost loses 76.7 per cent of its gross margin on a 10 per cent decline in gold.
The Costs Do Not Stand Still Either
Here is the part the amplification table hides, because it treats cost as fixed while the price moves. Over any real holding period, it is not.
Go back to the AISC series. A mine operating at the Q1 2012 global average that now operates at the Q1 2026 average would need its selling price to be 1.93 times what it was, just to hold the same absolute margin per ounce. Not to grow the margin. To stand still.
The person holding physical metal has no equivalent line in their accounts. Their ounce did not get more expensive to produce, because they are not producing it. This is the structural asymmetry at the heart of the comparison, and it is why gold equities and gold do not track each other over long periods even though they are driven by the same commodity.
Supply gives you a sense of how slowly the other side moves. In the second quarter of 2026, according to the World Gold Council’s Gold Demand Trends, mine production was 965.6 tonnes, up 2 per cent year on year. Mine output barely moves. A company cannot dig its way out of a cost problem at any speed that would help you.
The Risks That Have Nothing to Do With Gold
Everything above assumes the only thing that changes is the metal price and the cost of getting it out. A share carries more than that.
It carries dilution, because a company that needs capital can issue more shares, and your claim on the margin gets smaller without the margin changing. It carries jurisdiction, because a mine sits in a specific country with specific tax and permitting rules that can be rewritten. It carries operational risk, because a single mine can flood, a grade can disappoint, a strike can stop production. It carries the equity market itself, which means that on the day everything falls together, your gold exposure can fall with it because it is priced in a stock market rather than a metals market.
None of these are arguments against owning gold equities. They are arguments against owning them while believing you own gold. Those are different positions with different failure modes, and the failure mode is the thing I care about.
So Which One
The honest answer is that they do different jobs, and the question is what job you want done.
If the job is to hold a store of value that moves with the metal and cannot be diluted, mismanaged or nationalised out from under you, that is what physical gold does, and paying storage is the price of that property. If the job is to take a geared position on the gold price with the gearing supplied by a business rather than a broker, that is what a gold equity does, and the amplification table above is the specification you are buying, in both directions.
What neither of them is, is the other one with better logistics. The most expensive version of this decision is the one made by somebody who wanted the first job done and bought the second thing because it was easier to buy.
Get the free Gold Empire survival sheet, a one-page guide to working out what a position actually exposes you to before you take it. One email, no spam, unsubscribe anytime.
Frequently Asked Questions
Is it better to buy physical gold or gold stocks if I want exposure to the gold price?
Physical tracks the metal one for one. A gold equity gives you an amplified, two way version of the same move, and the amplification depends on how far the selling price sits above production cost. At 1.25 times cost, a 10 per cent move in gold becomes a 50 per cent move in gross margin, upward or downward.
Why do gold stocks sometimes fall when gold rises?
Because you own the margin, not the metal, and the margin has two sides. Costs can rise faster than the price, a company can dilute, a mine can underperform, and the whole equity market can drag a share down regardless of what the commodity did that day.
Are gold miners a form of leverage?
In effect, yes, though nobody is lending you anything. The gearing comes from the gap between price and production cost rather than from a margin account. The arithmetic looks very similar, and it is worth treating the position with the same caution you would give any geared exposure.
Does a rising all-in sustaining cost mean miners are a bad investment?
Not on its own, because the selling price moves too. It does mean the margin is a moving target rather than a fixed property of the business, and that a company standing still on cost control is falling behind. The global average AISC rose 92.7 per cent between the first quarter of 2012 and the first quarter of 2026.
Where did the numbers in this article come from?
The all-in sustaining cost figures are from the World Gold Council’s quarterly AISC series on Goldhub, as at 31 March 2026, and the mine production figure is from its Gold Demand Trends for the second quarter of 2026. Both are linked above. The amplification percentages are the formula 0.1m divided by m minus 1, evaluated at four stated assumptions about how far the selling price sits above cost. They illustrate a relationship and are not a forecast for any company. No gold price level is quoted anywhere in this article.
Where Gold Empire Fits
Gold Empire is free to follow. Daily XAU/USD analysis on Telegram, with the reasoning stated before the trade rather than after it, losing days included. There is a free survival sheet for anyone who wants the capital protection material in one place, and an optional Kit for people who want the full method. Nothing here promises a profit and nothing here is a signal service.
The pillar this sits under is risk management for gold trading, the wrapper comparison is in gold ETF vs physical gold returns, and the failure mode of a geared position is covered in gold CFD vs physical gold. More about who writes this is on the about page.
About the author. Matthew writes Gold Empire and spends most of his attention on the boring mechanics that decide whether an account is still open in two years. He has a long standing habit of reading cost disclosures before price charts, on the grounds that the cost line is the part nobody puts in the marketing. Nothing in this article is a recommendation to trade, and no entry, stop or target discussed should be treated as a signal.
Disclaimer: This article is general educational content about the structural differences between holding physical gold and holding shares in gold mining companies. It is not financial advice, not investment advice and not a recommendation to buy, sell or hold any instrument, product or company. Production costs, company accounts and tax rules change, so verify current details with primary sources before acting. Figures are taken from the stated public sources or are simple arithmetic on clearly stated assumptions, not predictions or performance claims. Trading leveraged products carries a substantial risk of loss and most retail accounts lose money.
One step first
Where should we send the Gold Survival Sheet?
Leave your email and we will send the free one page checklist, then take you straight to the Telegram channel.
No cost and no obligation. Educational only, not financial advice, and nothing here promises a return. Unsubscribe any time in one click.
Leave a Reply