
Most people asking how to see gold chart in TradingView want a two minute answer, and there is one. Type XAUUSD into the symbol box, press enter, and a chart appears. Done. The trouble is that the chart which appears is one of several different gold charts the platform can show you, they do not all say the same thing, and almost nobody checks which one they landed on.
That sounds pedantic until you realise what it costs. You size a position using the volatility you see on the screen, but you get filled on a feed that belongs to your broker, and if those two are not the same thing, your risk calculation was built on someone else’s data. So I want to cover the two minute answer properly, and then spend the rest of this on the part that actually protects an account.
How to See Gold Chart in TradingView, Step by Step
Open the platform and click the symbol box at the top left, where the current instrument name sits. Type gold, or XAUUSD, and wait for the dropdown to populate.
Here is the first thing worth noticing. You will not get one result. You will get a list, and each entry has a small provider name attached to it on the right hand side. Some of those entries are spot gold quotes contributed by different liquidity providers. Some are futures contracts with expiry months attached. Some are contracts for difference offered by individual brokers. Some are gold priced in other currencies entirely.
Pick one and the chart loads. To keep it, click the star to add it to a watchlist, then set the timeframe from the toolbar. That is the mechanical answer, and if that is all you came for, you now have a gold chart.
But scroll that dropdown list again before you move on, because the length of it is the actual lesson. There is no single instrument called gold. There is a family of related instruments, and knowing which branch of that family you are looking at is the difference between analysis and guesswork.
The Three Different Golds You Might Be Looking At
Spot gold is a quote for metal for immediate settlement, traded over the counter between large institutions rather than on an exchange. When a platform shows XAUUSD without a broker name attached, it is usually an aggregate of contributed quotes. It has no expiry and no central order book, which means there is no single authoritative version of it. Two providers can show slightly different spot gold at the same instant and neither is wrong.
Gold futures are exchange traded contracts for delivery at a set date. The US Commodity Futures Trading Commission’s weekly Commitments of Traders report for the COMEX division lists the benchmark gold contract under code 088691, and states its unit in capitals directly under the column headings: contracts of 100 troy ounces. A futures chart trades at a different level from spot because it carries the cost of holding metal to the delivery date, and that difference narrows as expiry approaches. A futures chart is not a spot chart with a different skin.
Your broker’s CFD is a third thing again. It is priced off the first two, with your broker’s own spread applied, and possibly a financing charge for holding it overnight. This is almost certainly what you are actually trading, and it is the only one of the three that determines what price you get filled at.
There is a fourth reference that is not a chart at all but is worth knowing about, because it is what the industry settles against. The London Bullion Market Association runs an auction that produces a published benchmark twice each trading day, and those LBMA precious metal prices are used for valuation and settlement worldwide. Two fixed prints per day, not a continuous line.
Why the Chart You Choose Has to Match the Account You Trade
This is the survival point, and it is simple enough to state in one sentence: analyse on the instrument you trade, or accept that your levels are approximations.
If you mark a level on an aggregated spot chart and place an order on your broker’s CFD, the two are near each other but not identical. Most of the time the difference is small enough to ignore. The times it is not small are precisely the times it matters most, which is at the week’s open, around major data releases, and in thin liquidity, exactly when a stop is most likely to be tested.
The practical fix takes one minute. If your broker publishes a feed on the platform, chart that. If it does not, chart the closest available and know that you are working with a proxy. Either way, place the order on your platform and look at the fill you actually received rather than the price you expected. Keeping a record of that difference is one of the cheapest habits in this business, and it is part of what I mean by tracking your trades properly.
What the Chart Does Not Draw
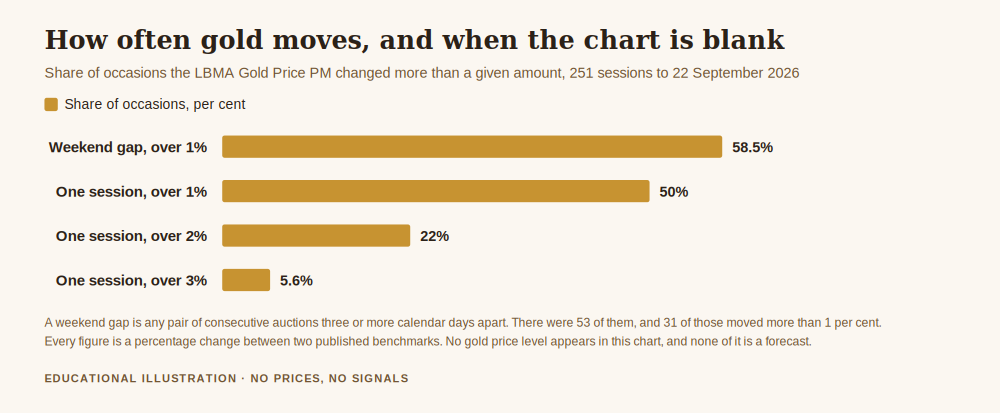
Here is the part that does not show up in any tutorial, and it is the reason for the chart above.
A gold chart looks continuous. It is not. The market closes for the weekend, and during that closure the world keeps happening. To put a size on what that means, I took the LBMA Gold Price PM benchmark, which is a published reference rather than any broker’s feed, over the twelve months to 22 September 2026. There were 251 auction sessions in that period, and 250 session to session changes to measure.
- The median absolute change between consecutive sessions was 1.00 per cent, and the mean was 1.29 per cent.
- 125 of the 250 changes, exactly 50.0 per cent, exceeded 1 per cent.
- 55 of them, 22.0 per cent, exceeded 2 per cent.
- 14 of them, 5.6 per cent, exceeded 3 per cent. The largest single change was 7.83 per cent.
Now isolate the weekend. I counted every pair of consecutive auctions three or more calendar days apart, which captures weekends and holiday closures. There were 53 of them. Their median absolute change was 1.14 per cent, slightly larger than an ordinary session, and 31 of the 53 exceeded 1 per cent, which is 58.5 per cent of them against 50.0 per cent for sessions generally. The largest weekend change was 5.36 per cent.
Read that back. The stretch your chart draws nothing at all for is, on this evidence, marginally more likely to produce a move above 1 per cent than a normal trading day. The blank space is not quiet. It is unobserved, which is a very different thing, and it is why I keep coming back to what a weekend gap does whenever someone tells me their stop protects them at all times.
These are percentage changes in a published benchmark. They are not a forecast, and no gold price appears anywhere in this article.
Chart Settings That Reduce Mistakes
A few small things, each of which has caused someone a bad morning.
Set your timezone deliberately. TradingView defaults to a timezone that may not match your broker’s server, and gold trades in distinct session patterns. A daily candle that closes at a different hour than your broker’s is a different candle, with a different high and a different low, which means a different level.
Check whether the symbol shows extended or continuous hours, especially on futures contracts, because a chart that hides part of the day will hide part of the range with it.
Beware the continuous futures contract, usually written with a 1! suffix. It stitches successive contract months into one line, which is convenient for looking at long history and misleading for precise levels, because the join between two contracts is a step that no trade ever printed.
Finally, and this is the boring one that matters most, put the instrument name somewhere you will actually see it. Screenshot a level from one chart, come back two hours later on a different symbol, and you have a level from an instrument you are not trading, which is how people end up defending a line that was never there.
Get the free Gold Empire survival sheet, a one-page guide to working out what a position actually exposes you to before you take it, including the gap you cannot see on the chart. One email, no spam, unsubscribe anytime.
Frequently Asked Questions
How do I see gold chart in TradingView in the fastest way?
Click the symbol box at the top left, type XAUUSD, and choose from the dropdown. The chart loads immediately. The part worth an extra thirty seconds is checking the provider name next to the entry you picked, because the list contains spot quotes, futures contracts and individual brokers’ CFDs, and they do not all show identical prices.
Which gold symbol should I actually use?
The one closest to what you trade. If your broker publishes its own feed on the platform, use that, because it is the price you will be filled at. If not, an aggregated spot quote is a reasonable proxy, but treat your marked levels as approximate and confirm the fill on your own platform before drawing conclusions.
Why does my TradingView gold chart differ from my broker’s?
Because they are different instruments. Spot gold is an over the counter aggregate with no central order book, futures carry the cost of holding metal to a delivery date, and a broker CFD adds its own spread on top. Small differences are normal. They widen when liquidity is thin, which tends to be when it matters most.
Is TradingView’s gold data good enough to trade from?
For analysis, yes, provided you know which instrument you selected. For execution, your broker’s price is the only one that pays you. Treat the chart as the map and your platform as the road.
Where did the numbers in this article come from?
From the LBMA Gold Price PM benchmark series, linked above, over the twelve months to 22 September 2026: 251 auction sessions and 250 session to session changes. The percentages are counts of those changes exceeding each threshold, arithmetic anyone can repeat on the same public series. The weekend figures count the 53 pairs of consecutive auctions three or more calendar days apart. None of it is a forecast.
Where Gold Empire Fits
Gold Empire is free to follow. Daily XAU/USD analysis on Telegram, with the reasoning stated before the trade rather than after it, losing days included. There is a free survival sheet for anyone who wants the capital protection material in one place, and an optional Kit for people who want the whole method. Nothing here promises a profit, and nothing here is a signal service.
The pillar this sits under is risk management for gold trading, the settings companion is best chart settings for TradingView, and if you are weighing up which platform to analyse on at all, TradingView vs MetaTrader covers that comparison.
Knowing how to see gold chart in TradingView takes a minute. Knowing which gold you are looking at, and what the chart leaves out, is the part that keeps an account open.
About the author. Matthew writes Gold Empire and spends most of his attention on the boring mechanics that decide whether an account is still open in two years. He has a long standing habit of checking which instrument a screenshot came from before arguing about the level on it, which has saved him more money than any indicator. Nothing in this article is a recommendation to trade, and no entry, stop or target discussed should be treated as a signal.
Disclaimer: This article is general educational content about charting software and the differences between gold instruments. It is not financial advice, not investment advice and not a recommendation to buy, sell or hold any instrument or product. Trading gold and leveraged products carries a substantial risk of loss and is not suitable for everyone. Most retail accounts lose money. Past behaviour of any price series does not guarantee future results. Only risk capital you can afford to lose, and seek independent advice if you are unsure.
One step first
Where should we send the Gold Survival Sheet?
Leave your email and we will send the free one page checklist, then take you straight to the Telegram channel.
No cost and no obligation. Educational only, not financial advice, and nothing here promises a return. Unsubscribe any time in one click.
Leave a Reply