Blog

  • How to Stop Overtrading and Revenge Trading: Which Habit Actually Kills Accounts

    How to Stop Overtrading and Revenge Trading: Which Habit Actually Kills Accounts

    Almost everyone asking how to stop overtrading and revenge trading treats them as one problem with one cure, usually some version of “have more discipline.” I want to argue that they are two different problems, that only one of them is genuinely dangerous, and that the dangerous one is not the one most people worry about.

    The habit of taking too many trades is a leak. The habit of increasing your size after a loss is a hole in the hull. They feel similar from the inside, because both of them happen on the same bad afternoon, and both of them come from the same feeling. Their arithmetic is nothing alike.

    To be clear from the start: no entry, stop or target discussed should be treated as a signal.

    The two habits, described honestly

    Overtrading is trading more often than your own process calls for. You planned three setups a day and took nine. Most of the extra six were not bad ideas exactly, they were thin ones, taken because you were watching the screen and the screen was moving.

    Revenge trading is the sizing habit. You lose, and the next position is bigger, because a bigger winner would put the morning back where it was. Nobody plans this. It arrives as a very reasonable sounding thought: this next one is a better setup than the last one, so it deserves more.

    I have done both. What I could not tell you for years was which one was actually taking my account apart, because when you do both at once you cannot separate the causes. So I separated them in a simulation instead, where you can hold everything else still.

    How to stop overtrading and revenge trading depends on which one is expensive

    Here is the experiment. I gave a simulated trader a real edge, and then changed only their behaviour.

    The assumptions, stated so you can disagree with them:

    • Every trade is independent. It wins with probability 0.40, and a winner returns twice what a loser costs.
    • That gives an expected value of positive 0.20R per trade, where R is the risk on one trade. This trader is not a losing trader. They have a genuine, modest edge.
    • One R is one percent of the starting balance.
    • One month is twenty trading days.
    • The disciplined version takes three trades a day and risks the same amount every time.
    • The overtrading version takes nine trades a day, still at the same size every time.
    • The revenge version doubles the risk on the next trade after each loss, resetting to one R after any win, with a ceiling of eight R so the account cannot be wiped in a single click.
    • Two hundred thousand simulated months per case. I measured only one thing: the deepest peak to trough fall in the account during the month.

    I deliberately did not measure profit. Profit is not the point of this article, this is not a projection of what anyone will earn, and any number I put in that column would be read as a promise. Drawdown is the number that decides whether you are still trading in a year.

    Chart showing how to stop overtrading and revenge trading matters, with the probability of a twenty percent drawdown for four trading habits
    How to stop overtrading and revenge trading: the simulation says the sizing habit, not the trade count, is what produces deep drawdowns.

    The results were not close.

    Trading three times a day at a constant size produced a drawdown of twenty percent or worse in 1.0 percent of months. Tripling the trade count to nine a day, changing nothing else, took that to 4.6 percent. Worse, clearly, but survivable, and no case in either group reached a fifty percent drawdown at all.

    Now hold the trade count at three a day and add only the doubling habit. The chance of a twenty percent drawdown goes from 1.0 percent to 72.0 percent. Roughly one month in six, 16.6 percent, contains a fall of half the account.

    Do both, nine trades a day with doubling, and it is 88.6 percent and 27.6 percent.

    Read those two comparisons against each other. Trading three times as often multiplied the risk of a serious drawdown by about four and a half. Doubling after a loss multiplied it by about seventy two. Same edge, same market, same number of trades in the third case as the first. Only the sizing rule changed.

    Why the sizing habit is so much worse

    The reason is that overtrading adds risk, while revenge trading multiplies it, and it does the multiplying at precisely the wrong moment.

    When you take more trades at a constant size, your outcomes are a longer sum of the same small numbers. The typical result drifts, the extremes get slightly wider, and nothing structural changes. When you double after a loss, you are correlating your position size with the thing you cannot control. A run of five losses at a fixed size costs five R. The same run under doubling costs one, then two, then four, then eight, then eight again, which is twenty three R, or twenty three percent of where you started, from a sequence of trades that is completely ordinary.

    And that is the second half of the trap, because those sequences are ordinary. With a win probability of 0.40, over the sixty trades of a disciplined month, the chance of hitting at least one run of five consecutive losses is 88.8 percent. At least one run of six is 70.0 percent. Stretch to a hundred and eighty trades and a run of five becomes 99.9 percent and a run of six 97.7 percent.

    Losing streaks are not a sign that something has gone wrong. They are the arithmetic working normally. Which means a habit that punishes you severely for a streak is a habit that will be triggered, reliably, roughly every month. You are not gambling on whether the trigger arrives. You are gambling on your own composure when it does, and that is a bet with a known result.

    What the evidence outside my spreadsheet says

    A simulation only proves that a model behaves the way its assumptions say it will. So it is worth knowing that the effect shows up in real accounts too.

    Brad Barber and Terrance Odean studied 66,465 households at a large discount broker between 1991 and 1996. The households that traded most earned an annual return of 11.4 percent, while the market over the same period returned 17.9 percent. The average household earned 16.4 percent and turned over 75 percent of its portfolio a year. The paper is titled “Trading Is Hazardous to Your Wealth,” which tells you where they landed.

    That is a gap of six and a half percentage points a year between the busiest traders and simply owning the market, and it comes from a different asset class, a different decade and a different sort of account from ours. What survives the translation is the direction. The most active traders did worst, and the authors’ explanation was overconfidence rather than bad luck.

    It is also why regulators pay attention to this. The European securities regulator’s decision to prohibit binary options and restrict CFDs for retail investors was built on evidence about how retail accounts actually behave under leverage, not on a theory about it.

    The rules that actually work, and why

    Everything below shares one property. None of it requires you to be calm at the moment it matters. Rules that need composure fail exactly when composure is gone, which is the only time you needed them.

    Fix your risk before the week starts, not before the trade. One number, written down, applied to every trade regardless of how good this one looks. The moment position size becomes a per trade judgement, it becomes a mood. If you have not settled on a number, how much to risk per trade works through how to choose one.

    Cap the day, by count and by loss. Two losses and you are done, or three trades and you are done, whichever comes first. The value of a countable rule is that you cannot argue with a count. “Am I trading emotionally right now” is a question you will always answer no. “Have I taken three trades” is not a question you can lie about.

    Make the size mechanical. Size should be an output of your stop distance and your fixed risk, not an input. When it is calculated rather than chosen, doubling after a loss stops being a temptation you resist and starts being an arithmetic error you would have to commit on purpose.

    Put a gap between the loss and the next click. The doubling impulse has a short half life. Ten minutes away from the screen, or a rule that the next trade cannot be placed in the same fifteen minute window as the last stop out, removes most of it without requiring any willpower at all.

    Log the size, not just the outcome. Most journals record what happened. Record what you risked and what the previous trade did. Two weeks of that data will tell you whether you have a revenge sizing habit more honestly than any amount of reflection will.

    If the emotional side of this is the part you recognise most, how to stop revenge trading goes at it from the psychology rather than the arithmetic, and trading after a losing streak deals with the days these runs actually arrive on. The wider framework everything here sits inside is risk management in gold trading.

    Free gold survival sheet

    Get the free Gold Empire survival sheet, a one-page guide to protecting your account through the kind of market this article describes. One email, no spam, unsubscribe anytime.

    Get the free survival sheet →

    Frequently asked questions

    Is overtrading always bad?

    No, and that is the honest answer the simulation gives. Tripling the trade count while holding size constant took the chance of a twenty percent drawdown from 1.0 percent to 4.6 percent, which is a real cost but not a catastrophic one. The problem is that in practice the extra trades are usually thinner ideas, and a diluted edge is not the same as the edge I assumed. Treat trade count as a quality question rather than a survival question.

    How do I tell revenge trading from a legitimately better setup?

    By the timing rather than the reasoning, because the reasoning always sounds good. If your size went up within an hour of a loss, assume it was the loss. Written size rules make this test unnecessary, which is the point of having them.

    Does a bigger account make this safer?

    No. Every number in the simulation is a percentage, so the arithmetic is identical at any account size. A larger balance changes what the fall costs you in currency, not how likely it is.

    What about averaging into a position, is that the same thing?

    It is the same thing whenever the second entry exists because the first one is losing. Adding to a position that was planned in advance as a scaled entry is a strategy. Adding because you are down is doubling with better manners.

    Is a daily loss limit enough on its own?

    It is the single most useful rule, but it is not enough by itself, because it bounds the day and not the trade. Under a doubling habit you can reach a two loss limit having risked one R and then eight. Cap the size and the day separately.

    How long before I know the rules are working?

    You will know the rules are being followed within two weeks, because compliance is countable. Whether the edge underneath them is real takes a great deal longer, and anyone who tells you otherwise is selling something. The rules are what keep you solvent long enough to find out.

    Where this leaves you, and what we do about it

    If you take one thing from this, make it the ratio. Trading too often made a serious drawdown about four and a half times more likely. Increasing size after a loss made it about seventy two times more likely. Both habits deserve attention, but they do not deserve equal attention, and most of the advice written on this subject spends its time on the cheaper of the two.

    The practical version is short. Decide your risk once and never per trade. Count your trades. Calculate your size instead of choosing it. Put a gap between a loss and the next order. None of that requires you to become a calmer person, which is fortunate, because nobody becomes a calmer person during a losing run.

    Gold Empire is a free Telegram channel where we work through market context in public, including the days the read does not work out. There is no promise of profit, because there honestly cannot be one. What there is, is a group of people trying to stay in the game long enough for competence to start paying.

    If this was useful, the free Gold Survival Sheet is the natural next step. It is a one page checklist that puts the size, the cost and the ceiling in front of you before you enter, and it is free to download with nothing to join.

    About the author. Matthew writes the Gold Empire market notes. He spends most of his time on the unglamorous half of trading, position size, dealing costs and the arithmetic of recovery, on the view that surviving the first two years is what makes the rest of it possible.

    Disclaimer: This article is general educational content about how leveraged markets work. It is not financial advice and it is not a recommendation to buy or sell anything. Trading leveraged products carries a high risk of losing money rapidly. No entry, stop or target discussed should be treated as a signal. Figures attributed to external sources are linked so you can check them, and figures I have calculated are shown with the assumptions they rest on so you can change them.


  • How to Calculate Lot Size for Gold Forex Trades in One Line

    How to Calculate Lot Size for Gold Forex Trades in One Line

    Most people looking up how to calculate lot size for gold forex trades are hoping for a rule of thumb. Something like “use 0.01 lots per thousand dollars” that they can memorise and stop thinking about. I understand the appeal, and I am not going to give you one, because any rule of that shape is wrong the moment your stop distance changes, which is every trade.

    The good news is that the real calculation is one line of arithmetic and takes about fifteen seconds once you have done it a few times. The part that takes longer is accepting what it implies, which is that your position size is not a decision you get to make. It is an output. Three other numbers decide it for you.

    To be clear from the start: no entry, stop or target discussed should be treated as a signal.

    The three inputs, and why size is not one of them

    Every correct position size comes from exactly three things.

    Your account balance. Simple enough, and the only one of the three that changes slowly.

    The percentage you are willing to risk on this trade. A decision made once, in writing, while calm, not per trade and not by feel. I have written separately about how much to risk per trade, and the number matters far less than the fact that it stays fixed.

    The distance to your stop. This comes from the chart, from wherever your idea is proven wrong. It is not a number you choose for convenience.

    Multiply the first two and you have your risk in dollars. Divide that by the third and you have your size. Notice what is missing: how confident you feel, how good the setup looks, how much you would like to make. None of those appear anywhere in the calculation, and the moment one of them creeps in, you no longer have a risk rule, you have a mood.

    How to calculate lot size for gold forex trades, in one line

    You need one fact about the instrument. A standard lot of XAU/USD is 100 troy ounces, because gold is priced per troy ounce, a convention you can see in the LBMA precious metal price data. That single fact does all the work.

    If one lot is 100 ounces, then a one dollar move in the gold price is 100 dollars of profit or loss per lot. So:

    Lots = risk in dollars, divided by (stop distance in dollars per ounce, times 100).

    Work an example all the way through. A 5,000 dollar account, risking 1 percent, which is 50 dollars. Your stop sits 5 dollars per ounce away. Then lots equals 50 divided by (5 times 100), which is 50 divided by 500, which is 0.10 lots.

    That is the whole method. Now watch what happens when only the stop changes:

    Chart showing how to calculate lot size for gold forex, with the correct lot size falling as the stop distance widens
    How to calculate lot size for gold forex: with risk fixed at 50 dollars, a wider stop means a smaller position, every time.
    • A $3 stop gives 0.167 lots.
    • A $5 stop gives 0.100 lots.
    • An $8 stop gives 0.062 lots.
    • A $12 stop gives 0.042 lots.

    Same account, same risk percentage, same dollar amount at stake. Only the stop moved, and the correct size moved by a factor of four. This is the relationship that trips people up: size and stop distance are inversely proportional, so a wider stop is not more dangerous. A wider stop with unchanged size is more dangerous, and those are completely different statements.

    Rounding, and the small error it introduces

    The formula gives you numbers like 0.062 lots. Your platform will not accept that. Most allow steps of 0.01, so you have to round.

    Always round down. Rounding up means risking more than you decided to, which defeats the purpose of the calculation.

    Rounding down introduces a small, quantifiable shortfall. On a 5,000 dollar account with an 8 dollar stop, the exact answer is 0.062 lots, you trade 0.06, and your real risk becomes 48 dollars rather than 50. That is 4 percent below target. On a 10,000 dollar account with the same stop, 0.125 rounds to 0.12 and you risk 96 rather than 100, again 4 percent light.

    Being 4 percent under your intended risk is harmless. Being 4 percent over, every trade, for a year, is not. That asymmetry is the entire reason the rule is round down rather than round to nearest.

    One thing to watch on smaller accounts: rounding down can take you to the platform minimum, and below a certain balance the minimum itself becomes the binding constraint rather than your arithmetic. I worked through exactly where that line sits in how to trade gold with small account balances, and it is worth reading alongside this if your balance is under about a thousand dollars.

    Four ways this calculation goes wrong

    Using a fixed lot size regardless of stop. The most common error by a distance. Trading 0.10 lots every time means your risk swings with every stop distance, so a trade with a 12 dollar stop risks nearly two and a half times one with a 5 dollar stop. You think you have a consistent risk rule. You have a consistent lot size, which is not the same thing and is considerably worse.

    Choosing the stop to justify the size. The reverse error, and subtler because it feels disciplined. You want a bigger position, so the stop moves closer to entry to make the arithmetic allow it. Now your stop is placed for accounting reasons rather than where your idea fails, and you will be taken out of trades that were working.

    Confusing pips with dollars per ounce. Gold quoting conventions differ between brokers, and a “pip” on gold may be 0.01 or 0.10 or 1.00 depending on the platform. This is where most calculation errors of ten times or a hundred times come from. Working in dollars per ounce, as above, sidesteps the problem entirely. If you prefer to work in pips, confirm what one pip is worth on your account first, and I explain the convention in what a pip in gold trading actually is.

    Forgetting that the account balance changes. One percent of your balance after a losing month is a smaller number than it was before. Recalculating from the current balance is what makes the rule self-correcting, shrinking your size automatically when things go badly. Using the balance you started the year with removes that protection at exactly the moment you need it.

    Check the contract size before you trust the formula

    Everything above assumes a standard lot is 100 troy ounces, which is the common convention. It is not a law, and it is the one input worth verifying rather than assuming.

    Some brokers offer gold in different contract sizes, and a few quote it in a way where one lot is 10 ounces rather than 100. If yours does, every number in this article is out by a factor of ten, which is not a small error when it lands on your position size.

    There is a two minute check that settles it, and it does not require reading any documentation. Open your platform, set up an order for exactly 1.00 lot without placing it, and look at the contract size or notional value the ticket displays. Divide that notional by the current gold price and you have your ounces per lot. If the answer is 100, use the formula as written. If it is 10, replace the 100 in the formula with 10.

    Do the same check whenever you open an account somewhere new, and again if your broker changes its product specifications, which they occasionally do without much fanfare. It is the cheapest possible insurance against the single most expensive category of sizing mistake.

    The same caution applies to any instrument you carry this method across to. The structure of the calculation never changes, risk divided by stop distance times units per lot, but that last term is specific to the contract in front of you.

    Do it before you look at the chart

    A practical suggestion that costs nothing.

    Work out your risk in dollars at the start of the session, before you have an opinion about anything. Write it at the top of the page. Then, when a setup appears, the only number you need from the chart is the stop distance, and the size follows mechanically.

    The reason this ordering matters is that it removes the opportunity to negotiate. If you calculate the risk amount after you have found a setup you like, the number has a way of drifting upward, and the drift never feels like a decision at the time. Calculating it while you have no position and no opinion is the cheapest discipline available in this whole business, and it is the same reasoning that sits underneath the risk management approach and position sizing for gold more broadly.

    Frequently asked questions

    What is the formula for lot size in gold trading?

    Lots equals your risk in dollars divided by the stop distance in dollars per ounce multiplied by 100. The 100 comes from a standard XAU/USD lot being 100 troy ounces, so a one dollar move is 100 dollars per lot. Risking 50 dollars with a 5 dollar stop gives 0.10 lots.

    How many lots should I trade with a $1,000 account?

    There is no single answer, because it depends entirely on your stop distance. Risking 1 percent of 1,000 dollars is 10 dollars, which gives 0.033 lots on a 3 dollar stop but only 0.008 lots on a 12 dollar stop. Any advice that quotes a lot size without asking about your stop is guessing.

    Should I round lot size up or down?

    Down, always. Rounding up means exceeding the risk you decided on, while rounding down leaves you slightly under. On a 5,000 dollar account with an 8 dollar stop, rounding 0.062 to 0.06 puts your real risk at 48 dollars instead of 50, about 4 percent light, which is harmless in a way that being 4 percent heavy is not.

    Does lot size change if I use more leverage?

    No. Leverage determines the margin your broker holds while the position is open, not what you lose if the stop is hit. Your loss is size multiplied by stop distance, and leverage appears nowhere in that calculation. Higher leverage only permits larger positions, it does not make them appropriate.

    Why is my risk different from what I calculated?

    Usually one of three things: rounding, a pip convention that differs from what you assumed, or slippage. Stop orders become market orders when triggered, so in fast conditions you may be filled worse than your level, making the real loss larger than the arithmetic suggested. Treat the calculated figure as your intended risk rather than a guaranteed maximum.

    Can I use a lot size calculator instead?

    Yes, and most are fine, but check what it assumes about contract size and pip value before trusting it. A calculator built for currency pairs will give you a badly wrong answer on gold. Running one example by hand against the formula above takes a minute and tells you whether the tool is doing the right thing.

    Where this leaves you, and what we do about it

    The honest summary is that position size is arithmetic dressed up as a decision. Three inputs go in, one number comes out, and the only judgement involved is where the stop belongs. Once you work it in this order, the daily question stops being how much should I trade and becomes where is this idea proven wrong, which is a far better question to be asking.

    Gold Empire is a free Telegram channel where we work through market context in public, including the days the read does not work out. There is no promise of profit, because there honestly cannot be one. What there is, is a group of people trying to stay in the game long enough for competence to start paying.

    If this was useful, the free Gold Survival Sheet is the natural next step. It is a one page checklist that puts the size, the cost and the ceiling in front of you before you enter, and it is free to download with nothing to join.

    About the author. Matthew writes the Gold Empire market notes. He spends most of his time on the unglamorous half of trading, position size, dealing costs and the arithmetic of recovery, on the view that surviving the first two years is what makes the rest of it possible.

    Disclaimer: This article is general educational content about how leveraged markets work. It is not financial advice and it is not a recommendation to buy or sell anything. Trading leveraged products carries a high risk of losing money rapidly. No entry, stop or target discussed should be treated as a signal. Figures attributed to external sources are linked so you can check them, and figures I have calculated are shown with the assumptions they rest on so you can change them.


  • Best Broker for Gold Trading in Canada: What Protection Actually Covers

    Best Broker for Gold Trading in Canada: What Protection Actually Covers

    If you are looking for the best broker for gold trading in canada, you have probably already found a dozen lists ranking them by spread, platform and bonus. I want to give you a different starting point, because those lists all skip the question that decides whether the other answers matter at all: if the firm holding your money fails tomorrow, what actually comes back to you?

    That question has a published answer in Canada, with numbers attached, and almost nobody reads it before funding an account. It is not a thrilling read. It is the single most consequential thing on this page. Before we go further, the standing line: no entry, stop or target discussed should be treated as a signal.

    So this article is about protection first and features second. What Canadian investor protection actually covers, what it explicitly does not, and the short list of checks worth doing before you send money anywhere.

    The Question Ranking Lists Never Ask

    A broker is not a strategy. It is a counterparty. When you fund an account, you are handing your capital to a company and trusting two separate things at once: that the company will still be there next year, and that if it is not, your property comes back.

    Those are different risks from the risk of being wrong about gold, and they are the ones a comparison table cannot help you with. A firm can have the tightest spread in the market and still be the wrong place to keep your money. The order of operations matters here. Survive the counterparty first, then optimise the costs.

    What Protection Actually Covers in Canada

    Canada has an investor protection fund that covers clients of member firms. The Canadian Investor Protection Fund publishes its coverage limits openly, and the wording is worth quoting rather than paraphrasing.

    For an individual holding accounts with a member firm, CIPF states the limits are generally: “$1 million for all general accounts combined (such as cash accounts, margin accounts, TFSAs and FHSAs), plus $1 million for all registered retirement accounts combined (such as RRSPs, RRIFs and LIFs), plus $1 million for all registered education savings plans (RESPs) combined where the client is the subscriber of the plan.”

    You can read the full policy summary on the CIPF coverage page.

    What investor protection covers for the best broker for gold trading in canada, and what it never covers
    Choosing the best broker for gold trading in canada starts with what the protection actually replaces, and what it leaves entirely to you.

    Three separate million dollar buckets, at one member firm, for one individual. For the overwhelming majority of retail gold traders, that ceiling is not the binding constraint. Almost nobody reading this has a million dollars in a margin account. Which means the number to worry about is not the limit. It is whether the firm is a member at all, a point I will come back to.

    What It Never Covers, and Why That Matters More

    Here is the part that gets misread constantly. CIPF describes its coverage as custodial in nature, and states directly that it does not provide protection against market losses.

    Read the mechanism rather than the phrase. What the fund does is compensate you for property that is missing from your account at the date the member firm becomes insolvent. If a hundred shares should be in your account and they are not, you are compensated based on their value on the day of the insolvency. It restores what should have been there.

    What it does not do is make you whole for a trade that went against you. If gold moves the wrong way and your account halves, nothing about that is a coverage event. It is simply the business you chose to be in.

    The coverage policy also lists property that is not eligible, crypto assets among them.

    I labour this because I have seen the confusion cause real damage. A trader hears “protected up to a million dollars”, relaxes, and sizes accordingly. The protection they are relying on has nothing to do with the risk they are actually running. Coverage protects you from the firm. It does not protect you from yourself, and it is your own position sizing that does that job, which is the whole argument in risk management for gold trading.

    Membership Is the Check That Actually Matters

    Since the dollar ceiling is irrelevant for most retail accounts and market losses are excluded, the entire practical value of Canadian investor protection collapses into one binary question. Is this specific firm a member?

    Not the group. Not the brand on the website. The legal entity your account will actually be opened with. Firms routinely operate several entities across different jurisdictions, and a name you recognise in Toronto may be a different company entirely on the account agreement you are about to sign. The protections attached to those entities are not the same, and the one that matters is the one named in your documents.

    So the check is: find the entity name in the account agreement, then confirm that exact entity on the regulator’s own register and on the protection fund’s member list. Not on the firm’s website. Regulator badges in a website footer are graphics, and graphics can say anything.

    The Offshore Trade-Off, Priced Honestly

    The pull toward an offshore firm is almost always leverage. Somewhere offering 500:1 looks generous next to a domestic account offering a fraction of that, and it feels like being handed more room to work.

    Here is why that reasoning usually fails. Leverage does not set your risk. Your position size and your stop distance set your risk. If you size from your stop, which is the correct order, then the leverage ceiling is a limit you rarely approach. Trading a risk-sized position with a sensible stop, most retail gold traders use a modest share of their available margin at ordinary leverage levels. The extra headroom offshore buys them nothing at all.

    What it costs, though, is concrete: weaker recourse, a protection fund that may not exist, and a legal entity in a jurisdiction where enforcing anything is impractical. You are trading away real protection for theoretical room you were never going to use. If the mechanics of leverage are still fuzzy, what leverage actually is in gold trading covers it properly.

    There is a second reason to be careful. The US Commodity Futures Trading Commission’s fraud advisory on foreign currency trading opens with a warning worth reading twice: “The forex market is volatile and carries substantial risks. It is not the place to put any money that you cannot afford to lose, such as retirement funds, as you can lose most or all it very quickly.” The advisory notes the regulator has seen a sharp rise in forex trading scams, and it is published on the CFTC’s fraud advisory page. Different country, identical lesson: the further from a real regulator you go, the more of that risk you carry alone.

    Then, and Only Then, Compare the Features

    Once a firm has passed the protection test, the ordinary comparison becomes worth doing. In rough order of how much they affect a gold account:

    • Total dealing cost on gold, spread plus any commission, measured at the hours you actually trade rather than the headline number.
    • Overnight financing, which quietly dominates the cost of anything held for days.
    • Execution behaviour around news, meaning how far fills drift when it matters.
    • Withdrawal record, which is the one thing you cannot test until you need it, so look for a long unremarkable history rather than promises.
    • Platform and instrument, whether gold is offered in a form you understand and at a contract size your account can size sensibly.

    Notice that spread is on the list but not at the top. A slightly wider spread at a firm that will still exist in five years is a better deal than a tight one at a firm you cannot verify. The general framework is in what actually matters when choosing a gold broker, and the account-opening mechanics are in how to open a gold trading account.

    A Short Checklist Before You Fund Anything

    1. Find the legal entity name on the account agreement, not the brand on the homepage.
    2. Confirm that entity on the regulator’s own register.
    3. Confirm that entity on the investor protection fund’s member list.
    4. Read what the coverage excludes, and accept that market losses are yours alone.
    5. Decide how much capital genuinely needs to sit at the firm, and leave the rest at your bank.
    6. Only then compare spreads, financing and platforms.

    The whole exercise takes about twenty minutes once. It is the cheapest twenty minutes in this business.

    Free gold survival sheet

    Get the free Gold Empire survival sheet, a one-page guide to protecting your account through the kind of market this article describes. One email, no spam, unsubscribe anytime.

    Get the free survival sheet →

    Frequently Asked Questions

    Is my gold trading account protected in Canada?

    Only if the firm holding it is a member of the Canadian Investor Protection Fund. Membership is per legal entity, so check the specific entity named in your account agreement rather than the brand. If it is a member, coverage applies to property missing from your account if the firm becomes insolvent, up to the published limits.

    How much does CIPF cover?

    For an individual, generally $1 million for all general accounts combined, plus $1 million for registered retirement accounts combined, plus $1 million for RESPs combined where the client is the subscriber. Exceptions exist and the coverage policy governs any actual claim, so read it rather than relying on a summary.

    Does investor protection cover my trading losses?

    No. Coverage is custodial. It addresses property missing from your account when a member firm fails. Money lost because a trade went against you is not covered by any investor protection scheme anywhere, and no broker feature changes that.

    Should I use an offshore broker for higher leverage on gold?

    For most risk-sized traders the leverage ceiling at a regulated firm is never the binding constraint, so the extra headroom buys nothing while the loss of protection and recourse is real. Work out the margin your normal position actually requires first. If you are nowhere near the ceiling, higher leverage is not a benefit you can use.

    How do I check whether a broker is really regulated?

    Look the entity up on the regulator’s own public register and match the exact legal name, registration number and address against your account documents. Never rely on logos or claims on the broker’s own site. If the entity you are signing with does not appear, treat that as the answer.

    How much money should I keep in my trading account?

    Enough to meet the margin your planned positions require, plus a sensible buffer, and not much more. Capital sitting idle at a broker is exposed to the firm for no return. This is a separate decision from position sizing and worth making deliberately.

    Choosing the Best Broker for Gold Trading in Canada

    The best broker for gold trading in canada is not the one with the tightest spread on a comparison table. It is the one that is still there in five years, that is a verified member of the protection scheme under the exact entity on your paperwork, and whose costs you have measured yourself at the hours you actually trade.

    Gold Empire is a free Telegram channel where we work through market context in public, including the days the read does not work out. There is no promise of profit here, because there honestly cannot be one. What there is, is a group of people trying to stay in the game long enough for competence to start paying.

    If this was useful, the free Gold Survival Sheet is the natural next step. It is a one page checklist that puts the size, the cost and the ceiling in front of you before you enter, and it is free to download with nothing to join.

    About the author. Matthew writes the Gold Empire market notes. He spends most of his time on the unglamorous half of trading, position size, dealing costs and the arithmetic of recovery, on the view that surviving the first two years is what makes the rest of it possible.

    Disclaimer: This article is general educational content about how leveraged markets and investor protection schemes work. It is not financial, legal or tax advice, and it is not a recommendation of any firm. Coverage rules change and the published coverage policy governs any actual claim, so verify current terms directly with the fund and your regulator. Trading leveraged products carries a high risk of losing money rapidly. No entry, stop or target discussed should be treated as a signal. Figures attributed to external sources are linked so you can check them.


  • How to Avoid Stop Loss Hunting Forex Traders Blame on Brokers

    How to Avoid Stop Loss Hunting Forex Traders Blame on Brokers

    Almost every trader who asks me how to avoid stop loss hunting forex style has just watched the same thing happen. Price dipped a little below the obvious low, took them out, then turned around and went exactly where they thought it would. It feels personal. It feels like somebody looked at their order and reached for it.

    I want to give you the honest version, because the popular explanation is wrong in a way that leads people to do the one thing that makes the problem worse. Your broker is almost certainly not hunting your individual stop. But your stop was very probably sitting in the same obvious place as thousands of other stops, and that cluster is a real thing that real money moves toward. Those two statements are not in conflict, and the difference between them decides what you should actually do about it.

    So this is a mechanism first, then arithmetic. To be clear from the start: no entry, stop or target discussed should be treated as a signal.

    What a stop order actually is

    Start with the definition, because most of the confusion lives here.

    The US Commodity Futures Trading Commission defines it plainly in its official glossary: a stop order “becomes a market order when a particular price level is reached”, and “a sell stop is placed below the market, a buy stop is placed above the market”.

    Read that once more, slowly. Your stop is not a polite request to exit at your price. It is an instruction that converts into a market order the instant a level trades. It takes whatever price is available at that moment.

    Now think about what happens when several thousand traders have all placed sell stops just below the same visible low. That level is not a line on a chart any more. It is a pile of dormant market sell orders, all of which will fire at once the moment price touches it.

    This is the whole mechanism, and there is nothing shadowy in it. Price reaches an obvious level, a cluster of stops converts to market orders simultaneously, that burst of selling pushes price further and faster than the original move justified, and then, with the stops cleared out, price is free to go back to whatever it was doing. What you experienced as being hunted was your order being part of a crowd that moved the market by exiting together.

    Why the conspiracy version leads you astray

    The reason I labour this is not pedantry. The two explanations point at opposite solutions.

    If you believe a broker is picking off your specific order, the natural response is to hide it: use a mental stop, or set it much tighter so there is less to take. Both of those are seriously bad ideas, and I will show you why with numbers in a moment.

    If instead you understand that the problem is where your stop sits relative to everyone else’s, the response is completely different and much more useful. You stop placing stops in the obvious place, and you accept that the obvious place is obvious to everyone precisely because it is easy to see.

    There is a further point worth making for fairness. Genuine misconduct by regulated brokers does exist and regulators pursue it. But the everyday experience of “my stop got hit then price reversed” is almost always the crowd mechanism above, and treating ordinary market structure as a personal attack tends to produce angry trading rather than better trading.

    How to avoid stop loss hunting forex traders fall into: the arithmetic of stop width

    Here is the part that settles the argument, and it needs no view on gold and no assumption that anyone has an edge.

    Model the market as a driftless random walk. That is deliberately the fairest possible assumption: nobody is predicting anything, there is no trend, no manipulation, no skill on either side. For a position with a stop distance S and a target distance T, the probability that price touches the stop before the target is simply T divided by (S plus T).

    Fix the target at 10 dollars per ounce and vary the stop:

    Chart showing how to avoid stop loss hunting forex by stop width, a tighter stop is hit first far more often and pays more in dealing costs
    The arithmetic behind how to avoid stop loss hunting forex style: a 2 dollar stop is hit first 83.3 percent of the time, before anyone manipulates anything.
    • A $2 stop is hit first 83.3 percent of the time.
    • A $3 stop, 76.9 percent.
    • A $5 stop, 66.7 percent.
    • An $8 stop, 55.6 percent.
    • A $12 stop, 45.5 percent.

    Look at the top line again. Four times out of five, a tight stop is taken out before the target is reached, in a market where by construction nobody is hunting anyone. If your response to feeling hunted is to tighten up, you have just volunteered for that number.

    And it gets worse once dealing costs enter, because being stopped out means going again. At a round-trip cost of 35 cents per ounce, the number of entries needed before one target is reached, and the share of that eventual win consumed by costs, run like this:

    • $2 stop: 6.00 entries per win, costing 21.0 percent of the win.
    • $5 stop: 3.00 entries, costing 10.5 percent.
    • $8 stop: 2.25 entries, costing 7.9 percent.

    Tightening from an $8 stop to a $2 stop makes you enter 2.7 times as often for the same result. I computed all of this in Python from the assumptions stated above, and you can change the target, the cost or the model and watch the table move.

    The conclusion is uncomfortable but clean. In a fair market, no stop width is smarter than another in terms of expectancy before costs. What stop width genuinely changes is how frequently noise ends your trade, and therefore how much you pay in friction. Tight stops do not protect you from being hunted. They guarantee you are stopped more, and they hand more of your account to the spread.

    What actually reduces the problem

    Four things, in the order I would fix them.

    One: place the stop where your idea dies, not where your wallet is comfortable. A stop has one job, to tell you the reason for the trade is gone. If the level that would prove you wrong is 8 dollars away, then the trade risks 8 dollars, and the only remaining variable is how many ounces you buy. Deciding the stop from how much you want to lose is backwards, and it is the single most common cause of stops sitting in silly places. This is why position sizing is the lever, not stop distance.

    Two: stop using the most obvious level available. If you can see the swing low at a glance, so can everyone. Placing your stop a little beyond the level, rather than immediately against it, moves you out of the densest part of the cluster. It costs you a slightly wider stop, which the arithmetic above says is a good trade, and it means the burst of market orders can clear without taking you with it.

    Three: understand the level before you trade near it. The sweep you keep getting caught in has a name and a shape, and I have written about the mechanism separately in what a liquidity sweep in gold trading is and in why price moves toward where the crowd is losing. Neither of those will let you predict the sweep. Both will stop you being surprised by it.

    Four: never remove the stop. The mental stop is the worst answer to this problem. It replaces a defined, automatic loss with a decision you have to make while losing money, which is the moment you are least able to make it well. An account can survive being stopped out badly for years. It rarely survives one position held without a stop through a genuine move. The rules on where to place a stop loss on XAUUSD are worth settling while calm, in writing.

    One thing a stop cannot do for you

    Since we started with the CFTC definition, it is worth closing the loop on it.

    Because a stop becomes a market order, it does not guarantee your price. In a fast market, or across a weekend gap, the next available price can be well beyond your level, and you will be filled there. That is not your broker cheating. It is what a market order does when there is nothing to trade against at your price.

    The practical consequence is that your real worst case is wider than the number on your ticket. Any risk plan that treats the stop as a hard floor is slightly optimistic, which is another argument for sizing so that being wrong, and being wrong by more than expected, are both survivable. That is the entire logic of the risk management approach underneath everything else on this site.

    Free gold survival sheet

    Get the free Gold Empire survival sheet, a one-page guide to protecting your account through the kind of market this article describes. One email, no spam, unsubscribe anytime.

    Get the free survival sheet →

    Frequently asked questions

    Do brokers really hunt stop losses?

    Regulated brokers are not generally sitting there picking off individual retail orders, and the everyday version of this experience is explained by order clustering rather than misconduct. Stops gather at visible levels, they all convert to market orders at the same instant, and that burst moves price further than the original flow justified. Genuine misconduct exists and regulators pursue it, but it is a poor explanation for the ordinary case.

    Will a tighter stop protect me from stop hunting?

    It does the opposite. On a driftless random walk with a fixed 10 dollar target, a 2 dollar stop is hit first 83.3 percent of the time against 55.6 percent for an 8 dollar stop, and it requires 2.7 times as many entries per eventual win, paying 21 percent of that win in dealing costs rather than 7.9 percent.

    Should I use a mental stop instead so nobody can see it?

    No. A stop resting at the broker is not visible to the wider market in any useful sense, and replacing it with a decision you must make under pressure removes the one protection that works when you are least rational. The failure mode of a mental stop is the position you never closed.

    Where should I put my stop so it does not get swept?

    There is no placement that cannot be reached, and anybody promising one is selling something. What helps is choosing the level from where your reasoning is proven wrong rather than from your comfort, then sitting a little beyond the most obvious price rather than right against it, and adjusting the number of ounces so the wider stop still risks the percentage you intended.

    Does a stop loss guarantee I lose only that amount?

    No. A stop becomes a market order when the level trades, so in fast conditions or across a gap you can be filled materially worse than your level. Treat the stop as your intended loss rather than your maximum one, and size with that gap in mind.

    Where did these numbers come from?

    I calculated them in Python from a driftless random walk, where the probability of touching the stop before the target is the target distance divided by the sum of both distances. The assumptions are a 10 dollar target and a 35 cent round-trip cost per ounce, both stated so you can change them. The stop order definition is quoted from the CFTC glossary, linked above.

    Where this leaves you, and what we do about it

    The honest summary is that stop hunting is mostly a description of crowding, not of villainy, and the fix is to stop standing where the crowd stands. That is a placement and sizing decision made calmly before the trade, not a grievance to be processed after it. Once the arithmetic of stop width is in front of you, the instinct to tighten up after a bad exit stops looking like discipline and starts looking like what it is, which is paying more to be stopped more.

    Gold Empire is a free Telegram channel where we work through market context in public, including the days the read does not work out. There is no promise of profit, because there honestly cannot be one. What there is, is a group of people trying to stay in the game long enough for competence to start paying.

    If this was useful, the free Gold Survival Sheet is the natural next step. It is a one page checklist that puts the size, the cost and the ceiling in front of you before you enter, and it is free to download with nothing to join.

    About the author. Matthew writes the Gold Empire market notes. He spends most of his time on the unglamorous half of trading, position size, dealing costs and the arithmetic of recovery, on the view that surviving the first two years is what makes the rest of it possible.

    Disclaimer: This article is general educational content about how leveraged markets work. It is not financial advice and it is not a recommendation to buy or sell anything. Trading leveraged products carries a high risk of losing money rapidly. No entry, stop or target discussed should be treated as a signal. Figures attributed to external sources are linked so you can check them, and figures I have calculated are shown with the assumptions they rest on so you can change them.


  • How to Trade Gold With Small Account Balances: The Floor Nobody Mentions

    How to Trade Gold With Small Account Balances: The Floor Nobody Mentions

    Most of the questions I get about how to trade gold with small account balances assume the problem is strategy. People believe that a $200 account needs a sharper method than a $20,000 account, some tighter, cleverer way of reading the chart that makes up for the missing money. It does not. The percentages behave identically at every account size. What actually changes on a small balance is something far more boring and far more binding, and almost nobody mentions it, because it is arithmetic rather than analysis.

    The constraint is this: your broker will not let you trade a position small enough to obey your own risk rule. Below a certain balance, the smallest trade you are permitted to place already risks more of your account than you intended to risk. No amount of discipline fixes that, because the discipline is not the thing failing. The platform’s minimum order size is.

    This article works through that floor with numbers you can recalculate, then covers what leverage does and does not do for you, and finishes with the four honest options available when the floor binds. To be clear from the start: no entry, stop or target discussed should be treated as a signal.

    What a small balance actually changes

    Start by clearing away the thing that does not change.

    Percentage risk is scale free. Risking 1 percent of $500 and 1 percent of $50,000 are the same decision expressed in different currency amounts. A ten trade losing streak hurts an account by the same percentage either way. The recovery arithmetic is identical. In that sense a small account is not more dangerous, and anybody telling you that small accounts are inherently doomed is skipping a step.

    What does change is granularity. Gold is quoted per troy ounce, a convention you can see in the LBMA precious metal price data, and the standard contract most brokers build on is 100 troy ounces. The common minimum most retail platforms allow is one hundredth of that, usually written as 0.01 lots, which is one troy ounce. At one ounce, a one dollar move in the gold price is one dollar of profit or loss. That is the smallest unit of exposure the platform will sell you.

    So your risk per trade is not a dial you can turn continuously. It comes in steps, and on a small account the first step is already large relative to the balance.

    How to trade gold with small account balances starts with the minimum lot

    Here is the calculation that decides everything else, and it needs no forecast and no view on gold.

    Your risk on a trade is the size of your position multiplied by the distance to your stop. At the minimum size of one ounce, your position multiplier is fixed at one. So your risk in dollars simply equals your stop distance in dollars per ounce. A $5 stop risks $5. An $8 stop risks $8. There is no way to risk less, because there is no smaller position to take.

    Now express that as a percentage of different account balances.

    Chart showing how to trade gold with small account balances, the minimum risk per trade a small account can reach at the smallest tradable position size
    The floor under how to trade gold with small account balances: at minimum position size, a $100 account risks 5 percent on a $5 stop and cannot go lower.

    A $100 account taking a $5 stop is risking 5 percent of everything it has, on the smallest trade the platform allows. Widen the stop to $8, which is not an unusual distance on gold, and that becomes 8 percent. A $200 account is at 2.5 percent and 4 percent respectively. Only at $500 does the $5 stop finally land on 1 percent.

    The general rule falls straight out of it. To keep risk at or under 1 percent per trade at minimum size, you need an account of at least one hundred times your stop distance in dollars per ounce:

    • A $3 stop needs about $300.
    • A $5 stop needs about $500.
    • An $8 stop needs about $800.
    • A $12 stop needs about $1,200.

    I calculated these in Python and the assumptions are all on the table: minimum size of 0.01 lots equals one troy ounce, one dollar of price movement equals one dollar per ounce, and no commission included. Change the minimum size your broker offers and the whole table shifts. That is the point. These are not laws of nature, they are the consequences of a contract specification, and you can look yours up in ten minutes.

    Notice what this does to the usual advice. “Risk one percent” is excellent guidance that quietly assumes you are able to. Under roughly $500, with a normal gold stop, you are not able to. The advice does not become wrong, it becomes unreachable, and the gap between the two is where a lot of small accounts quietly die while their owners believe they are following the rules.

    Leverage is not the lever you think it is

    The instinctive response to a small balance is to reach for more leverage, and this is worth being precise about, because the reasoning behind it is usually backwards.

    Leverage determines how much margin the broker sets aside to hold your position. It does not determine how much you lose when price moves against you. Your loss is decided by position size and stop distance, both of which you chose before leverage entered the conversation. Two traders with identical positions and identical stops lose identical amounts whether one is at 20:1 and the other at 500:1. The higher leverage account simply had more of its balance left free while the trade was open. I have written about this at more length in what leverage in gold trading actually is, because it is the single most misunderstood number on the platform.

    What leverage genuinely changes is how much rope you have to hang yourself with. It raises the ceiling on the size you are permitted to take, and on a small account the temptation to use that ceiling is strongest, because it is the only apparent route to a meaningful return.

    Regulators reached the same conclusion from the other direction. When the European Securities and Markets Authority reviewed retail trading in leveraged products, it capped retail leverage on gold at 20:1 and paired it with two structural protections: a margin close out rule that forces positions shut when account equity falls to 50 percent of the minimum required margin, and negative balance protection so a retail client cannot end up owing the broker money.

    Read that margin close out rule carefully if you hold a small account, because it is the mechanism that will actually end you. You do not get to ride a position all the way to zero and hope. The system intervenes at a threshold, and on a small balance with a large position, the distance to that threshold is short. The protection is real and I am glad it exists, but its existence tells you what regulators expected to happen often enough to legislate for.

    The survival arithmetic under a forced risk level

    Once you know the risk percentage the floor forces on you, you can work out how much room for error you have bought. I ran the same simple loop for three balances, all at a $5 stop and minimum size, counting how many consecutive full stop losses it takes to cut the account in half:

    • A $200 account is forced to 2.5 percent per trade, and loses half its balance after 20 straight losses.
    • A $500 account reaches 1 percent, and needs 50 straight losses.
    • A $1,000 account reaches 0.5 percent, and needs 100.

    Twenty consecutive losses sounds impossible until you remember that a beginner changing method every week is effectively taking random trades, and that a run of twenty is not remotely rare across a few hundred attempts. The $500 account is not twice as safe as the $200 one. In terms of how many mistakes it can absorb while you are still learning, it is two and a half times as safe, and that ratio compounds with every extra dollar of funding until the minimum lot stops binding at all.

    This is also why I keep pointing people at position sizing for gold before anything else, and why risk management sits underneath every other article on this site. Size is the only input in the whole chain that you control completely and that the market cannot argue with.

    The four honest options when the floor binds

    If the arithmetic above says your balance cannot support a sane risk level, you have four real choices. I am going to be blunt about the trade-offs in each, because the usual answer is to pretend the problem does not exist.

    One: fund the account to where the rule becomes reachable. Multiply your realistic stop distance by 100 and that is your target balance. This is the cleanest fix and often the least popular, because it means waiting. If the difference is a few hundred dollars, waiting two months is a genuinely better trade than any setup you will take this week. It is worth reading how much money you actually need to start trading gold alongside this, since the two questions are the same question asked from opposite ends.

    Two: find a broker that offers a smaller minimum. Some platforms allow 0.001 lots, a tenth of an ounce, which drops the floor by a factor of ten and makes a $100 account workable on paper. Check this before you deposit rather than after, and check it against the same broker’s other terms, because a tiny minimum size attached to a wide spread or an unregulated entity is not a bargain. The process for vetting that is in how to open a gold trading account.

    Three: trade a shorter stop distance, with your eyes open. Halving your stop halves your dollar risk at fixed size, which does move the floor. But a stop is not a free parameter. It should sit where your idea is proven wrong, and moving it closer to entry for accounting reasons means you will be stopped out of trades that were working. You are trading one problem for another, and the second one is harder to see because it shows up as a series of small losses rather than one large one.

    Four: accept a higher risk percentage deliberately, and cap the damage elsewhere. If you decide a $200 account will risk 2.5 percent per trade because that is the floor, then the compensating control has to be frequency and a hard stop on the month. Deciding in advance that four losses in a row ends your week is a real constraint, and it is the only one available once size is maxed out at the minimum. What makes this option survivable is that you set it while calm, in writing, before the first trade.

    What I would not do is the fifth option nobody lists, which is to take the forced 5 percent risk and simply not think about it. That is how a small account becomes a story about how trading does not work.

    The costs that do hit a small account harder

    One correction to a common belief, since I want this to be accurate rather than just reassuring.

    Dealing costs scale with position size, so the spread you pay is the same percentage of your account whether you trade one ounce or one hundred. Frequency multiplies it identically at every balance. On that dimension, small accounts are not penalised.

    Fixed fees are the exception, and they are brutal on small balances precisely because they do not scale. An inactivity fee, a withdrawal charge, or a fixed minimum commission per ticket is a rounding error on $20,000 and a serious tax on $200. A $10 monthly inactivity fee is 5 percent of a $200 account per month, which is more than most traders make in a good month. Read the fee schedule, and look specifically for the charges quoted in currency rather than percentages. Those are the ones aimed at you.

    Free gold survival sheet

    Get the free Gold Empire survival sheet, a one-page guide to protecting your account through the kind of market this article describes. One email, no spam, unsubscribe anytime.

    Get the free survival sheet →

    Frequently asked questions

    What is the minimum realistic balance for trading gold?

    It depends entirely on your stop distance and your broker’s minimum position size, not on a round number somebody quotes. With a standard 0.01 lot minimum and a $5 stop, roughly $500 is where a 1 percent risk rule becomes reachable. With a broker offering 0.001 lots the same rule works from about $50. Work out your own figure by multiplying your typical stop distance in dollars by 100.

    Can I just use higher leverage to trade gold with a small account?

    Higher leverage does not reduce your loss on a losing trade, it only frees up margin while the position is open. Your loss is position size multiplied by stop distance, and leverage appears nowhere in that calculation. What higher leverage does is permit larger positions, which on a small account is the fastest available route to a serious loss.

    Does a small account need a different strategy?

    No. The percentage arithmetic is identical at every balance. What a small account needs is an honest check that its risk rule is actually achievable at the minimum position size, and a deliberate decision about what to do if it is not.

    Is it better to demo trade until I can fund properly?

    Demo is genuinely useful for learning the platform mechanics, order types and your own process, and it costs nothing. What it cannot teach is how you behave when the money is real, which is a substantial part of the skill. A reasonable compromise is to demo the mechanics while funding the account properly, then start live at the size the arithmetic supports.

    What happens if my small account runs out of margin?

    Under the European rules, positions are closed automatically once account equity reaches 50 percent of the minimum required margin, and negative balance protection means a retail client cannot be left owing the broker. Rules differ by jurisdiction, so check what applies to the entity you actually signed with rather than assuming.

    Do these numbers change if gold is expensive or cheap?

    The risk arithmetic in this article does not depend on the gold price at all, because it works from the stop distance in dollars per ounce rather than from a price level. What the gold price does affect is the margin required to hold a position, since margin is a percentage of notional value. That changes how many positions you can hold at once, not how much you lose on any one of them.

    Where this leaves you, and what we do about it

    The honest summary is that a small account is not a strategy problem, it is a resolution problem. Your risk rule is continuous and your position sizes are not, and below a certain balance those two facts collide in a way no amount of chart reading resolves. Once you can see the floor, the decision in front of you is a funding and broker decision made while calm, not a trading decision made at the screen.

    Gold Empire is a free Telegram channel where we work through market context in public, including the days the read does not work out. There is no promise of profit, because there honestly cannot be one. What there is, is a group of people trying to stay in the game long enough for competence to start paying.

    If this was useful, the free Gold Survival Sheet is the natural next step. It is a one page checklist that puts the size, the cost and the ceiling in front of you before you enter, and it is free to download with nothing to join.

    About the author. Matthew writes the Gold Empire market notes. He spends most of his time on the unglamorous half of trading, position size, dealing costs and the arithmetic of recovery, on the view that surviving the first two years is what makes the rest of it possible.

    Disclaimer: This article is general educational content about how leveraged markets work. It is not financial advice and it is not a recommendation to buy or sell anything. Trading leveraged products carries a high risk of losing money rapidly. No entry, stop or target discussed should be treated as a signal. Figures attributed to external sources are linked so you can check them, and figures I have calculated are shown with the assumptions they rest on so you can change them.


  • How to Avoid Losing Money in Forex Trading: The Arithmetic Nobody Shows You

    How to Avoid Losing Money in Forex Trading: The Arithmetic Nobody Shows You

    Almost everyone who asks me how to avoid losing money in forex trading is really asking a different question. They want to know which setup wins, which session is safest, which indicator finally makes the chart make sense. I understand the instinct. But the traders I have watched survive their first two years did not get there by finding a better signal. They got there by fixing a handful of things that can be measured with a calculator, before the market ever entered the picture.

    So this article is not a strategy. It is arithmetic. I want to show you where retail money actually goes, why a loss costs more than it appears to, and which of the leaks are inside your control. Some of it is uncomfortable. All of it is checkable, and I have shown my working throughout so you can rerun the numbers yourself and disagree with my assumptions.

    To be clear from the start: no entry, stop or target discussed should be treated as a signal.

    The base rate almost nobody quotes you

    Start with the number that frames everything else.

    When European regulators reviewed retail trading in leveraged products, they did not rely on anecdote. National regulators across the member states analysed real client accounts, and the European Securities and Markets Authority published what they found: 74 to 89 percent of retail accounts typically lose money, with average losses per client ranging from 1,600 to 29,000 euros.

    Read that range again, because the width of it matters more than the headline. It is not a single figure from a single broker. It is a band drawn across different countries, different firms and different market conditions, and the floor of that band is 74 percent. Even in the friendliest jurisdiction studied, roughly three accounts in four ended up down.

    I do not quote this to frighten anyone away. I quote it because it changes what a sensible goal looks like. If the base rate is that harsh, then the first job is not to make money faster than everyone else. The first job is to not be in the losing group, and those are genuinely different objectives that pull you toward different behaviour.

    How to avoid losing money in forex trading, the recovery math showing a 30 percent loss needs a 42.9 percent gain
    The recovery arithmetic behind how to avoid losing money in forex trading: every drawdown demands a larger gain to undo it.

    How to avoid losing money in forex trading starts with the recovery math

    Here is the piece of arithmetic I wish someone had put in front of me on day one.

    A loss and the gain that reverses it are not the same size. If you lose 20 percent of an account, you do not need 20 percent to get back to where you started, because you are now earning that percentage on a smaller balance. You need 25 percent. The formula is simple: the gain required equals d divided by (1 minus d), where d is the drawdown expressed as a decimal.

    Run it across the range and the curve gets ugly quickly:

    • Lose 10 percent, you need 11.1 percent to get back to flat.
    • Lose 20 percent, you need 25 percent.
    • Lose 30 percent, you need 42.9 percent.
    • Lose 50 percent, you need 100 percent. You have to double what is left.
    • Lose 70 percent, you need 233.3 percent.

    I computed these in Python and rounded to one decimal place. There is no forecast in them and no assumption about gold, the dollar or anything else. It is the same arithmetic whether you trade metals, currencies or nothing at all.

    What this tells you is that damage is not linear, so caution should not be linear either. The cost of a bad month is not the money, it is the months of competent trading you now have to spend undoing it. A trader down 50 percent is not halfway to recovery. They are facing a task most people never complete, which is why the account that reaches 50 percent down so rarely comes back.

    The practical consequence is that the whole game is played in the shallow end of that table. Keeping your worst stretch inside 10 or 15 percent is not timidity. It is the thing that keeps recovery a routine matter rather than a heroic one. That is the reasoning behind the risk management guide that sits underneath everything else on this site, and it is why how much to risk per trade is the first number worth settling.

    The leak you can measure before you place a trade

    The second thing that quietly drains accounts is not a bad call. It is the cost of doing business, multiplied by how often you do it.

    Every trade crosses the spread, which means you begin every position slightly behind. That is not a scandal, it is how dealing works, and I explain the mechanism in more detail in what the spread in gold trading actually costs you. What surprises people is the size of it once you multiply by frequency.

    Let me do it with numbers you can change. Assume an account of 5,000 dollars, risking 1 percent per trade, which is 50 dollars. Assume a stop distance of 5 dollars in gold, which puts the position at 10 ounces. Assume a dealing spread of 30 cents. Those are my assumptions, not measurements, and your broker and your stop distance will move them.

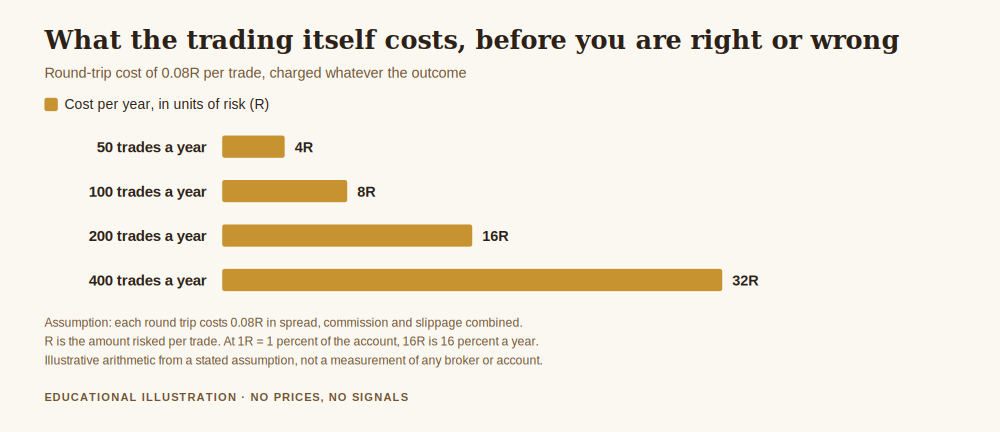
    On those numbers, the spread costs 3 dollars per round trip. That is 6 percent of the money you put at risk, gone before the market has done anything at all. Now multiply by frequency across a year:

    • 1 trade a week, 52 a year: 156 dollars, or 3.1 percent of the account.
    • 2 trades a week: 312 dollars, or 6.2 percent.
    • 4 trades a week: 624 dollars, or 12.5 percent.
    • 10 trades a week: 1,560 dollars, or 31.2 percent.
    • 20 trades a week: 3,120 dollars, or 62.4 percent.

    The trader taking twenty trades a week has to be right enough to overcome a headwind of more than 60 percent of their capital per year, purely in dealing costs. They usually describe their problem as a strategy problem. It is an arithmetic problem, and no strategy fixes it, because the cost is charged on activity rather than on accuracy.

    This is the most encouraging finding in the whole article, because frequency is entirely yours to set. You do not need a better forecast to cut that number. You need fewer, more deliberate trades, and the saving is guaranteed rather than hoped for. It is also why who you trade through is a decision worth taking seriously rather than settling in five minutes.

    The loss that is not a market loss at all

    There is a category of losing money that has nothing to do with trading, and it is larger than most people imagine.

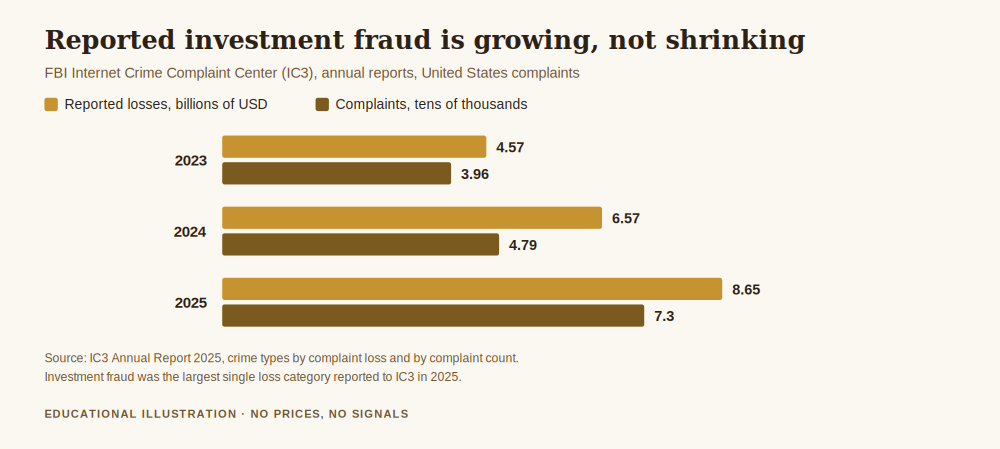
    The FBI’s Internet Crime Complaint Center publishes an annual report of what the American public actually reports losing. In its 2024 Internet Crime Report, total reported losses came to 16.6 billion dollars across 859,532 complaints. The single largest crime type by loss was not ransomware, not romance fraud, not tech support scams. It was investment fraud, at 6,570,639,864 dollars.

    Investment fraud alone accounted for close to 40 percent of every dollar reported lost to internet crime that year. And the shape of it is familiar to anyone who has spent time in trading communities: a mentor with screenshots, a managed account promising a monthly return, a signal group where the wins are posted and the losses are not, a platform where deposits work smoothly and withdrawals develop problems.

    I raise it because someone asking how to avoid losing money in forex trading is often, statistically, one bad decision away from a loss that no amount of risk management touches. Position sizing does not protect you from handing your capital to someone who has no intention of giving it back. Two habits do most of the work: never send money to an individual, and treat any promised return as disqualifying rather than attractive. A real market cannot promise a number, so anyone who does is telling you they are not operating in one.

    What actually moves the odds

    Put the three sections together and you get a short list that does not require you to predict anything.

    Keep the worst stretch shallow, because the recovery curve is unforgiving and the cost of a deep drawdown is measured in months rather than money. Trade less often than feels natural, because the cost of activity compounds against you whether you are right or wrong. Refuse anything that promises a return, because the largest single category of reported loss is not the market at all.

    None of that is a strategy, and that is the point. It is the floor a strategy stands on. Traders who skip the floor spend their first years discovering these numbers the expensive way, one account at a time, usually concluding that they need a better system when what they needed was a smaller size and a slower week. I have written elsewhere about the loop that keeps repeating when the floor is missing, and it is remarkably consistent from trader to trader.

    The uncomfortable part is that none of this is fast. The arithmetic rewards patience and punishes urgency, and urgency is exactly what most people bring to a new account. If you are opening one, how to open a gold trading account walks through the practical setup, but the numbers above matter more than any of those choices.

    A quick word before the questions

    If this is the kind of explanation you find useful, the Gold Empire Telegram channel is where I post market context through the week, in plain language and without pretending anyone knows what happens next. The free Gold Survival Sheet is a one page checklist built around exactly these numbers, so the arithmetic is in front of you before you size a position rather than after.

    Free gold survival sheet

    Get the free Gold Empire survival sheet, a one-page guide to protecting your account through the kind of market this article describes. One email, no spam, unsubscribe anytime.

    Get the free survival sheet →

    Frequently asked questions

    Is it actually possible to avoid losing money in forex trading?

    Not entirely, and anyone telling you otherwise is selling something. Losses are a normal operating cost of the activity. What is realistic is avoiding the losses that are structural rather than market driven: oversized positions, excessive frequency, and outright fraud. Those three are where most of the damage lives, and all three are inside your control.

    Why do most retail traders lose money?

    Regulators looking at real accounts found 74 to 89 percent of retail accounts losing. The common threads are leverage used to take size the account cannot absorb, trading frequency that multiplies dealing costs, and a recovery curve that turns a moderate drawdown into a problem that outlasts the trader’s patience.

    Does trading more often improve my chances?

    It reliably increases your costs and it does not reliably increase your edge. On the assumptions above, moving from one trade a week to ten multiplies the annual spread bill from about 3 percent of the account to more than 31 percent. That is a headwind you have to beat before you profit at all.

    How big a drawdown is too big?

    There is no universal figure, but the arithmetic gets punishing fast beyond 20 percent, where you already need 25 percent to recover. Past 50 percent you need to double what is left. Most traders find that setting a ceiling in advance, while calm, is the only version of this decision they can actually keep.

    How can I tell if a signal service or mentor is a scam?

    The clearest tell is a promised return, because no honest participant in a market can promise one. After that: pressure to deposit quickly, payments to an individual rather than a regulated firm, withdrawals that develop friction, and a public record that shows wins but not losses. Investment fraud was the largest single category of reported internet crime loss in 2024, so the base rate justifies the suspicion.

    Do I need a bigger account to be safe?

    A bigger account does not change the percentages, it only changes the currency amounts. What a bigger account does buy is the ability to take a sensible percentage risk while still trading a position size the platform supports. The percentages in this article behave identically at any account size.

    Where this leaves you, and what we do about it

    The honest summary is that avoiding losses is mostly a bookkeeping discipline dressed up as a market skill. The recovery curve, the cost of frequency and the base rate of fraud are all knowable in advance, and none of them require an opinion about where gold goes next. Getting them right will not make you money on its own. Getting them wrong will reliably take money from you regardless of how good your analysis is.

    Gold Empire is a free Telegram channel where we work through market context together, in public, including the days the read does not work out. There is no promise of profit here, because there cannot honestly be one. What there is, is a group of people trying to stay in the game long enough for competence to matter.

    If this was useful, the free Gold Survival Sheet is the natural next step. It is a one page checklist covering the size, the cost and the ceiling before you enter, and it is free to download with nothing to join.

    About the author. Matthew writes the Gold Empire market notes. He spends most of his time on the unglamorous half of trading, position size, dealing costs and the arithmetic of recovery, on the view that surviving the first two years is what makes the rest of it possible.

    Disclaimer: This article is general educational content about how leveraged markets work. It is not financial advice and it is not a recommendation to buy or sell anything. Trading leveraged products carries a high risk of losing money rapidly. No entry, stop or target discussed should be treated as a signal. Figures attributed to external sources are linked so you can check them, and figures I have calculated are shown with the assumptions they rest on so you can change them.


  • What Is Swap in Gold Trading, and What Does Holding Overnight Cost?

    What Is Swap in Gold Trading, and What Does Holding Overnight Cost?

    There is a line on your account statement that most traders never read, and it is the only cost that grows while you sleep. It is usually called swap, sometimes rollover, sometimes overnight financing. Whatever your broker calls it, swap in gold trading is the charge for keeping a leveraged position open past the daily cut-off, and it is the reason a trade that looked right can still finish behind.

    Almost nobody explains it to beginners, partly because it is boring and partly because it is unflattering. So here it is: what it actually is, why it exists, what it costs, and the one feature of it that surprises people every single week.

    Chart of nightly swap in gold trading as a share of posted margin across different leverage levels
    What swap in gold trading costs each night, as a share of the money you actually posted.

    What swap in gold trading actually is

    When you open a leveraged gold position, you are not paying for the whole thing. You post margin, a fraction of the position’s value, and your broker effectively finances the rest. That financing is a loan, and loans have interest.

    Swap is that interest, charged or occasionally paid, once per night, for as long as the position stays open. Close before the cut-off and you never see it. Hold for six weeks and you have paid it forty-two times.

    The rate is not arbitrary. It is built from short-term interest rates, plus your broker’s markup. The anchor underneath it is the overnight lending rate, which the Federal Reserve describes as the interest rate at which depository institutions lend reserve balances to other depository institutions overnight. When that rate is high, financing everything is more expensive, and the cost lands on you.

    One consequence worth stating plainly: because the rate depends on the direction you are holding and on your broker’s markup, swap can be a credit rather than a charge in some conditions. It usually is not, and you should never plan around receiving it. Check your own broker’s table rather than assuming anything from this article.

    The part that catches people: it is charged on the whole position

    Here is the mechanic that makes swap bigger than it looks.

    Financing is calculated on the full value of the position, not on the margin you posted. Your margin is what you risked. The position is what is being financed. Those two numbers are different by exactly your leverage.

    So the cost as a share of your own money is the annual rate multiplied by your leverage, divided by 365. That is the arithmetic behind the chart above, and the numbers are uncomfortable.

    At 10 times leverage and a 4 percent annual financing rate, one night costs about 0.11 percent of your margin. Barely noticeable. At 50 times leverage, the same rate costs about 0.55 percent of your margin per night. At 100 times leverage and 8 percent, it is roughly 2.19 percent of your posted money, every night, before the market has done anything at all.

    This is the honest counterweight to everything appealing about leverage, and it is why I wrote separately about what leverage actually is in gold trading. Leverage does not just multiply your profit and your loss. It multiplies your rent.

    The Wednesday surprise

    Now the feature that catches almost every new trader exactly once.

    Markets settle over two business days, so a position held over the weekend still accrues financing for Saturday and Sunday even though nothing trades. Brokers handle this by booking three nights of financing on a single weekday, most commonly Wednesday.

    The practical result is that a position held from Monday to Monday is charged for seven nights, not five. And if you happen to be holding across that one particular day, you get a charge roughly three times the size you have been seeing, on a day when nothing unusual happened.

    At a 4 percent annual rate, a full week of financing is about 0.077 percent of the position value. On 50 times leverage that is about 3.8 percent of your margin per week, purely for the privilege of still being in the trade.

    Nothing about this is hidden or improper. It is standard practice and your broker publishes the table. It just arrives as a surprise to anyone who never looked, which is most people.

    What it does to a winning trade

    The number that changed how I think about holding periods is this one.

    Suppose a trade eventually moves 2 percent of the position value in your favour, which for a leveraged account is a substantial win. Now suppose you held it for thirty days to get there.

    At a 2 percent annual financing rate, the cost over those thirty days is about 0.164 percent of the position, which is roughly 8 percent of your gain. At 4 percent it is about 16 percent of your gain. At 8 percent, financing has eaten nearly a third of the entire move before you count spread or commission.

    Push it further and the picture gets starker. At a 4 percent annual rate, financing equals a 2 percent target after about 182 days. If your thesis takes longer than that to play out, the financing has consumed the whole idea even if you were completely right about direction.

    That is not an argument against holding positions. It is an argument for knowing the clock is running, and for matching your holding period to your method rather than drifting into a long hold because you did not want to take a loss.

    It also quietly changes how you should think about waiting for a scheduled event. If you are carrying a position for a week because you want to be positioned before something like the monthly jobs report, the waiting itself has a price. That does not make it a bad decision. It makes it a decision with a cost attached, which is a different thing from a free one.

    The uncomfortable footnote to break-even stops

    This connects directly to something I wrote about recently, and the connection is not flattering.

    When you move your stop to your entry price, the trade is often described as risk-free. I already argued in the piece on what a break-even stop really protects that this is imprecise because of slippage and gaps. Financing adds a third reason.

    A position stopped out at exactly your entry price, after being held for two weeks, is not a break-even trade. It is a small loss, equal to the spread you paid on the way in plus every night of financing since. The screen says zero. The account says otherwise.

    For a day trade this is negligible. For a position carried for weeks at meaningful leverage, “break-even” can quietly be a real cost, and it will not appear anywhere in your win-loss statistics if you record that trade as a scratch.

    Where swap sits among your other costs

    It helps to see the full picture, because traders tend to obsess over one cost and ignore the others.

    • Spread is paid once, on entry and exit. It punishes frequency. I covered it in detail in what the spread is in gold trading.
    • Commission, where charged, also scales with frequency.
    • Swap is paid nightly. It punishes duration.

    That is the useful way to hold it in your head. Trading often is expensive in spread. Holding long is expensive in financing. A method that does both, many trades held for weeks, pays on both counts, and very few people ever add up the total.

    It also means swap is a genuine reason to care which broker you use, alongside execution quality. Financing rates and markups vary considerably between firms, and unlike spread, the difference compounds every night you stay in. It is one of the concrete things worth comparing when choosing a broker for gold trading.

    What to actually do about it

    Nothing exotic, and none of this is an instruction about what to trade.

    Find your broker’s swap table before you need it. It is published, usually buried in the contract specifications, and it lists the charge per lot per night for long and short separately. Knowing the number turns an invisible cost into a line item you can plan around.

    Know which day carries the triple charge on your account, because it is not the same everywhere. If you routinely hold positions for several days, that single fact changes your cost more than most of the things people spend their evenings optimising.

    And add financing to your trade record. If you hold anything beyond a day, the honest result of that trade includes the nights you paid for. A journal that records only price movement is telling you a slightly flattering story, and the flattery grows with your holding period.

    All of which is really one idea, the same one underneath everything on this site: the costs you do not measure are the ones that decide whether you are still here in a year. That is the argument I make at length in the risk management guide.

    A quick word before the questions

    If this is the kind of detail you find useful, the Gold Empire Telegram channel is where I post market context through the week, free, with no upsell. The free Gold Survival Sheet covers sizing and the costs worth checking before you open anything.

    Free gold survival sheet

    Get the free Gold Empire survival sheet, a one-page guide to protecting your account through the kind of market this article describes. One email, no spam, unsubscribe anytime.

    Get the free survival sheet →

    Frequently asked questions

    What is swap in gold trading in simple terms?

    It is the interest charged for holding a leveraged position overnight. Because you only posted part of the position’s value as margin, the rest is effectively financed, and swap is the nightly cost of that financing. Close the position within the day and you do not pay it.

    Why does Wednesday cost three times as much?

    Because settlement takes two business days, so weekend financing has to be collected on a weekday. Most brokers book three nights on Wednesday, though the specific day varies by firm, so check yours rather than assuming.

    Can swap ever pay me instead?

    In some conditions and directions it can be a credit rather than a charge, depending on rates and your broker’s markup. It would be unwise to build a plan around it, because the rate can change, the markup usually works against you, and a strategy that depends on receiving financing is exposed to something you do not control.

    Does swap apply if I close the same day?

    No. The charge is applied at a daily cut-off time, so positions opened and closed inside that window are not financed. This is one genuine cost advantage that shorter holding periods have, though they pay more in spread instead.

    How do I find my own swap rate?

    It is in your broker’s contract specifications, listed per lot per night with separate figures for long and short. If you cannot find it easily, that is itself worth noticing. A firm that makes its costs hard to locate is telling you something.

    Is swap a reason to avoid holding positions for weeks?

    Not by itself. It is a reason to know what the holding period costs and to check that your expected move is large enough to justify it. A method built on multi-week holds can absolutely work, provided the financing is in the calculation rather than discovered afterwards.

    Where this leaves you, and what we do about it

    Swap is a good example of the kind of thing that separates traders who last from traders who do not, and it has nothing to do with skill at reading charts. It is just a cost, published openly, that most people never look up, and that quietly rearranges their results over a year.

    You cannot control the rate. You can control how long you sit in a financed position, and whether the number is in your plan or a surprise on your statement.

    Gold Empire is a free Telegram channel where we work through market mechanics in public. There is no promise of profit here and there never will be, because nobody can honestly make one. What we can do is make sure the machinery is visible to you before it costs you money.

    If this was useful, the free Gold Survival Sheet is the natural next step. It is a one page checklist covering position size, stop placement and the costs worth checking before you open anything. It costs nothing and it does not require you to trade anything.

    About the author. Matthew writes the Gold Empire market notes and has spent his time in this market mostly learning what not to do. He is not a licensed adviser and does not want to be one. His interest is in the part of trading nobody posts screenshots of: staying in the game long enough for a method to matter.

    Disclaimer: This article is general educational content about trading costs. It is not financial advice, not a recommendation, and not a solicitation to trade. All cost figures are illustrations computed from stated assumptions across a range of rates, and are not quoted rates from any broker. Check your own broker’s published contract specifications. Trading leveraged products carries a high risk of losing money rapidly. No entry, stop or target discussed should be treated as a signal. Consider your own circumstances and seek independent regulated advice if you need it.


  • How to Get Signals for Forex Trading (and What Actually Decides the Outcome)

    How to Get Signals for Forex Trading (and What Actually Decides the Outcome)

    If you are searching for how to get signals for forex trading, I can answer the literal question in about thirty seconds, and then I want to spend the rest of this article on the part that actually decides what happens to your account. Because the getting is easy. Almost everyone gets that part right. It is the ninety seconds after the signal lands on your phone that separates the traders who are still here next year from the ones who are not.

    I run a gold signal channel. I am aware of how it sounds for me to tell you that signals are the least important input in this business. I am telling you anyway, because I blew up accounts of my own while holding a list of perfectly reasonable trade ideas, and the ideas were never the problem.

    How to Get Signals for Forex Trading, the Easy Part

    There are only a handful of routes, and none of them are hard to find.

    Free public channels

    Telegram, Discord and X are full of them. You join, and setups appear. This is the cheapest option and the most crowded one. The trade-off is that you usually cannot see a full history, the person posting has no obligation to you, and the incentive is to post frequently rather than to post well.

    Paid subscription services

    You pay monthly for a smaller room, and usually you get more explanation attached to each idea. The money changes the incentive slightly for the better, because now they have to keep you. It also changes it for the worse in one specific way: a service with nothing to show you this week is still charging you this week, which quietly pressures them to manufacture activity.

    Copy trading and signal marketplaces

    Platforms that connect your account to somebody else’s and mirror their trades automatically. The appeal is obvious. The catch is that the position size is decided by an algorithm reading your balance, not by anyone who knows what else you have going on in your life this month.

    Broker-provided research and autochartists

    Many brokers bundle in a signal tool. It is free, it is convenient, and it is generated by software scanning for patterns. Treat it as one more opinion rather than a decision.

    That is the complete map. You can be receiving forex signals within five minutes of finishing this paragraph, at no cost. Which is exactly why the ability to get signals has never been what separates a surviving account from a dead one.

    How to get signals for forex trading, the same signal list with three different risk levels leaves very different accounts
    The same signals, three risk settings: what is left of the account after nine losing trades in a row.

    The Same List, Three Different Accounts

    Here is a piece of arithmetic that took me far too long to take seriously.

    Imagine three traders in the same room, reading the same channel, taking every single call at exactly the same moment. Identical entries. Identical exits. The only difference between them is how much of the account each one puts at risk on a trade.

    Now hand all three of them the same losing run, nine trades that do not work. This happens. It happens to good processes.

    • The trader risking 1 percent per trade finishes that run with 91.4 percent of the account intact.
    • The trader risking 5 percent finishes with 63.0 percent.
    • The trader risking 10 percent finishes with 38.7 percent.

    I calculated those figures directly, assuming fixed fractional risk, nine consecutive losses and no trading costs. You can reproduce them in a spreadsheet in a minute. The assumptions are simple on purpose, because the point does not need complexity to hold.

    Three traders. One signal provider. One set of trades. The first one has had an annoying fortnight. The third one now needs to more than double what is left simply to get back to where they started, and they will be trying to do that while frightened, which is the worst possible condition for decision making.

    The signal was identical in all three cases. The signal was not the variable. It never was.

    This is why I keep pointing people back to the one rule that keeps you in the game before they ask me anything about entries, and why how much to risk per trade matters more than any setup I could hand you. If you want the mechanics of turning a percentage into an actual lot size, position sizing for gold covers it.

    How Many Trades Before a Win Rate Means Anything

    Somebody advertises a 60 percent win rate. You want to know whether that is real or whether it is a coin flip with good marketing. This is a question statistics can answer precisely.

    Suppose the honest baseline is 50 percent, and you want to be reasonably confident that a claimed 60 percent is genuinely better than that, rather than an ordinary run of luck. Running the exact binomial test, at a 5 percent significance level and 80 percent power, you need roughly 158 trades before the difference can be distinguished from noise. If you want to be more confident than that, the number climbs past 200.

    Sit with that for a second. One hundred and fifty-eight trades. Most signal services have not shown you anything like that many verified results, and most subscribers make up their mind after about a dozen.

    Twelve trades is nothing. Twenty trades is nothing. A screenshot of a good week is worse than nothing, because it was selected precisely for being good. The honest position, after a month of following anyone, is that you still do not know very much, and any confidence you feel is manufactured.

    I would rather tell you that than sell you certainty I cannot back up.

    A Losing Run Is Not Proof of a Bad Signal

    The reverse error is just as expensive, and I see it constantly.

    Take a process that genuinely wins 55 percent of the time. Good, not spectacular, better than most. Over 100 trades, the probability of hitting a run of at least six losses in a row somewhere along the way is about 36 percent. Roughly a one in three chance. A run of eight straight losses still shows up about 8 percent of the time.

    Again, calculated directly, assuming independent trades and a fixed win rate. Real trading is messier, but messier tends to make streaks more likely, not less.

    So a six-loss streak is not evidence that something broke. It is an ordinary feature of a working process. Yet this is the exact moment when most people cancel the subscription, double their size to catch up, or go looking for a different channel. They quit a functioning process during a statistically unremarkable bad patch, and then repeat the cycle somewhere else.

    If you have lived through this, trading after a losing streak deals with the psychology of it, and the quiet loop that drains accounts maps how the cycle actually runs.

    If you want the setups, they are free. I post gold ideas daily on the Gold Empire Telegram channel, with the reasoning attached rather than just a level.

    And if you would rather fix the part that actually decides your outcome, take the free Survival Sheet instead. It is one page, it costs nothing, and it is the thing I wish someone had put in front of me first.

    How to Check Who You Are Actually Following

    If you are going to pay someone, or hand them influence over your money, spend twenty minutes on this. It is the least glamorous part of the job and the highest return on time you will find.

    Check the registration before you check the results

    In the United States, the CFTC maintains a public tool for exactly this purpose, and it takes a couple of minutes to use. You can look up whether a firm or an individual is registered, and whether there is a disciplinary history attached to them, through the CFTC’s check tool. Other jurisdictions run their own equivalents. Someone who is legitimately in this business will not mind you looking. Someone who minds has told you something useful.

    Understand the modern version of the con

    The old warning signs were bad grammar and obviously fake screenshots. Those are gone. The CFTC has published an advisory on how criminals now use generative AI, warning that they create “false images, voices, videos, live-streaming video chats, social media profiles, and malicious websites designed to look like financial trading platforms”, and that AI now cleans up the language errors that “may have raised suspicions in the past”. The advisory specifically flags fake profiles aimed at people looking for “friendship, trading information, or advice”. You can read it in full on the CFTC advisory page.

    Which means the surface has stopped being evidence. A polished website, a confident voice on a call, a track record chart, a room full of people agreeing with each other: all of that can now be produced cheaply by someone who has never traded anything.

    The questions worth asking

    • Are results published before the outcome is known, or only afterwards?
    • Are losing trades posted with the same visibility as winning ones?
    • Is anyone telling you what to risk, or only what to buy?
    • Does anyone guarantee a return, or describe an outcome as certain? Nobody honest does this.
    • Are you being rushed? Urgency is a sales technique, not a market condition.

    One more, and it is the one people skip: where is your money actually held? A signal provider should never be holding your funds. If the person giving you ideas is also the person you deposit with, you have a problem that no win rate can fix. Choosing a broker for gold trading covers what to look for, and opening an account properly walks through doing it in your own name.

    What a Signal Cannot Tell You

    A signal is a sentence about the market. It is not a sentence about you, and the gap between those two things is where accounts die.

    It does not know your account balance. It does not know that you are already holding two other positions in the same direction, so that what looks like three trades is really one large bet wearing three costumes. It does not know that your rent is due, that you lost money yesterday and are trying to get it back, or that you are reading this at work and will not be able to manage the position for the next four hours.

    It also cannot tell you what to do when the trade goes sideways, which is most of the time. A level is a starting point, not a plan. What happens after you are in is a separate skill, and managing a gold trade after you enter is the part almost nobody teaches, because it is far less exciting than the entry.

    Two more that matter for gold specifically. First, cost: a trade that looks flat can still be losing money overnight, and a stop moved to break even is often not actually break even once financing is counted. Second, timing: a signal that arrives ten minutes before a major economic release is a different proposition to the same signal on a quiet Tuesday, and what nonfarm payrolls does to gold explains why that gap matters.

    How I Would Use a Signal Channel If I Started Again

    Not as instructions. As a reading list.

    When a setup appears, the useful question is not “should I take this”. It is “why does this person think that”. If the reasoning is given, you get to compare your read of the chart against someone else’s, and disagree sometimes, and find out later who was closer. That is how you build judgement rather than dependency. If the reasoning is never given, you are not learning anything. You are just outsourcing, and the day the channel goes quiet you will be exactly where you started.

    The practical version looks like this. Decide your risk per trade before you look at anything. Take fewer of the ideas rather than all of them. Write down why you took the ones you took. Review that record monthly against your own notes, not against the provider’s marketing. And size every position as though the next nine are going to lose, because sometimes they are.

    To be completely clear, and this applies to my channel as much as anyone else’s: no entry, stop or target discussed should be treated as a signal.

    Free gold survival sheet

    Get the free Gold Empire survival sheet, a one-page guide to protecting your account through the kind of market this article describes. One email, no spam, unsubscribe anytime.

    Get the free survival sheet →

    Frequently Asked Questions

    Are free forex signals worse than paid ones?

    Not automatically. Price tells you about a business model, not about quality. Some free channels are run by people who trade their own ideas and post them as a byproduct. Some expensive ones are marketing operations. What matters is whether losses are shown, whether reasoning is attached, and whether anyone is talking to you about risk.

    How long should I follow a signal provider before deciding?

    Longer than feels necessary. As shown above, distinguishing a genuine 60 percent win rate from a coin flip takes around 158 trades. You will probably not wait that long, and that is understandable, but you should at least stop pretending that twenty trades told you something.

    Can I just copy the trades automatically?

    You can, and the position sizing is then decided by software that knows nothing about your circumstances. If you use copy trading, the risk settings are the part to obsess over. Everything else is somebody else’s decision applied to your money.

    What is the single biggest mistake people make with signals?

    Changing size based on confidence. Feeling sure about a trade because it came with a detailed explanation, and quietly doubling up. Confidence is not information, and the market has no idea how sure you were.

    Does a signal service need to be regulated?

    Rules vary by country, and pure education sits in a grey area in many of them. The check is still worth doing. Look up the name, look for a disciplinary history, and be far more careful with anyone who also wants to hold your deposit.

    Where This Leaves You

    Gold Empire is a free channel. I post gold setups with the reasoning attached, most days, and you can follow along on Telegram without paying for anything. There is a Survival Kit for people who want the structured version of the risk work, and it is entirely optional. The free channel is not a trial of it, and I am not going to pretend that people who pay get better market conditions.

    If you take one thing from this article, take the free Survival Sheet. One page, no cost, no promises about returns. It is about the only part of this business you can actually control.

    About the Author

    I am Matthew. I traded gold badly for a long time before I traded it acceptably, and the turning point had nothing to do with finding better setups. I had good setups for years while my account went in one direction. What changed was that I finally accepted that the size of the bet was the whole game, and that my job was to still be here in twelve months rather than to be right this afternoon. I run the Gold Empire channel now, which means I spend a lot of my week talking people out of the exact mistakes I made. More about how I work.

    Risk disclaimer: This article is educational and is not financial advice, not a recommendation, and not an offer to trade. Trading gold, CFDs and leveraged products carries a substantial risk of loss and is not suitable for everyone. Most retail accounts lose money. The figures in this article are either self-calculated illustrations with their assumptions stated, or are taken from the cited public sources, and none of them are a forecast. No entry, stop or target discussed should be treated as a signal. Never risk money you cannot afford to lose.


  • What a Break-Even Stop Really Protects, and What It Costs

    What a Break-Even Stop Really Protects, and What It Costs

    When a trade moves your way, there is a moment where the sensible thing seems obvious: pull the stop up to your entry price so the trade can no longer lose. That move has a name. It is a break-even stop, and you will see it announced in every trading room on earth, usually with a phrase like “capital is now protected”.

    We say something close to that ourselves when a position earns it. I want to spend this article being precise about what that phrase means, because it is roughly true, it is not exactly true, and the difference between roughly and exactly is where people quietly lose expectancy for years without noticing.

    This is not an argument against moving your stop. It is an argument against believing the move is free.

    Chart showing when a break-even stop improves expectancy and when it reduces it
    A break-even stop changes your expectancy in both directions. Which way depends on your setup.

    What a break-even stop actually is

    You enter a trade with a stop below your entry, risking some fixed amount. Price moves in your favour. You then move the stop up to the price you entered at. From that point, if price comes back to where you started, you exit with nothing gained and nothing lost, minus costs.

    The appeal is emotional and immediate. The trade can no longer hurt you. You stop watching it with your stomach. For a lot of people this is the single most calming action available in trading, and I am not going to pretend that has no value, because managing your own state is part of the job.

    But notice what has actually happened. You have not removed risk from the trade. You have exchanged one risk for another. The risk of losing 1R has been swapped for the risk of being taken out of a trade that was going to work.

    Why “zero risk” is not quite right

    Two things stop a break-even stop from being the guarantee it sounds like.

    The first is mechanical. A stop is an instruction to leave at the market once your price is touched. It is not a promise about the price you will get. In a thin or fast market, price can pass through your level and fill you somewhere worse. That is not a rare edge case, it is normal behaviour around scheduled news and at the edges of the trading day.

    The second is the weekend and the gap. If the market closes and reopens somewhere else entirely, your stop was not sitting there defending anything, because there was no market for it to act in. I went through this in detail in the piece on weekend gaps in gold trading, and it is the cleanest proof that a stop level is an instruction rather than a shield.

    Regulators have effectively conceded this point. When European authorities intervened in leveraged retail products in 2018, one of the measures they introduced was to ensure that investors cannot lose more money than they put in. That protection had to be legislated. If stop orders reliably capped losses at the level people set them, there would have been nothing to legislate.

    So “capital is now protected” is a fair shorthand for “most of the downside on this position has been removed”. It is not the same as “zero downside risk”, and the honest version is worth saying out loud.

    The part almost nobody calculates

    Now the more interesting question, and the reason I wanted to write this. Set aside slippage and gaps entirely. Assume the break-even stop works perfectly and takes you out at exactly your entry. Is it still a good idea?

    The answer is that it depends, and it depends on something you can measure rather than something you can feel. Here is the arithmetic, with every assumption stated so you can disagree with it.

    Take a setup that risks 1R and targets 3R, and assume it reaches that target 40 percent of the time. Left alone, the expectancy is 0.40 times 3, minus 0.60 times 1, which is plus 0.60R per trade.

    Now introduce the break-even stop. Two numbers decide everything:

    • How often a trade that would have won dips back to your entry first, and gets scratched at zero. Call it the winner pull-back rate.
    • How often a trade that would have lost comes back to your entry before hitting its original stop, and gets scratched at zero instead of costing you 1R. Call it the loser pull-back rate.

    The first number costs you 3R every time it happens. The second saves you 1R every time it happens. That asymmetry is the whole story, and it is why the answer is not obvious.

    Run the numbers and a clean condition falls out. On this setup, a break-even stop only improves your expectancy if your losers come back to entry at least twice as often as your winners do. If losers revisit entry 50 percent of the time and winners only 20 percent, expectancy improves from 0.60R to 0.66R. If both revisit entry 30 percent of the time, expectancy falls from 0.60R to 0.42R, a drop of about a third, for a change that felt like pure prudence.

    The general form is worth keeping. The ratio you need is your reward multiple times your win rate, divided by your loss multiple times your loss rate. The bigger your target, the more the break-even stop has to earn its place, because every winner it scratches costs you more.

    What that means in practice

    The useful conclusion is not “never move your stop” and it is not “always move it”. It is that the right answer is a property of your setup, not a rule you can borrow.

    Nobody can tell you from the outside whether your losers revisit entry more often than your winners. It depends on how you choose entries, how much room you give them, and what kind of market you trade in. It is knowable, but only from your own records.

    Which means the honest instruction is boring: go and look. If you keep a journal, you already have the raw material. For your last several dozen trades, mark whether price came back to your entry after moving in your favour, and whether that trade eventually worked or not. Two columns. If losers come back far more often than winners, the break-even stop is earning its keep. If both come back at similar rates, you are paying for comfort.

    This is the same principle behind everything in the risk management guide. Rules that sound universal are usually rules somebody derived from their own data and then presented as law.

    The reason people move to break even anyway

    I want to be fair to the practice, because there is a real argument for it even when the arithmetic is unfavourable.

    A trader who moves to break even and then sits calmly is a different trader from one who watches an open position with real money at stake and interferes with it. If the break-even stop costs you 0.18R of expectancy but prevents one panicked exit a month, it may still be the better choice for you as an operator. Expectancy on paper assumes you execute perfectly. You do not, and neither do I.

    That is a legitimate reason. Notice it is a completely different reason from “this removes risk”. One is an honest trade of expectancy for consistency. The other is a misunderstanding. Make the trade knowingly, and you are managing yourself well. Make it because you think it is free, and you are slowly paying for something you were never told the price of.

    There is also a middle path a lot of experienced traders end up on: move the stop to reduce risk rather than eliminate it, so a pull-back costs you a fraction of the original amount instead of scratching you at exactly zero. It keeps some of the protection without sitting your stop at the single most likely place for price to touch on its way up. I am describing what people do, not telling you to do it.

    Where this sits with the rest of trade management

    Moving a stop is one decision inside the larger job of running a position after you are in it, which I covered more broadly in how to manage a gold trade after you enter. And where you put the stop in the first place, before any of this comes up, matters more than any adjustment you make later. That is the subject of where to place a stop loss on XAUUSD.

    If your original stop is in a bad place, moving it to break even does not fix that. It just gives you a different way to be taken out.

    A quick word before the questions

    If this is the kind of thinking you find useful, the Gold Empire Telegram channel is where I post market context through the week, free, with no upsell. And the free Gold Survival Sheet is a one page checklist covering sizing and stop placement, which is the layer underneath everything in this article.

    Free gold survival sheet

    Get the free Gold Empire survival sheet, a one-page guide to protecting your account through the kind of market this article describes. One email, no spam, unsubscribe anytime.

    Get the free survival sheet →

    Frequently asked questions

    When should I move my stop to break even?

    There is no honest universal answer, and that is the point of this article. It depends on whether your losing trades return to your entry more often than your winning ones do, which is measurable in your own journal and different for every method. Anyone who gives you a confident number for this without seeing your records is guessing.

    Does a break-even stop really mean zero risk?

    No. It removes most of the downside on that position, which is worth having, but a stop is an instruction to exit at the market rather than a guaranteed price, and a closed market can reopen past your level. “Most of the risk is gone” is accurate. “No risk” is not.

    Why would moving to break even ever hurt me?

    Because your entry price is a level price often revisits on its way to your target. Every time it does, you are taken out of a trade that would have paid. If your target is three times your risk, each of those costs three times what a saved loser gains you.

    Is it better to move the stop partway instead?

    Some traders do exactly that, reducing risk without sitting at the most crowded price. It keeps part of the protection and scratches fewer good trades. Whether it suits you depends on your setup and on how you behave with an open position, so treat it as an option to test rather than an upgrade to adopt.

    Does this apply to trailing stops as well?

    The same logic applies with more force. A trail is a repeated version of the same decision, so it exits more winners early in exchange for locking in more of the moves that keep running. Whether that is a good exchange depends on how your particular market moves, which again comes back to your own records.

    What about the emotional benefit, does that count?

    Yes, genuinely. If moving to break even stops you interfering with trades, that is worth real expectancy, because a plan you actually follow beats a better plan you abandon. Just be clear with yourself that you are buying calm with expectancy, rather than getting something for nothing.

    Where this leaves you, and what we do about it

    The break-even stop is a good example of how trading advice goes wrong. Nobody is lying when they say capital is protected. It is a reasonable shorthand, said in good faith, and mostly accurate. But it hardens into a belief that the move is free, and once something feels free, nobody measures it.

    Almost everything that costs traders money over a career looks like this. Not a dramatic mistake, just a small unexamined assumption applied several hundred times.

    Gold Empire is a free Telegram channel where we work through market mechanics in public. There is no promise of profit here and there never will be, because nobody can honestly make one. What we can do is take the phrases everyone repeats and check whether they survive arithmetic.

    If this was useful, the free Gold Survival Sheet is the natural next step. It is a one page checklist covering position size, stop placement and the questions worth asking before you touch a live position. It costs nothing and it does not require you to trade anything.

    About the author. Matthew writes the Gold Empire market notes and has spent his time in this market mostly learning what not to do. He is not a licensed adviser and does not want to be one. His interest is in the part of trading nobody posts screenshots of: staying in the game long enough for a method to matter.

    Disclaimer: This article is general educational content about trade management mechanics. It is not financial advice, not a recommendation, and not a solicitation to trade. The expectancy figures are illustrations computed from stated assumptions, not measurements of any real strategy or account. Trading leveraged products carries a high risk of losing money rapidly. No entry, stop or target discussed should be treated as a signal. Past market behaviour does not predict future behaviour. Consider your own circumstances and seek independent regulated advice if you need it.


  • What Is Nonfarm Payrolls, and Why Does Gold React?

    What Is Nonfarm Payrolls, and Why Does Gold React?

    Every few weeks a single American statistic empties the order book, widens the spread and moves gold further in ninety seconds than it moved in the previous nine hours. That statistic is nonfarm payrolls, and if you have been trading gold for more than a month or two you have already been on the wrong side of one, probably without understanding what actually happened.

    This week is a heavy one for exactly that reason. The American calendar is stacked with labour market releases, and the payrolls report lands at the end of it. So this is a good moment to explain the machinery properly, because most of what gets said about this release in trading groups is wrong in a way that costs money.

    I am not going to tell you how to trade it. I am going to tell you what the number is, where it comes from, how precise it actually is, and why the honest answer to “what will gold do on payrolls day” is that nobody knows, including the people who sound most certain.

    Chart of monthly nonfarm payrolls changes against the survey margin of error, showing most months fall inside it
    Nonfarm payrolls: the monthly change against the survey’s own margin of error. Source: US Bureau of Labor Statistics.

    What nonfarm payrolls actually measures

    The Employment Situation report is published by the US Bureau of Labor Statistics. The headline everyone quotes, the payrolls number, is the estimated change in the number of people on American payrolls over the past month, excluding farm workers, the self employed, private household staff and a few other categories. That is where the slightly odd word “nonfarm” comes from. It is a leftover from an era when agricultural employment swung so violently with the seasons that leaving it in made the rest of the picture unreadable.

    The number is an estimate from a survey, not a count. The Bureau surveys roughly 119,000 businesses and government agencies each month, covering about 622,000 individual worksites, which together represent around 26 percent of all nonfarm payroll jobs. A second and completely separate survey of about 60,000 households produces the unemployment rate.

    Two surveys, two methods, two sets of numbers, released in the same document at the same minute. That alone should tell you the report is not the single clean fact it gets treated as.

    Why a metal cares about an American jobs number

    Gold does not care about employment. Gold cares about what employment does to interest rate expectations, and there the link is direct and official rather than a matter of opinion.

    The Federal Reserve has what is known as a dual mandate. In its own words, Congress has assigned it to conduct monetary policy “to support the goals of maximum employment and stable prices“. Employment is not one input among many. It is one of the two things the central bank is legally pointed at.

    So the chain runs like this. A jobs report changes the market’s view of how strong the labour market is. That changes expectations of what the Fed will do with rates. Rate expectations move the dollar and real yields. And gold, which pays no interest to anyone who holds it, becomes relatively more or less attractive as the return available on cash moves. That is the whole transmission, and it is the same chain I walked through in the piece on the FOMC and why gold reacts to it. Payrolls is not a competing story. It is one of the main pieces of evidence the committee is reading.

    This is why a strong jobs number often pressures gold and a weak one often supports it. Note the word “often”. It is not a rule, and later in this article you will see why treating it as one is how people get hurt.

    The number everyone quotes is one of four

    Open the report and you will find that the headline payrolls figure sits alongside several other numbers that regularly matter more.

    • The payrolls change itself. The number that flashes on every screen.
    • Revisions to the previous two months. The Bureau states plainly that “the prior 2 months are routinely revised to incorporate additional sample reports and recalculated seasonal adjustment factors.”
    • The unemployment rate, which comes from the household survey, not the business survey, and can move in a direction that appears to contradict the headline.
    • Average hourly earnings. Wage growth feeds directly into the inflation half of the Fed’s mandate, and in some months this is the line the market actually trades.

    A trader who has decided in advance that “strong number equals gold down” is reading one line of a four line document. It is entirely normal for payrolls to beat expectations while the prior two months are revised down by more than the beat, which means the level of employment is now lower than the market believed five minutes ago. The headline was green. The information was red.

    What the margin of error does to the headline

    This is the part almost nobody mentions, and it is the single most useful thing in this article.

    Because payrolls is a survey estimate, it carries sampling error, and the Bureau publishes how much. In its technical note it states that “the confidence interval for the monthly change in total nonfarm employment from the establishment survey is on the order of plus or minus 122,000” at 90 percent confidence.

    Sit with that number for a second. It means that when the report says employment rose by 90,000, the survey itself cannot distinguish that from zero with 90 percent confidence. It also cannot distinguish it from 200,000.

    I pulled the official series from the Bureau’s public data service and checked how often that matters. Over the 24 months to June 2026, the average absolute monthly change was about 91,000. Fifteen of those 24 months, that is 62 percent of them, reported a change smaller than the survey’s own margin of error. Those are the faded bars in the chart above.

    To put the scale in perspective: total nonfarm employment is running near 159 million. A typical monthly change of 91,000 is under six hundredths of one percent of that level. We are watching a small difference between two very large estimated numbers, and then trading it in the first second.

    Now, I want to be careful and fair here, because the wrong conclusion is easy to draw. This does not mean the data is worthless. The direction over several months carries real information, the level is meaningful, and the Fed is genuinely reading it. What it means is narrower and more practical: a single month’s headline is a noisy estimate, and a “miss” of 40,000 against forecast is statistical noise being reported as news. The market will still react to it. That reaction is real and it will move your position. But the confidence some people project about what the number means is not supported by the number itself.

    Why the revisions matter more than the release

    Follow the logic of that margin of error one step further and the revisions stop being a footnote.

    The first print of any month is the estimate with the least data behind it. More responses arrive over the following two months, and the Bureau updates the figure accordingly. So the number the market violently repriced on the first Friday is, by design, the least reliable version of that month’s employment picture, and the more accurate version arrives quietly weeks later when nobody is watching.

    There is a lesson in that which goes well beyond this one release. The market’s biggest reaction happens at the moment of maximum uncertainty, not the moment of maximum information. That is not a flaw you can exploit. It is simply the shape of the thing, and knowing it should make you humbler about the first ninety seconds rather than more excited about them.

    What the release window does to your account

    Whatever you believe about the number, the mechanical conditions during the release are hostile, and this part is not a matter of interpretation.

    Liquidity thins out before the print as market makers pull back. Spreads widen, sometimes dramatically, which I covered in more detail in the article on the spread in gold trading. Price can move through a range in a single tick with nothing traded in between. And that last point is the one that hurts people, because a stop loss is an instruction to exit at the market once your level is touched, not a promise of the price you will get. In a fast market it can fill materially worse than where you placed it.

    This is worth being blunt about. If your risk plan assumes your stop fills exactly where you put it, your actual risk on a payrolls Friday is larger than the number in your head. That is not a reason to trade without a stop, which would be far worse. It is a reason to size as though the stop might slip, and it is one of the reasons execution quality and who you trade through matters more on these days than on any other.

    None of this is exotic. It is the same set of conditions I described in the general guide to trading gold through high impact news, and payrolls is simply the clearest monthly example of it.

    How careful traders treat a payrolls Friday

    I am not going to give you an entry, and I would be suspicious of anyone who does. What I can describe is how people who are still trading after several years tend to behave around this release. There are broadly three approaches, and all three are legitimate.

    The first is to be flat. Close what you have before the release, sit it out, and come back when spreads normalise. This is not cowardice and it is not missing out. Choosing not to have an opinion during the least predictable minutes of the month is a decision with a real edge behind it, and plenty of consistently profitable traders do exactly this every month.

    The second is to already be positioned, with size chosen specifically so that a violent move against you is survivable rather than terminal. The key word is “already”. The position was taken for reasons that existed before the release, and the release is a risk to be endured rather than the reason for the trade.

    The third is to wait. Let the print land, let the first reaction happen, let the fake move in the wrong direction burn itself out, and only then consider whether the market has told you something. The cost of this approach is that you never get the best price. The benefit is that you are reacting to what happened rather than betting on what might.

    What all three share is that the decision was made in advance, calmly, and the position size was set so that being wrong is affordable. That is the whole discipline, and it is the same one described in the risk management guide that underpins everything else on this site.

    What none of them involve is deciding at 13:29 to take a large position because you have a feeling about the number.

    A quick word before the questions

    If this is the kind of explanation you find useful, the Gold Empire Telegram channel is where I post market context through the week, free and with no upsell attached. And the free Gold Survival Sheet is a one page checklist for exactly these situations: how to size, where risk actually sits, and what to check before a scheduled event lands.

    Free gold survival sheet

    Get the free Gold Empire survival sheet, a one-page guide to protecting your account through the kind of market this article describes. One email, no spam, unsubscribe anytime.

    Get the free survival sheet →

    Frequently asked questions

    When is nonfarm payrolls released?

    It is usually released on the first Friday of the month at 8:30 in the morning New York time, covering the previous month. The Bureau of Labor Statistics publishes its schedule in advance, so the date is never a surprise. There is no excuse for being caught unaware by a scheduled release.

    Does a strong jobs number always push gold down?

    No, and this is the most common mistake. The market trades the difference between the outcome and what was already expected, not the raw number. A strong figure that is weaker than the market had positioned for can send gold up. Add in revisions, wage growth and the unemployment rate pulling in different directions, and single line rules break down quickly.

    Why does gold sometimes move in both directions within a minute?

    Because the report contains several numbers that can conflict, because liquidity is thin enough that a modest amount of buying or selling moves price a long way, and because a lot of automatic orders trigger at once. The first move is frequently not the move that lasts. That is a description of what commonly happens, not a prediction you can rely on.

    Is the payrolls number accurate?

    It is a carefully constructed estimate, produced honestly, with its uncertainty published openly. It is not a precise count, and the Bureau has never claimed it is. The 90 percent confidence interval on the monthly change is around plus or minus 122,000, and that is a fact about survey mathematics rather than a criticism of the statisticians.

    Should a beginner trade the payrolls release?

    In my honest opinion, no. Spreads are at their worst, slippage risk is at its highest, and the informational content of the first move is at its lowest. If you are still building consistency, this is a poor place to learn, and there are twenty other trading days in the month with better conditions.

    What about the other labour releases in the same week?

    Reports such as job openings, private payroll estimates and jobless claims all feed the same picture, and they can move gold too, usually less. They are worth knowing about mainly so that you are not surprised by volatility on a day you assumed was quiet. Knowing what is on the calendar is basic operational hygiene.

    Where this leaves you, and what we do about it

    Nonfarm payrolls is a good teacher because it strips away the comfortable illusion that there is a knowable answer if you just read enough analysis. Here is a number produced by a rigorous public agency, published with its own error bars, revised twice as more evidence arrives, and interpreted through four separate lines that regularly disagree. If certainty were available anywhere, it would be available here, and it is not.

    So the honest position is the one this channel keeps arriving at from every direction. You cannot control what the number says or how the market reads it. You can control whether the size of your position makes a bad ninety seconds survivable. That is not a consolation prize. Over a career it is very nearly the whole game.

    Gold Empire is a free Telegram channel where we work through this kind of market mechanic in public. There is no promise of profit here and there never will be, because nobody can honestly make one. What we can do is make sure you understand the machinery before it teaches you the expensive way.

    If this was useful, the free Gold Survival Sheet is the natural next step. It is a one page checklist covering position size, stop placement and the questions worth asking before a scheduled event lands. It costs nothing and it does not require you to trade anything.

    About the author. Matthew writes the Gold Empire market notes and has spent his time in this market mostly learning what not to do. He is not a licensed adviser and does not want to be one. His interest is in the part of trading nobody posts screenshots of: staying in the game long enough for a method to matter.

    Disclaimer: This article is general educational content about market mechanics and public economic data. It is not financial advice, not a recommendation, and not a solicitation to trade. Trading leveraged products carries a high risk of losing money rapidly. No entry, stop or target discussed should be treated as a signal. Past market behaviour does not predict future behaviour. Consider your own circumstances and seek independent regulated advice if you need it.