
Most people start keeping records after the damage is done. The account has had a bad month, the story they were telling themselves has stopped matching the balance, and somewhere in that gap the question arrives: how to track my trades properly, so that next time I can see it coming.
It is the right question asked late, which is still better than not asked at all. But the usual answer, download a spreadsheet template and start filling it in, quietly misses what the record is actually for. A list of trades with a profit column is a receipt. It tells you what already happened to your money. It does not tell you whether you are surviving, and survival is the only thing that matters in the first two years.
This article is about the second kind of record. It is shorter than most templates, it takes about four minutes a day, and it is built around a single question: is the thing I am doing going to still have an account attached to it in twelve months.
How to Track My Trades So the Record Answers a Useful Question
Start with the base rate, because it sets the standard the record has to meet.
When European regulators looked at retail contracts for difference across member states, they found that 74 to 89 per cent of retail accounts typically lose money, with average losses per client ranging from 1,600 to 29,000 euros. That is the published finding from ESMA’s product intervention measures of 27 March 2018, and it is worth sitting with for a moment, because it reframes the whole exercise.
If most accounts lose, then the interesting question about your own record is not whether you had a good week. Good weeks happen to losing accounts constantly, which is exactly why losing accounts survive long enough to become large losses. The interesting question is whether anything in your record distinguishes you from the base rate, and a profit column cannot answer that, because a profit column looks identical for the first three months in both cases.
So the record has to track the things that separate the two groups before the balance does. There are three of them, and none is what people usually write down.
The First Thing to Track Is What You Risked, Not What You Made
Write down, before entry, the amount you have decided to lose on this trade if it goes wrong. Not the lot size, not the stop level, the amount. Then write down what actually happened to that amount.
This sounds trivial and it is the single highest value line in the whole record, for a reason that shows up the first time you review a month. The number you planned to risk and the number you actually lost are different more often than anyone expects, and the gap between them is a complete description of your discipline.
A trade where you planned to lose one unit and lost one unit is a working process producing a bad outcome, which is normal and fine. A trade where you planned to lose one unit and lost 1.7 because you moved the stop is something else entirely. It is not a losing trade, it is a broken rule, and it belongs in a different column. Recorded together, as most templates record them, the second kind hides inside the first and you lose the one signal that would have warned you.
Keep both columns. Planned risk, realised risk. When the second starts drifting above the first, the process is degrading, and it will show up there weeks before it shows up in the balance.
The Second Thing to Track Is Your Total Open Risk, Right Now
Here is where most records fail silently, and it is a survival issue rather than a bookkeeping one.
Suppose you size every position so that it risks one per cent of the account. Disciplined, consistent, exactly what the books say. Now suppose you have three positions open at once: long gold, short the dollar index, and long silver. Each one is risking one per cent, so your record shows one per cent, three times.
Your account does not see three one per cent risks. It sees one position expressed three ways, because those three instruments respond to the same driver. If that driver moves against you, all three lose together. The arithmetic depends on how related they really are:
- If the three trades were genuinely independent, combined risk works out at about 1.73 per cent of the account, because independent risks add along the diagonal rather than in a straight line.
- If they are effectively the same trade, combined risk is the full 3.00 per cent, three times what your record claims.
- Four correlated positions, sized the same way, put 4.00 per cent on a single decision while every line of the record still reads one per cent.
Those are computed from the stated assumption that each position risks exactly one per cent and that correlation is either zero or one. Real positions sit between the two, which is the point: you cannot know where without writing the number down.
So the record needs one live line, updated whenever a position opens or closes, that says what your worst realistic day looks like right now if everything currently open goes wrong at the same time. Not the sum of the individual risks, the honest answer. Most people who start keeping this line discover their worst day is two to three times what they believed, and they discover it on a quiet afternoon rather than during the event.
The Third Thing to Track Is How Often You Trade
Activity has a price, and it is charged before anyone finds out whether you were right.
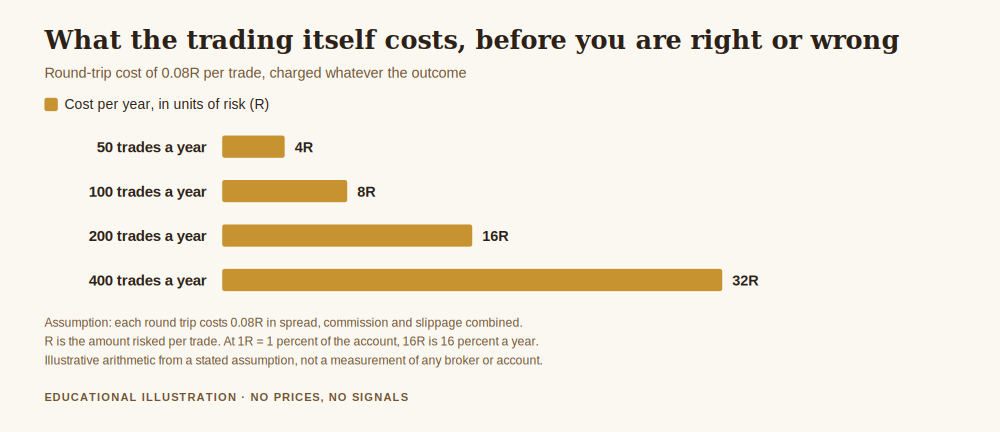
Assume each round trip costs you 0.08R, where R is the amount you risk per trade, and that 0.08 covers spread, commission and slippage together. It is an assumption, not a measurement, and your own number will differ. Hold it fixed and count:
- 50 trades a year costs 4.0R annually.
- 100 trades costs 8.0R.
- 200 trades costs 16.0R.
- 400 trades costs 32.0R.
If one R is one per cent of the account, the four hundred trade year has spent 32 per cent of the account on the privilege of participating. The method now has to clear that hurdle before it produces anything, and the two hundred trade year has to clear sixteen per cent. Nothing about the quality of the trades changed. Only the count did.
This is not a new observation. Terrance Odean’s paper “Do Investors Trade Too Much?”, published in the American Economic Review in 1999, examined exactly this relationship between trading frequency and outcomes, and the reference is given here so you can look it up rather than take it on trust. What is new, for most people, is having their own number instead of the general finding. The count is the easiest thing in the world to track and almost nobody tracks it, which is why almost nobody notices the year their trade count doubled.
Put a running count in the record, weekly and yearly. When it climbs, something has changed in your behaviour, and the change happened for a reason worth knowing.
Why a Short Record Cannot Tell You Anything Yet
There is a trap on the other side of this, and it catches the people who take record keeping seriously.
After twenty trades, the record exists, the columns are filled in, and the temptation is to start drawing conclusions from it. Twenty trades cannot support a conclusion. Here is the arithmetic, assuming the standard deviation of the result of a single trade is 1.0R, which is a reasonable working figure for a method risking a fixed amount:
- To detect a change of 0.30R per trade in your average result, you need about 43 trades recorded properly.
- To detect a change of 0.20R, about 96 trades.
- To detect a change of 0.10R, about 384 trades.
- To detect a change of 0.05R, about 1,537 trades.
Those come from the usual confidence interval width, 1.96 standard errors, and they assume trades are independent, which flatters the result because real trades cluster. The honest reading is that small edges are invisible in small samples, and that a person reviewing twenty trades is reading noise and calling it evidence.
This is not an argument against keeping the record. It is an argument for keeping it long, and for being extremely reluctant to change your method on the strength of a short one. The most expensive thing a new record does is give someone the confidence to abandon a working approach after a run of bad luck, or to scale up a broken one after a run of good luck.
Get the free Gold Empire survival sheet, a one-page guide to protecting your account through the kind of market this article describes. One email, no spam, unsubscribe anytime.
What the Record Looks Like in Practice
Six columns, filled in at the time rather than at the weekend, because memory edits.
- Date and instrument. Obvious, and it is what lets you spot the clustering later.
- Planned risk, in money. Decided before entry, written before entry.
- Realised result, in units of planned risk. Minus one, plus 2.3, plus 0.4. Using units rather than money keeps a year of trades comparable while the account changes size.
- Rule broken, yes or no. One word. This is the column people leave out and then wonder why the record taught them nothing.
- Total open risk at the moment of entry. Including everything else already open.
- Why, in one line. Written before the outcome is known, otherwise it is not a reason, it is a justification.
That is the whole thing. A spreadsheet, a notes app, a paper notebook, the tool does not matter and arguing about the tool is a common way of not starting. What matters is that columns two, four and five exist, because those are the three the profit column cannot reconstruct afterwards.
Reviewing It Without Fooling Yourself
Once a month, not once a day. Daily review of a record this short turns into score watching, which is the behaviour the record is supposed to correct.
Ask four questions of the month, in this order. How many times did column four say yes, and is that number rising or falling? What was the largest total open risk I carried, and did I decide to carry it or drift into it? How many trades did I take, against my own average? And only then: what did the results look like, remembering that a month is far too short to mean anything on its own.
The order is deliberate. Results last, because results are the part you control least and the part most likely to make you rewrite the story of everything above them.
Frequently Asked Questions
How to track my trades if I only place two or three a week?
The same way, and the low count is an advantage rather than a problem. Fewer trades means less cost drag and more attention available for each entry in the record. It also means the sample builds slowly, so be correspondingly slower to draw conclusions from it.
Should I record demo trades in the same place?
Record them, but keep them separate and never merge the two. A demo record is a record of your process under conditions where nothing is at stake, and the gap between the demo record and the live record is itself one of the more useful measurements you can have.
Do I need special journalling software?
No. Software that imports your trade history automatically will fill in columns one and three, which are the two columns you could reconstruct anyway from the account statement. The columns that matter, planned risk, rule broken and total open risk, all have to be typed by a human at the moment of the decision, because no platform records intent.
What if I already have months of trades and no record of them?
Start from today rather than reconstructing backwards. Reconstructed records are unreliable in a specific direction: people remember the reasoning of their winners and forget the reasoning of their losers, so a backfilled record systematically flatters the process it is supposed to audit.
How long before the record is useful?
The discipline columns are useful immediately, because a broken rule is a fact rather than a statistic. The performance columns need the sample sizes above, which for most people means a year or more before the numbers carry weight.
Where did the numbers in this article come from?
The retail loss range is quoted from the ESMA measures linked in the text, checked live before publication. The correlation figures are the square root of the number of positions for independent risks and the plain sum for identical ones. The cost figures are the trade count multiplied by an assumed 0.08R per round trip. The sample sizes are 1.96 squared, times the assumed variance of 1.0R squared, divided by the effect size squared. Odean’s 1999 paper is cited by title and journal so it can be checked directly. None of these is a forecast or a performance claim.
Where Gold Empire Fits
Gold Empire is free to follow. Daily XAU/USD analysis on Telegram with the reasoning stated before the trade rather than after it, losing days included. There is a free survival sheet for anyone who wants the capital protection material in one place, and an optional Kit for people who want the full method. Nothing here promises a profit and nothing here is a signal service.
Record keeping belongs to survival before it belongs to improvement. Risk management for gold trading is the pillar this article sits under, how much to risk per trade is where the planned risk column gets its number, why you keep blowing your trading account covers what the discipline column is designed to catch, and how to calculate lot size for gold and forex turns the planned risk into a position. More about who writes this is on the about page.
About the author. Matthew writes Gold Empire and is mainly interested in the unglamorous half of this business, the part that decides whether anyone is still trading in two years. He has a long-standing suspicion of any record that only contains outcomes. Nothing in this article is a recommendation to trade, and no entry, stop or target discussed should be treated as a signal.
Disclaimer: This article is general educational content about record keeping, risk measurement and review process in retail trading. It is not financial advice, not investment advice and not a recommendation to buy, sell or use any product, platform or firm. Regulatory wording is quoted from the source linked in the text and may change, and rules vary by jurisdiction. Trading leveraged products carries a substantial risk of loss and most retail accounts lose money. Figures are illustrative calculations from stated assumptions, not predictions or performance claims.
One step first
Where should we send the Gold Survival Sheet?
Leave your email and we will send the free one page checklist, then take you straight to the Telegram channel.
No cost and no obligation. Educational only, not financial advice, and nothing here promises a return. Unsubscribe any time in one click.
Leave a Reply