
A member sent me his statement last month with a one line message: “I don’t understand, I was right.” He had been right, in a sense. Gold had come back to where he first bought. The problem was that by the time it got there he had five positions open instead of one, and the account had been closed out two days earlier. Averaging down in gold trading is the most reasonable sounding way I know to lose an account, and the reason it is so hard to argue somebody out of is that it works most of the time.
That last part is not a figure of speech. I want to show you the arithmetic, because once you see how often it works you understand why nobody believes the warning, and once you see what it costs on the occasion it does not work, you stop needing the warning.
Everything numerical below is my own calculation from assumptions I state as I go. There are no gold price levels here, and nothing in this article is a recommendation to trade.
What averaging down in gold trading actually does to the arithmetic
The tactic is simple. Price goes against the position, so you open another one at the better price. Your average entry improves, so the distance back to break even shrinks. That part is real and it is the whole appeal.
Measure it properly and it is also where the trouble starts. Let me put distance in units of S, your original stop distance, and money in units of R, the loss the first position alone would take at that stop. One equal sized add, placed one S lower, means the combined position turns profitable while price is still below where you first bought. Two adds and it turns profitable a full S below your first entry. Every add makes the recovery look nearer.
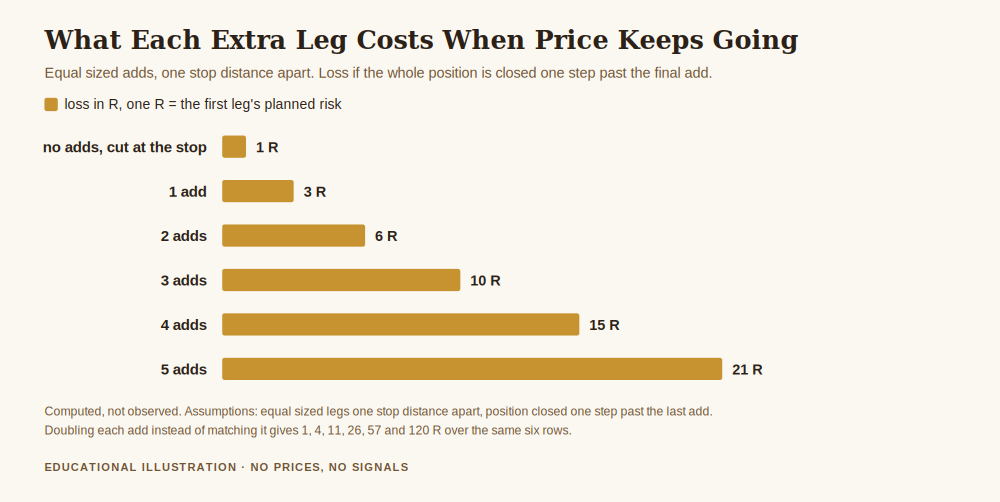
Now the other column. Close the whole thing one step past your last add and the loss is not one R any more. One add makes it 3 R. Two adds, 6 R. Three, 10 R. Five adds and a 1 R plan has become a 21 R loss. If you double each add instead of matching it, the same six rows run 1, 4, 11, 26, 57 and 120 R.
That is the trade you are making, stated plainly: you are buying a shorter distance back to break even, and you are paying for it with a loss that grows faster than the number of positions. Nobody would take that deal if it were written on a form. People take it constantly when it arrives one decision at a time.
Why it feels like it works, and why that feeling is accurate
Here is the part that most warnings skip, and skipping it is why the warnings do not land.
Assume, generously, that gold is a coin flip: equally likely to move one step up or one step down. Under that assumption the chance of price touching one step in your favour before running n steps against you is exactly n over n plus one. That is the classic gambler’s ruin result and it is not controversial.
So if your account can absorb four steps against you, the tactic resolves in your favour 80 per cent of the time. With eight steps of room, 88.9 per cent. And that understates it, because once you have added, the combined position turns green well before price returns to your first entry. Simulating the realistic version, where you add at each step down and close as soon as the whole position shows one R of profit, I get a hit rate of 88.9 per cent with four steps of room and 96.0 per cent with eight.
Ninety six per cent. The person doing this is not deluded. They are describing their experience accurately.
The whole game, priced
A hit rate is not a result, though, and this is where it comes apart. I ran 200,000 independent decisions per rule, with a dealing cost of one tenth of a step per position opened, seed fixed at 20261001 so anyone can reproduce it.
The plain rule, one position and out at the stop, wins half the time, the average win is 0.90 R and the average loss is 1.10 R. With four steps of grid room the hit rate climbs to 88.9 per cent, the average win drifts down slightly to 0.83 R, and the average loss becomes 10.40 R. With eight steps of room: 96.0 per cent hit rate, 0.80 R average win, 36.80 R average loss.
Read those three numbers across each row rather than down the column. The hit rate goes up, the win stays roughly the same size, and the loss multiplies. Expected result per decision goes from minus 0.101 R on the plain rule to minus 0.687 R on the widest grid, on a game that was a fair coin flip before costs. The grid does not change your odds of being right. It changes the size of the bill when you are wrong, and it charges you a fresh dealing cost for every position you open on the way down.
Over a year of 200 decisions the deepest hole tells the same story. The plain rule digs a median worst drawdown of 27 R, with a worst case across 20,000 simulated accounts of 85 R. The eight step grid digs a median of 174 R and a worst case of 683 R.
Where the close-out actually lands
There is one more thing the grid does that people do not see coming, and it is not a market risk, it is a contractual one.
Under the ESMA product intervention measures, retail gold CFD leverage is capped at 20:1 and there is a margin close out rule set at 50 per cent of minimum required margin. Your broker is required to close positions when equity falls below that line.
Suppose one R is one per cent of your equity and your stop distance is half a per cent of the gold price. Those two assumptions fix the size of a position: a notional of twice your equity, needing ten per cent of equity as margin at the 20:1 cap. With one position open, the close-out sits 95 steps below your entry, which is so far away it may as well not exist. That is why the close-out feels like something that happens to other people.
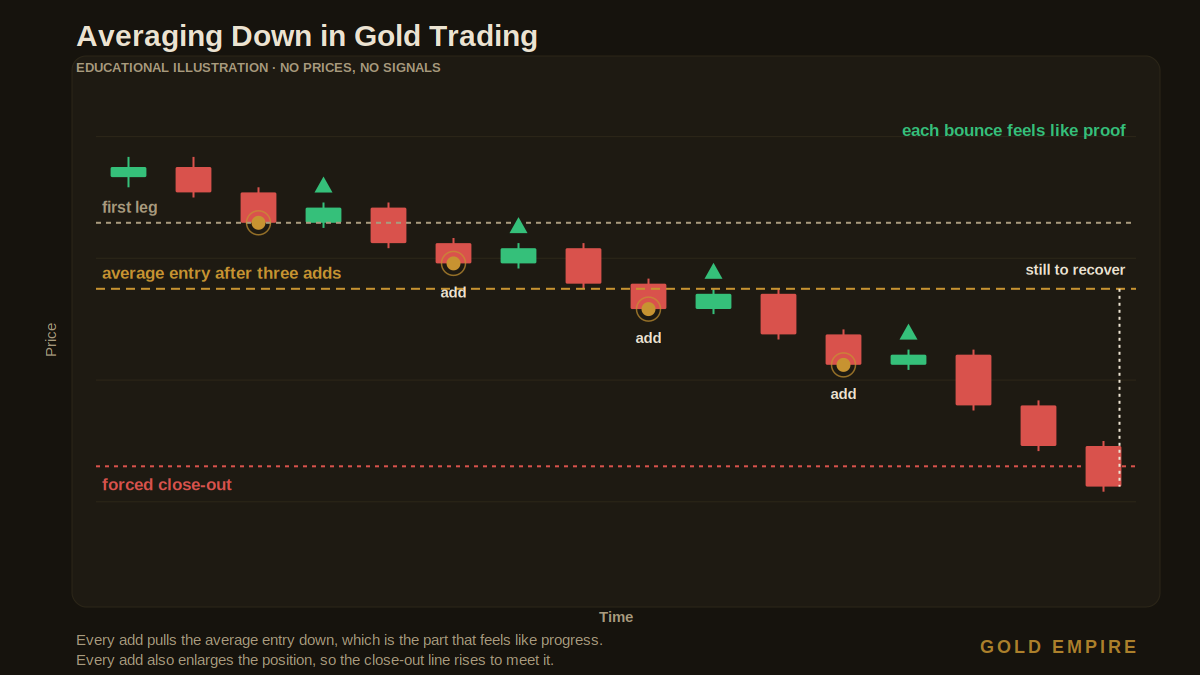
Add positions and the line walks toward you. With two open it sits at 45.5 steps. With three, 29.3. With four, 21.5. With five open, the forced close-out is 17.0 steps below your first entry, and the arithmetic from the first section says you are already 15 R down by five steps.
The close-out is not a distant safety net you are drifting toward. It is a line that moves up to meet you every single time you add, and it fires at the broker’s discretion rather than yours. My member’s account did not choose to close. It was closed.
Why the lesson never arrives in time
Put the hit rate and the loss together and you get the thing that makes this so durable.
At 96 per cent, the expected number of decisions before the first failure is about 25. Twenty five straight successes. The probability of ten clean in a row is 66.8 per cent, and of twenty five clean in a row, 36.4 per cent. A trader running a wide grid will very likely have a long, quiet, entirely successful run.
That run is the teacher. By the time the failure arrives, the habit has been reinforced two dozen times, the position sizes have crept up because the tactic has been working, and the account is larger, so the loss is larger too. The lesson always arrives against the biggest position the habit has yet produced. That is not bad luck. It is the structure of the thing.
What I would do instead
I am not going to tell you where to put anything, and none of this is a rule for your account. But the survival logic here is not complicated.
The first thing is to notice that “averaging down” and “scaling into a planned position” are different animals wearing the same coat. If you decided before entering that the position would be built in three parts across a range, and you sized the whole thing so that the full position at its full stop is still one R, that is a plan being executed. If you are adding because price went against you and you did not want to take the loss, that is the grid, whatever you call it in your journal. The test is whether the total risk was decided before the first entry or after the second.
The second is that the number worth protecting is total open risk, not the risk of any one position. Five positions each sized at one R is a five R decision, and the arithmetic above says it is worse than that, because they are all the same trade in the same instrument moving the same way. I have written about how much to risk per trade and about position sizing for gold, and both of those assume the number they produce is the whole exposure rather than the first instalment of it.
The third is the uncomfortable one. The reason people average down is almost never analytical. It is that taking the loss means being wrong in a way that is recorded, and adding means the question stays open. A position you are still holding has not lost yet. That is the appeal, and naming it honestly does more than any amount of arithmetic. If this pattern is familiar, why you keep blowing your trading account covers the same reflex from the other direction.
Get the free Gold Empire survival sheet, a one-page guide to protecting your account through the kind of market this article describes, including how to count total open risk rather than risk per position. One email, no spam, unsubscribe anytime.
Frequently asked questions
Is averaging down always wrong?
Not always, and the distinction is whether the total risk was decided in advance. A position planned as three instalments across a range, sized so the whole thing at its full stop is still the loss you budgeted, is a plan. Adding because price moved against you and the loss felt unacceptable is the grid described above, no matter how it is labelled afterwards.
What about averaging down in a long term physical gold holding?
Different question entirely, because the two risks that drive this article are absent. An unleveraged holding has no margin close out that can end the position on someone else’s timetable, and no dealing cost charged per add on the scale a leveraged account pays. Everything here is about leveraged gold positions.
Does it help if I use wider stops and smaller positions instead?
It changes the units rather than the shape. The arithmetic above is written in R and in steps of your own stop distance precisely so it holds whatever those distances are. A grid of five positions is 15 R by the fifth step whether that step is large or small.
Why does the hit rate in your simulation differ from the gambler’s ruin figure?
Because they model different exit rules. The n over n plus one figure is for price touching one step above your original entry. The simulation uses the realistic rule, closing when the combined position shows one R of profit, which after a couple of adds can happen while price is still below your first entry. That is an easier target, so the hit rate is higher. Both are stated so you can see which is which.
Where did the 96 per cent and the 36.80 R come from?
From a simulation of 200,000 independent decisions under the assumptions stated in the article: price moving one step up or down with equal probability, equal sized adds one step apart, a dealing cost of one tenth of a step per position, and a fixed seed of 20261001. Change any assumption and the numbers change, which is the point of writing them down.
My broker offers negative balance protection, so what is the worst case?
Losing the account rather than more than the account, which is a genuine protection and not the one people think they are getting. Negative balance protection caps your loss at what you deposited. It does nothing to make a 36 R loss smaller, and the margin close out will have ended the position long before it becomes relevant.
Where Gold Empire fits
Gold Empire is a free education channel about surviving in gold before trying to grow in it. Everything here is free to read and free to follow on Telegram. The one optional piece is the survival sheet above, a single page on protecting an account. We do not promise profits, we do not publish account results, and we do not believe anyone can tell you what your account will do. If you want the fuller version of the thinking in this article, risk management for gold trading is the piece everything else here hangs off.
About the author. Matthew writes Gold Empire. He spent a long stretch early on treating a losing position as a question that could be kept open by adding to it, and he stopped the year he sat down and worked out what the tactic had actually cost him across all the times it had worked. Nothing in this article is financial advice or a recommendation to trade, and no entry, stop or target discussed should be treated as a signal. Trading leveraged gold carries a substantial risk of loss and is not suitable for everyone.
One step first
Where should we send the Gold Survival Sheet?
Leave your email and we will send the free one page checklist, then take you straight to the Telegram channel.
No cost and no obligation. Educational only, not financial advice, and nothing here promises a return. Unsubscribe any time in one click.
Leave a Reply