

Open any gold chart and you will start to notice something. Price does not wander around at random. It keeps stalling at certain levels, turning away, then coming back to test them again later. Those levels have a name, and they are two of the most useful ideas a new trader can learn: support and resistance. Once you can spot them, a chart that looked like noise starts to look like a room with a floor and a ceiling.
Support and resistance are the levels where price has reacted before, places where the market keeps pausing or turning. They are not magic lines and they are not signals. But they tell you where the market is likely to care, and that is worth a great deal when you are deciding whether a level is worth respecting or worth ignoring.
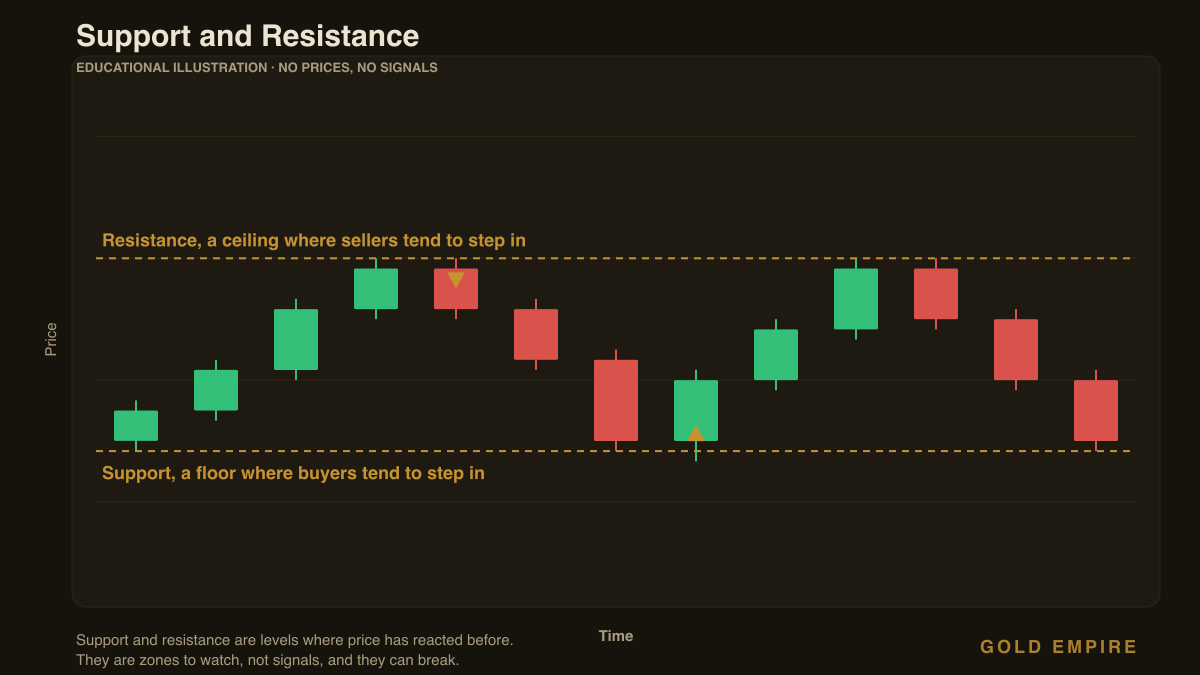
What support and resistance actually are
Think of price as moving inside a room. The floor is support: a level below the current price where buyers have stepped in before, stopping the fall and pushing price back up. The ceiling is resistance: a level above the current price where sellers have stepped in before, capping the rise and pushing price back down.
Support is where demand has been strong enough to halt a drop. Resistance is where supply has been strong enough to halt a rally. That is the whole idea. When gold falls to a support level and buyers show up again, price bounces. When it climbs to a resistance level and sellers show up again, price stalls. The more times a level has done this, the more traders are watching it, which is part of why it keeps mattering.
Why these levels exist at all
It is worth understanding why price respects these levels, because it stops them feeling like superstition. Markets have memory, and that memory lives in people.
Imagine gold sold off hard from a certain price last week, trapping a lot of buyers who bought too high. When price crawls back to that same level, those trapped buyers are relieved to get out at breakeven, so they sell. New sellers who missed the first drop also pile in. All that selling clusters at one price, and it becomes resistance. Support works the same way in reverse: a level where buyers keep showing up because they remember it as a good place to buy. The level is really just a crowd of people all making similar decisions at the same price.
The idea that surprises most beginners
Here is the part that clicks late for a lot of people. Support and resistance are not exact lines. They are zones. Price will often overshoot a level by a little, wick through it, and then snap back. If you treat a level as a razor-thin line and expect price to turn on the exact number, you will get shaken out constantly. Treat it as a small area, a band, and you will read the chart far more calmly. This is exactly why we never talk about precise numbers here and why keeping a clear head when you read a gold chart matters more than any single price.
The second surprise: when a level finally breaks, it often flips. A ceiling that price pushes decisively above tends to become a floor on the way back down. Resistance becomes support, and support becomes resistance. Old buyers and sellers change their behaviour once a level gives way, and the level keeps mattering, just with its role reversed.
Levels are only half the job
Knowing where price might react keeps you patient. Knowing how much to risk when it does keeps you in the game. Grab our free one page Survival Sheet, the risk checklist I run before every session.
Download the free Survival Sheet › or join the Gold Empire community on Telegram ›
How to actually use support and resistance
Reading levels is simple if you keep it simple. Here is the routine I use, and you can copy it exactly.
- Mark the obvious levels only. Look for places price has clearly turned more than once. If you have to squint to justify a level, it is not important. The strongest levels are the ones a child could point to.
- Draw zones, not lines. Give each level a little thickness. Price is allowed to poke through and come back. That is normal, not a failure of the level.
- Wait for a reaction, do not predict one. A level is not a reason to trade by itself. It is a place to pay attention. Let price show you it is respecting the level before you act, rather than assuming it will.
- Respect the break. If price closes firmly through a level, stop treating it as a wall. It may now become the opposite kind of level. Do not keep betting on a floor that has already caved in.
Notice what this does for you emotionally. Levels give you a plan for where to care and where to relax. When price is stuck in the middle of a range, far from support and resistance, there is usually nothing to do, and knowing that protects you from forcing trades in no-man’s-land.
How support and resistance fit with the bigger picture
Support and resistance work best when you read them alongside the trend. In our piece on market structure in gold trading we talked about how the direction of highs and lows tells you which way the market is leaning. Levels tell you where along that path price is likely to react. Put the two together and you get a genuinely useful read: which way the market wants to go, and the spots where it might pause or turn on the way.
That combination is far more powerful than either idea alone. Structure without levels leaves you guessing where to expect a reaction. Levels without structure leave you fading a strong trend at every ceiling and getting run over. Read together, they keep you on the right side and patient at the right places, which is the whole foundation of our approach to risk management in gold trading.
Get the free Gold Empire survival sheet, a one-page guide to protecting your account through the kind of market this article describes. One email, no spam, unsubscribe anytime.
Frequently asked questions
What is the difference between support and resistance?
Support is a level below the current price where buyers have stepped in before and stopped a fall, acting like a floor. Resistance is a level above the current price where sellers have stepped in before and capped a rise, acting like a ceiling. Same idea, opposite directions.
Are support and resistance exact price levels?
No, and treating them as exact is a common beginner mistake. They are zones, small bands rather than razor-thin lines. Price often overshoots a level slightly, wicks through, and snaps back. Reading them as areas keeps you from getting shaken out by normal noise around the level.
What happens when support or resistance breaks?
When a level breaks decisively, it often flips its role. A resistance ceiling that price closes above tends to become a support floor afterwards, and a broken support tends to become resistance. The level keeps mattering, just with buyers and sellers swapping which side they defend.
Can I trade just by buying support and selling resistance?
Be careful with that. A level is a place to watch, not a signal on its own. In a strong trend, price can blow straight through a level without pausing, so blindly buying every support in a downtrend is a fast way to lose. Levels work best combined with the trend and always with a defined stop and sensible position size.
How do I know which levels are strong?
The strongest levels are the obvious ones that price has clearly reacted to more than once, ideally that many traders can see. If a level required careful hunting to find, it is probably weak. Clear, repeatedly tested levels matter more than a chart covered in dozens of faint lines.
About the author
Matthew is the founder of Gold Empire and has spent years trading gold through quiet ranges and violent trends alike. He writes here as a working trader sharing how he actually reads a chart, not as a guru with a shortcut to sell. His approach is deliberately plain: mark the obvious levels, read them as zones, respect the trend, and protect the account before chasing any single move. He would rather you understand support and resistance deeply than memorise a dozen indicators you never trust.
Disclaimer: This article is for educational purposes only and is not financial advice. Trading gold and other leveraged products carries a high risk of loss and is not suitable for everyone. Nothing here is a recommendation to buy or sell, and no entry, stop or target discussed should be treated as a signal. Past performance does not guarantee future results. Always trade with money you can afford to lose and consider speaking with a licensed financial professional about your own situation.
One step first
Where should we send the Gold Survival Sheet?
Leave your email and we will send the free one page checklist, then take you straight to the Telegram channel.
No cost and no obligation. Educational only, not financial advice, and nothing here promises a return. Unsubscribe any time in one click.
Leave a Reply