
People arrive at how to trade gold and silver expecting one answer to cover both, because the two metals sit next to each other on every platform, move at roughly the same times, and respond to roughly the same headlines. That last part is true enough to be dangerous. They do respond to the same things. They just respond by a very different amount, and almost nobody adjusts for it.
I want to put a number on that difference rather than describe it, because the number is the whole lesson. Everything below is computed from the published London benchmark prices for both metals, and the method is stated so you can repeat it. As always here, no entry, stop or target discussed should be treated as a signal.
The measurement, before the opinions
I took the LBMA daily benchmark prices for gold and for silver, kept only the days where both metals were priced, and compared each benchmark with the one before it. The window is the ten complete calendar years from 2016 to 2025. That leaves 2,506 benchmark days and 2,505 day-on-day comparisons for each metal.
Here is what came out.
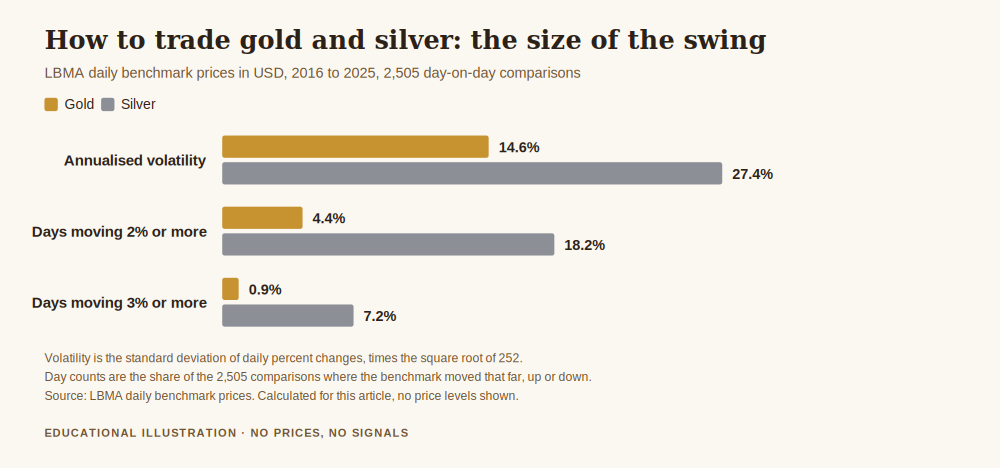
On an average day, gold’s benchmark moved 0.66 percent and silver’s moved 1.22 percent. Silver travelled 1.84 times as far as gold on a typical day across a decade.
Measured the other way, as annualised volatility, gold came out at 14.6 percent and silver at 27.4 percent, a ratio of 1.87. Two different methods, the same answer: silver moves roughly twice as much.
The tails are worse than the average suggests. Gold moved 2 percent or more on 4.4 percent of days. Silver did it on 18.2 percent of days. A 2 percent day is unusual in gold and ordinary in silver, happening about once a week. Push to 3 percent and gold managed it on 0.9 percent of days against silver’s 7.2 percent, which is eight times as often.
Why this is the thing that empties accounts
Nobody blows up because they misunderstood the industrial demand picture for silver. They blow up because of what happens next, and it happens quietly.
You have traded gold for a while. You have settled on a position size that feels survivable, because you have watched what a bad day does to it and you can live with that. Then you open silver, and you use the same size, because it is the size you use.
You have just increased your risk by about 84 percent without making a decision to do so. Not by taking a worse trade, not by ignoring a rule, but by carrying a habit across a border where the habit no longer applies. Your bad day in silver is now roughly twice the bad day you calibrated for, and the once-a-week 2 percent move that gold taught you to treat as an event is, in silver, just Tuesday.
This is why I treat it as a sizing problem rather than an analysis problem. If you want to carry the same amount of daily risk in silver as you carry in gold, the arithmetic says size at about 54 percent of your gold position, because 1 divided by 1.84 is 0.54. Slightly more than half. That is not a rule I am handing you, it is the consequence of the measurement above, and you should redo it for your own window before you rely on it.
How to trade gold and silver as two instruments, not one
The practical answer to how to trade gold and silver is that you do not trade them the same way, and the differences are worth stating plainly.
Silver has a second job
Gold’s demand is dominated by things that do not care much about the economic cycle: jewellery, investment, and central bank reserves. Silver does all of that and is also an industrial input, used in electronics, solar panels and brazing alloys. That gives silver a second demand channel gold does not have.
The consequence for you is not a forecast, it is a warning about correlation. There are stretches when the two metals move together and stretches when they part company, because industrial demand is pulling on one of them and not the other. Two positions that look like diversification during the first stretch turn out to be one position with extra steps during the second.
The market is smaller, so the moves are bigger
Silver’s market is a fraction of gold’s in value terms. The same size of order lands harder in a smaller market, which is most of why the volatility numbers above look the way they do. This is also why silver’s spread tends to be wider relative to its price, and wider still when things get busy. Your costs go up in exactly the conditions where you are most likely to want to trade.
The ratio moves too, and it is not a signal
People discover the gold to silver ratio, which is simply how many ounces of silver one ounce of gold is worth, and quickly start treating it as a timing tool. Across the same 2016 to 2025 window that ratio had a low of 58.1, a high of 123.5 in March 2020, and a median of 81.3. From low to high it swung by 113 percent.
Read that again, because it is the opposite of what the ratio is usually sold as. A measure that can more than double is not a stable anchor you can lean on. It is a relationship that spends years away from its own median. Anyone using it as a reason to expect reversion needs to be able to fund the wait, and the wait has historically been measured in years.
What actually changes in your routine
If you decide to trade both, a small number of things need to change. None of them is exciting.
Size each metal separately. One position size for your account is a habit that only works when you trade one instrument. The moment you add a second, the size has to be derived from that instrument’s own movement, not inherited from the first.
Count them as one exposure when they move together. During the stretches when the two metals track each other closely, holding both is closer to holding a single larger position than to holding two independent ones. Your total risk is not the sum of two comfortable numbers, it is something larger, and the account only finds out on a bad day.
Recalculate what a normal day looks like. If your stop placement is informed by how far the instrument usually travels, and it should be, then it has to be recalculated per instrument. A distance that sits safely outside gold’s ordinary noise sits comfortably inside silver’s.
Expect the cost per trade to be higher. Wider spreads on the more volatile instrument mean the same trading frequency costs you more in silver than in gold. If your edge is thin, this alone can be the difference. The mechanics of that are covered in what the spread actually costs you.
The honest options
There are three defensible ways to approach this and one indefensible one.
Trade gold only. Perfectly respectable, and what I would suggest for most people for longer than they want to hear. You get the smaller of the two swings while you are learning, and you are learning on the instrument where mistakes cost less.
Trade both, sized separately. This works, and it is more work than it sounds. You maintain two sets of numbers, you track them as one exposure when they converge, and you accept the higher cost on the silver side.
Trade silver only. Also defensible if you have deliberately chosen the faster instrument with your eyes open and sized for it. Some people prefer it. The requirement is that the choice was made rather than drifted into.
Trade both at the same size. This is the indefensible one, and it is by far the most common. It is not a strategy. It is an unexamined assumption that costs about 84 percent extra risk on the silver side, and it stays invisible until the week it is not.
Where the risk really lives
I have spent this article on movement rather than on where either metal is heading, and that is deliberate. Direction is the part everyone studies and the part nobody can promise. How far a thing moves on an ordinary day is knowable, measurable from public data, and almost entirely ignored, which is a strange allocation of attention given that the second one is what determines whether you are still trading next year.
The full version of that argument is in risk management in gold trading, and if you have not yet worked out your own position size from first principles, how much to risk per trade is the piece to read before this one.
Get the free Gold Empire survival sheet, a one-page guide to sizing a position so that an ordinary bad day stays an ordinary bad day, whichever metal you are trading. One email, no spam, unsubscribe anytime.
Frequently asked questions
Is silver just a cheaper way to trade gold?
No, and this is the single most expensive misunderstanding in the pair. A lower price per ounce is not a lower risk per position. What determines your risk is how far the price travels multiplied by how much of it you hold, and silver travels roughly 1.84 times as far as gold on an ordinary day. Same money at risk, more movement against it.
Should a beginner start with gold or silver?
Gold, in my view, and not because silver is disreputable. Learning happens through mistakes, and mistakes on the instrument that moves half as far cost roughly half as much. There is no advantage to serving your apprenticeship on the faster instrument, and there is an obvious disadvantage.
Does the gold to silver ratio predict anything?
Not reliably enough to build a position on. Over 2016 to 2025 it ranged from 58.1 to 123.5, a swing of 113 percent, and spent long periods far from its median of 81.3. It describes a relationship rather than forecasting one. Treating a measure that can double as a stable anchor is how people end up funding a very long wait.
Can I hold gold and silver at the same time to diversify?
You can hold both, but be careful about calling it diversification. There are long stretches where the two move closely together, and during those stretches two positions behave much like one larger position. Diversification that disappears in exactly the conditions you wanted it for is not doing the job you hired it for.
Why is silver’s spread usually wider?
Because silver’s market is considerably smaller than gold’s in value terms, so there is less depth to absorb orders, and because it is more volatile, which makes quoting it riskier for whoever is on the other side. Both effects push the same way, and both get worse in fast conditions.
Do I need to redo these numbers myself?
You should, and it takes an afternoon. My window was 2016 to 2025 and the answer would come out somewhat differently over a different decade. The source is public and linked above. A number you have recomputed yourself is one you will actually act on, and one you will know the limits of.
Where this leaves you
The difference between gold and silver is not a matter of taste, and it is not a matter of which one has the better story this year. It is a measurable difference of roughly a factor of two in how far the price travels, and it has been stable enough across a decade that you can plan around it.
What makes it dangerous is precisely that it is boring. It does not feel like a risk, because nothing about opening a second instrument feels like a decision. You just use the size you use. That is the whole failure, and it is invisible right up until a Tuesday in silver does what a rare day in gold used to do.
Size each one for what it actually is. That is most of the answer, and the rest is patience.
Where Gold Empire fits
Gold Empire is a free Telegram channel where I post gold analysis with the reasoning stated before the move rather than after it, losing days included. There is nothing to buy in order to follow along, and an optional Kit if you want more structure later. I publish no profit claims, for reasons this article should make obvious.
The free survival sheet is the one page version of the sizing discipline described above.
About the author. Matthew writes Gold Empire. He is interested in the unglamorous half of this business, cost, size, frequency and the arithmetic of staying solvent, on the view that most accounts are lost to ordinary errors repeated patiently rather than to any single dramatic trade.
Disclaimer: This article is general educational content about volatility and position sizing across two instruments. It is not financial advice and it is not a recommendation to buy or sell anything, including either metal. Trading gold, silver, CFDs and leveraged products carries a high risk of losing money rapidly. No entry, stop or target discussed should be treated as a signal. The 54 percent sizing figure is the arithmetic consequence of the measured volatility ratio, offered as a worked example rather than as a rule to copy. All volatility, day count and ratio figures are computed from the published LBMA daily benchmark prices for gold and silver over 2016 to 2025, using the method stated in the article, and the source is linked so you can check it. No price levels are quoted anywhere in this article.
One step first
Where should we send the Gold Survival Sheet?
Leave your email and we will send the free one page checklist, then take you straight to the Telegram channel.
No cost and no obligation. Educational only, not financial advice, and nothing here promises a return. Unsubscribe any time in one click.
Leave a Reply