
Most people who ask how to stop losing money day trading are asking about the wrong half of the problem. They are looking for the entry that stops failing, the indicator that stops lying, the session that finally behaves. I have spent a long time in that search and I want to save you some of it, because the arithmetic says the leak is usually somewhere else entirely, somewhere much duller, and somewhere you can measure this afternoon without learning anything new about charts.
The leak is frequency. Not whether you are right, but how many times a day you pay for the privilege of finding out.
The Cost Nobody Puts in the Journal
Every time you open and close a position you pay a round turn. The spread, and where it applies, a commission. It is a small number. That is exactly why it survives scrutiny: it is too small to feel, and it does not appear in your journal as a loss. It appears as a slightly worse fill, a slightly earlier stop, a winner that came up a little short of where you thought it would land.
A single round turn will never be the reason an account fails. Two thousand of them can be, and a day trader taking five round turns a day reaches two thousand inside two years without doing anything unusual.
To see the size of it, the cost has to be converted into a unit that means something. Percentages of position value are meaningless on their own, because they depend on how big the position is. The unit that matters is R, which is simply the money you put at risk on one trade. If you risk the same amount on every trade, then R is your ruler, and every cost, every win and every loss can be measured with it.
Turning a spread into a number you can compare
Here is the conversion, with both assumptions stated so you can substitute your own.
Assumption one: a round turn costs 0.02% of position value. That is a stand in for a typical retail dealing cost on gold. Yours may be better or worse, and your broker’s own contract specification is the place to check rather than any article.
Assumption two: your stop sits 0.24% away. That figure is not invented. Using the published LBMA gold benchmark over the ten years from 2016 to 2025, there were 2,506 fixings and therefore 2,505 session to session comparisons. The median absolute move across those sessions was 0.48%. A day trader is not working with the whole daily move, so I have taken half of it as a stop distance, which is generous to the day trader rather than harsh.
Divide the cost by the stop distance and you have the answer in R. It comes to 0.083R per round turn, or a little over eight percent of everything you risk on a trade, handed over before the market has done anything at all.
Put differently, one round turn consumes 4.16% of a median session’s entire movement. You are buying back that ground before you can call yourself even.
How to Stop Losing Money Day Trading Means Reading This Table First
Multiply 0.083R by the number of round turns you take, across a 250 day trading year, and the small number stops being small.
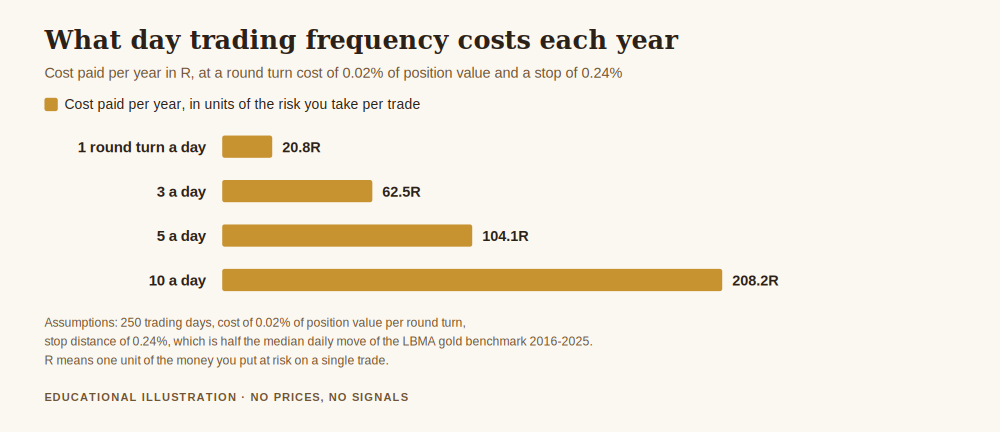
One round turn a day costs 20.8R across the year. Three a day costs 62.5R. Five a day costs 104.1R. Ten a day costs 208.2R.
Look at the last line for a moment. A trader risking one percent of the account per trade, taking ten round turns a day, is paying out more than two hundred times their per trade risk over a year purely in dealing costs. The strategy has to overcome that before it produces anything. Not beat the market, not outsmart anyone. Simply get back to nil.
This is the number that separates people who wonder why a decent method keeps going nowhere from people who have already checked.
The Coin Flip Test
Arithmetic in a table can feel abstract, so I ran the situation directly. Take a trader with no skill whatsoever, a pure coin flip, winning half the time at one R and losing half the time at one R, and charge them 0.083R per round turn. Nothing else. No bad discipline, no revenge trading, no oversized position. Just the cost.
Across forty thousand simulated years:
- At one round turn a day, that trader finishes the year down 91.0% of the time, with a median result of 20.8R lost.
- At five round turns a day, the trader finishes down 99.8% of the time, with a median result of 104.1R lost.
The coin is fair. The market has taken nothing from them. Frequency alone converted a level game into a near certainty of loss, and it did so faster at higher frequency, which is the part worth sitting with. Trading more often did not give the coin flipper more chances to get lucky in any way that helped. It gave the cost more chances to compound.
This is also why the answer to how to stop losing money day trading is so rarely a new technique. A new technique has to be good enough to clear 0.083R per trade before it is worth anything, and most of what gets sold as a technique has never been measured against that bar at all.
What the Research Has Been Saying for Twenty Years
None of this is a private discovery. The relationship between how often people trade and how they do has been one of the more consistent findings in the academic literature.
Barber and Odean’s Trading Is Hazardous to Your Wealth, published in The Journal of Finance in 2000, examined 66,465 households holding accounts at a discount broker between 1991 and 1996. The households that traded most earned an annual return of 11.4% while the market returned 17.9%, and the average household earned 16.4% while turning over 75% of its portfolio each year.
Those are stock market figures, not gold, and the instrument is genuinely different. The mechanism is not. Turnover was the variable that separated the groups, and the most active were furthest behind, which is the same shape as the table above arrived at from pure arithmetic in a different market.
A later study by Barber, Lee, Liu and Odean, The Cross-Section of Speculator Skill: Evidence from Day Trading, published in the Journal of Financial Markets in 2014, looked specifically at day traders and at whether persistent skill can be identified among them. I would rather you opened it than took my summary on trust, and both papers are linked so you can.
What This Argument Is Not
I want to be careful here, because this line of reasoning gets overstated in both directions.
It is not an argument that day trading cannot work. The table is a cost, not a verdict. A method producing more than 0.083R per trade on average, after everything, is ahead of the cost. Such methods exist.
It is not an argument that you should trade once a day rather than five times. If your genuine edge only appears five times a day, taking it five times a day is correct, and cutting to one would cut the edge along with the cost.
What it is: an argument that you cannot know which of those applies to you until you have measured the cost against the edge. Almost nobody has done that measurement, which is why almost everybody in this position reaches for a new indicator instead. The indicator is cheaper to try. It is also, on this evidence, the less likely place for the problem to be.
Four Things to Measure This Week
None of this requires new software or a new method. It requires four numbers you can find in your existing statement.
Your real round turn cost. Not the advertised spread, the actual one. Take a sample of closed trades, compare the price you expected against the price you received on both sides, and include commission. Advertised costs are quoted under favourable conditions and day traders frequently operate outside them.
Your average stop distance. In percentage terms, across your recent trades. This is the denominator that turns your cost into R, and it is the number most people have never calculated.
Your round turns per day. Count them for a fortnight rather than estimating. Estimates run low, consistently and in one direction, because the trades you regret are the ones you forget.
Your gross expectancy per trade, in R, before costs. If that number is below your cost per round turn, the method is not yet viable at any frequency, and more activity makes it worse rather than better. That is unwelcome to discover and considerably cheaper than discovering it slowly.
Those four numbers will tell you more about your account than any amount of further chart study, and they will tell you in an afternoon. If you want the wider framework they sit inside, that is risk management in gold trading, and the sizing half of it is in how much to risk per trade.
Get the free Gold Empire survival sheet, a one page guide to sizing a gold position and counting what each trade actually costs you before the market moves at all. One email, no spam, unsubscribe anytime.
Frequently asked questions
Is trading less often really the answer to how to stop losing money day trading?
Trading less often is the answer when your cost per round turn is larger than your average edge per trade, which is a condition you can test rather than guess. If your edge comfortably exceeds the cost, frequency is working for you and cutting it would cost you money. The instruction is to measure, not to slow down for its own sake.
Where did the 0.083R figure come from?
It is a division, not a measurement of your account. A round turn cost of 0.02% of position value divided by a stop distance of 0.24% gives 0.083R. The stop distance is half the median absolute daily move of the LBMA gold benchmark over 2016 to 2025, which was 0.48% across 2,505 session comparisons. Substitute your own cost and your own stop distance and you will get your own number, which is the one that matters.
Does a bigger stop fix the problem?
It reduces cost measured in R, because the denominator grows, and that is real. It does not create an edge, and it changes what a losing trade does to the account, so it cannot be evaluated on the cost line alone. Widening a stop to improve one ratio while worsening your risk elsewhere is not an improvement, it is a transfer.
My broker advertises very low spreads on gold. Does this still apply?
The arithmetic applies at any cost level, with a different result. Halve the cost assumption and you halve every figure in the chart, which is a genuine improvement and still leaves ten round turns a day costing over a hundred R a year. Also check what the advertised figure covers, since headline spreads are usually quoted under calm conditions and widen when the market is busy, which is precisely when day traders are active.
Does the coin flip simulation prove day trading loses money?
No, and it is not intended to. It isolates one variable. It shows what cost alone does to a trader with no edge and no behavioural problems, so that the size of the cost is visible without anything else obscuring it. A trader with a real edge is a different case, and the same arithmetic tells them how large that edge needs to be.
Why measure in R rather than in money?
Because R is comparable across account sizes, across time and between people, and money is not. A cost of a few units of currency means nothing without knowing the position behind it. A cost of 0.083R tells you immediately that you have surrendered eight percent of your risk before the trade begins, and that statement stays true whatever the size of your account.
What is the single most common mistake here?
Counting only the trades that hit a stop as costs. The cost is charged on every trade, including the winners and including the ones closed flat after two minutes because it did not look right. Those flat trades feel free. In the arithmetic they cost exactly as much as the others.
Where This Leaves You
The honest answer to the question is that most day trading accounts are not destroyed by a dramatic event. They are worn down by an ordinary one, applied often, and recorded nowhere. The good news in that is real: a cost you can measure is a cost you can decide about, and you do not need to be right more often to reduce it. You need to count.
Work out what a round turn costs you in R. Multiply it by how often you trade. Then decide whether the method you are running clears that bar. Whatever the answer, you will be making a decision with a number in front of you, which puts you ahead of where most of this argument gets conducted.
Where Gold Empire Fits
Gold Empire is a free Telegram channel where I post gold analysis with the reasoning stated before the move rather than after it, losing days included. There is nothing to buy in order to follow along, and an optional Kit if you want more structure later. I publish no profit claims and I do not rank brokers for payment.
The free survival sheet is the one page version of the counting discipline described here. If costs are the part you want to go deeper on, what is the spread in gold trading covers the mechanics, and how to stop overtrading and revenge trading deals with the behavioural side of the same frequency problem.
About the author. Matthew writes Gold Empire. He is interested in the unglamorous half of this business, cost, size, frequency and the arithmetic of staying solvent, on the view that most accounts are lost to ordinary errors repeated patiently rather than to any single dramatic trade.
Disclaimer: This article is general educational content about dealing costs and trading frequency. It is not financial advice and it is not a recommendation of any broker, product or method. Trading gold, CFDs and leveraged products carries a high risk of losing money rapidly. No entry, stop or target discussed should be treated as a signal. The cost of 0.02% of position value and the stop distance of 0.24% are stated assumptions used as worked examples, not settings to copy, and you should substitute figures from your own broker and your own records. The median daily movement figure is computed from the published LBMA daily gold benchmark over 2016 to 2025 and the source is linked so you can check it. The simulation describes a model, not any real account, and no real trading results are represented anywhere in this article. The academic papers are linked rather than summarised in figures so that you can read them directly. No gold price is quoted anywhere in this article.
One step first
Where should we send the Gold Survival Sheet?
Leave your email and we will send the free one page checklist, then take you straight to the Telegram channel.
No cost and no obligation. Educational only, not financial advice, and nothing here promises a return. Unsubscribe any time in one click.
Leave a Reply