
Most traders learn how to calculate average risk reward ratio the same way: open the journal, look down the column where each winning trade is recorded as a multiple of what it risked, and take the mean. It is one line in a spreadsheet and it feels like measurement. The trouble is that this particular average answers a question nobody asked, and on a journal where the size of the bet changed over time it can read forty percent higher than the figure the account actually earned.
This is not a rounding quibble. It is the difference between a book that looks like it is working and a balance that is going down. Below is the arithmetic on a forty trade sample, the two formulas that disagree, and the reason the disagreement is always in the flattering direction.
How to Calculate Average Risk Reward Ratio: The Two Formulas
There are two defensible ways to average a risk reward ratio across a series of trades, and they are not interchangeable. Which one is correct depends on what you intend to do with the answer.
Method one, the mean of the ratio column
Take every winning trade, express it as a multiple of the money that trade risked, and average those multiples. A trade that risked 100 units and made 210 is 2.10. A trade that risked 400 and made 340 is 0.85. Add the multiples, divide by the number of wins.
This tells you the average outcome of a trade, treating every trade as one equal observation. It is the right tool for a narrow question: when this setup works, how far does it usually run relative to what I was risking? That is a question about the setup, not about the account.
Method two, weighted by the money at risk
Add up every unit you won. Add up every unit you lost. Divide the average win in money by the average loss in money. No ratio column, no per trade multiples, just two totals and a division.
This tells you the average outcome of your capital. It is the figure that combines with your win rate to say whether the book makes money, and it is the only one of the two that has any claim on the word “average” when you are talking about an account rather than a setup.
On a journal where you risked exactly the same amount on every single trade, the two methods return the same number and none of this matters. On any other journal they come apart, and they come apart in a predictable direction.
The Forty Trade Sample Where They Disagree
Here is a deliberately ordinary sample. Forty closed trades. Eighteen wins, twenty two losses, a 45.0 percent win rate. Every loss is a full stop out, so a loss costs exactly the money that trade risked. The only thing that changes across the sample is size: the first twenty trades risked 100 units each, and the last twenty risked 400 units each, which is what happens when someone has a decent run and starts sizing up.
The units are abstract on purpose. No gold price appears anywhere in this article, and none is needed, because every figure here is a ratio.
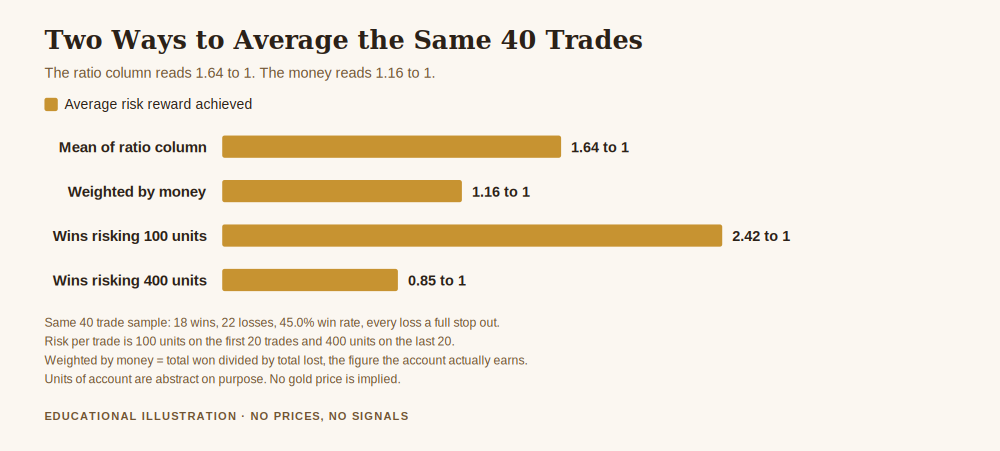
Method one returns 1.64 to 1. Method two returns 1.16 to 1. Same forty trades, same journal, no arithmetic errors in either. The ratio column overstates the account’s real ratio by 40.5 percent.
The median of that ratio column is 1.25, well below its own mean of 1.64, which is the first clue that something in the distribution is dragging the average around.
Why the Gap Opens, and Why It Always Flatters
Split the wins by size and the mechanism is obvious. The wins taken while risking 100 units averaged 2.42 to 1. The wins taken while risking 400 units averaged 0.85 to 1.
The unweighted mean treats one of those small, excellent trades as exactly one vote, and one of those large, mediocre trades as exactly one vote. The account does not. The account experiences the large trades four times as loudly. When the good ratios happen to sit on the small bets and the poor ratios sit on the large ones, averaging the column without weighting quietly discards the fact that most of the money was riding on the worse outcomes.
The direction is not random, and this is the part worth internalising. Sizing tends to increase after wins and stay small during the tentative early phase of a system. Ratios tend to be best when a position is small enough to leave alone and worst when it is large enough to feel, because a large position gets managed, trimmed and closed early. Those two tendencies point the same way. The bets that get the best ratios are systematically the ones carrying the least money, so the unweighted average is not merely noisy, it is biased upward on most real journals.
A second, smaller distortion sits on top. A ratio column has a floor of zero and no ceiling. One trade that ran to 4.10 pulls the mean up much harder than a 0.50 pulls it down. That is why the median sits so far below the mean here, and it is why a single outlier month can make a mediocre year read well.
The Number That Decides Whether the Ratio Is Enough
An average risk reward ratio is not a verdict on its own. It only becomes one when you put it next to the win rate, because the pair together decide whether the book breaks even.
The break even win rate for a given ratio is one divided by one plus the ratio. At the honest 1.16 to 1, this sample needs a 46.2 percent win rate simply to stand still. It produced 45.0 percent. Those 1.2 percentage points are the whole story: over the forty trades the sample lost 260 units against 10,000 units of money risked, which is 2.6 percent of everything put at risk.
Now run the same test using the flattering figure. At 1.64 to 1, the break even win rate is 37.9 percent, and a 45.0 percent win rate looks like a comfortable margin. The ratio column does not just overstate a statistic. It converts a losing system into an apparently healthy one, and it does so without any dishonesty on the trader’s part.
This is worth holding next to what regulators observe across the retail population. When ESMA introduced its product intervention measures on 27 March 2018, it stated that 74 to 89 percent of retail accounts typically lose money, with average losses per client running from 1,600 to 29,000 euros. Nobody in that group set out to lose. A measurement that reads high by forty percent is one of the quieter ways an account can stay in that statistic while its owner believes the numbers are fine.
Get the free Gold Empire survival sheet, a one page guide to protecting your account from the measurements that quietly mislead you, including the two column check described here. One email, no spam, unsubscribe anytime.
How to Run This on Your Own Journal
You do not need new software. You need four totals and about ten minutes.
Total the money you risked on every closed trade. Not the position size, the money that would have been gone had the stop been hit. If your journal does not record this, that is the first thing to fix, because every figure below depends on it and no ratio means anything without it.
Total the money won on winners, and the money lost on losers. Two sums, in currency, ignoring ratios entirely at this stage.
Divide the average win by the average loss. That is your real average risk reward ratio. Write it next to whatever your ratio column has been telling you. On a book where size has changed, expect the two to differ, and expect the column to be the higher of the pair.
Compare it against your win rate. One divided by one plus the ratio gives the win rate you need to break even. If your actual win rate is below that number, the system is losing money regardless of how any individual trade felt, and no amount of ratio improvement fixes it while the sizing pattern stays as it is.
Then do one more thing, because it is where the diagnosis usually lives. Split the wins by position size and average each group separately. If the small trades carry the good ratios and the large ones carry the poor ratios, as they do in the sample above, the problem is not your entries. It is that the trades you believe in most are the ones you manage worst, and that is a sizing and discipline problem rather than an analysis problem. How much to risk per trade and position sizing for gold are where that gets decided, and deciding it before entry is the only version of the decision that works.
Frequently Asked Questions
How do I calculate average risk reward ratio in one line?
Divide your average winning trade in money by your average losing trade in money, using every closed trade. Do not average the per trade ratio column unless you risked an identical amount on every trade, because when risk varies that average describes your setups rather than your account.
Which of the two averages is the correct one?
Both are correct for different questions. Weighted by money is correct for judging whether the account makes money, which is almost always what people mean. The unweighted ratio column is correct for judging how far a particular setup tends to run, which is useful when you are comparing setups against each other at a constant size.
Why is my ratio column higher than my real ratio?
Almost always because your position size has not been constant, and your better ratios landed on your smaller positions. The unweighted mean gives every trade an equal vote while your account gives every trade a vote proportional to the money on it. A long right tail in the wins widens the gap further, which is why the median of a ratio column usually sits well below its mean.
What win rate does my average risk reward ratio need?
One divided by one plus the ratio, before costs. A 1.16 to 1 ratio needs 46.2 percent, a 2 to 1 needs 33.3 percent, a 3 to 1 needs 25 percent. Spread and any overnight financing push all of those requirements higher, so treat the result as a floor rather than a target.
How many trades before this measurement means anything?
More than most people have. Forty trades, as in the sample here, is enough to demonstrate the arithmetic and nowhere near enough to establish that a given ratio is a stable property of a system. Treat any figure from a short sample as a description of what has happened rather than a forecast of what will.
Where did the numbers in this article come from?
The forty trade sample is constructed, not measured, and it is stated as such throughout. Every figure computed from it is my own arithmetic on the assumptions written into the text: full stop outs on losses, 100 units of risk on the first twenty trades, 400 on the last twenty. The retail loss figures are ESMA’s own, published with its 27 March 2018 measures and linked above. None of it describes any real account, mine or anyone else’s.
Where Gold Empire fits
Gold Empire is free to follow. Daily gold analysis with the reasoning attached, losing days included, and an optional Kit for people who want the survival side written down in one place. There is no promise of a return here, because nobody honest can make one.
Measuring a book correctly is a survival topic rather than a technical one, which is why it sits under risk management in gold trading. If the ratio you are measuring is being set by where you put the stop, where to place a stop loss on XAUUSD comes before this one, and why consistency beats being right covers the habit that makes the weighted and unweighted figures converge in the first place.
About the author
Matthew has spent a long time around gold, most of it learning things the slow way, and now writes them down so other people can learn them the fast way. He is more interested in the mechanics that quietly drain accounts than in the setups that fill timelines. Nothing in this article is personal advice, and no entry, stop or target discussed should be treated as a signal.
This article is educational content about the arithmetic of measuring a trading record. It is not investment advice, not a recommendation of any broker, platform or account type, and not a solicitation to trade. The forty trade sample is a constructed illustration chosen to demonstrate a method, not a measurement of any real account, and it should not be read as a claim about results, mine or anyone else’s. The retail loss figures are published by the European Securities and Markets Authority with its product intervention measures of 27 March 2018; the rules described there apply to particular jurisdictions and account types and may have changed since, so check what applies to you. Further general warnings for retail participants are published by the CFTC in its customer advisories. Every other figure here is my own arithmetic on the stated assumptions. Trading gold carries a real risk of losing money, including more than you deposit in some account types. No gold price level is quoted anywhere in this article. Nothing accounts for your personal circumstances, and no entry, stop or target discussed should be treated as a signal. If you are unsure, speak to someone properly qualified in your own jurisdiction before you risk anything.
One step first
Where should we send the Gold Survival Sheet?
Leave your email and we will send the free one page checklist, then take you straight to the Telegram channel.
No cost and no obligation. Educational only, not financial advice, and nothing here promises a return. Unsubscribe any time in one click.
Leave a Reply