
Every few months somebody tells me bitcoin is digital gold, and every few months I find myself giving the same unsatisfying answer: that is not a claim, it is a slogan, and slogans cannot be checked. What can be checked is gold vs bitcoin volatility, because volatility is a measurement rather than an opinion. You take the two price series, you compute how much they move, and the number comes out the same whoever runs it. So I ran it, over the twelve months ending yesterday, and I am going to show you the arithmetic rather than the conclusion.
The reason this matters is not that it settles an argument at a dinner table. It is that if you already trade gold and you are thinking about putting part of the same account into bitcoin, the difference in volatility decides how large that position is allowed to be before it is carrying more risk than the gold position it sits next to. Most people size the second instrument the way they sized the first, and that is where the trouble starts.
What Gold vs Bitcoin Volatility Actually Measures
Volatility measures dispersion, not direction. It tells you how widely the daily returns are scattered around their own average. It does not tell you whether an asset went up or down over the period, it does not tell you whether it is a good thing to own, and it says nothing whatsoever about what happens next.
That last point is worth sitting with, because volatility is the single most misread number in this business. A high volatility asset is not one that is falling. A low volatility asset is not one that is safe. Volatility describes the width of the distribution of daily moves, and an asset can be extremely volatile on the way up. Bitcoin’s largest single day in my sample was a gain, not a loss.
The standard way to express it is annualised standard deviation of logarithmic returns. Take each day’s move as the natural log of today’s close divided by yesterday’s, compute the standard deviation of that series, then scale it up to a yearly figure. The output is a percentage, and it is roughly interpretable as the range within which about two thirds of annual outcomes would fall if returns were normally distributed, which they are not. Nobody should lean hard on that interpretation. Use it as a ruler for comparing two things, which is exactly what I am about to do with it.
The Numbers, and Exactly How I Got Them
Here is the method, in enough detail that you could reproduce it and get my numbers to the decimal place. That is the point of writing it down.
For gold I used the LBMA Gold Price, afternoon auction, in dollars per troy ounce. That is the London benchmark, it is published by the London Bullion Market Association, and it is the closest thing gold has to an official daily close. For bitcoin I used the daily dollar close from the CoinGecko market chart endpoint, which is a public price aggregator.
The window is the twelve months from 22 August 2025 to 21 August 2026 inclusive. Bitcoin trades every day of the year and gold does not, so I used only the dates present in both series. That left 251 common dates and therefore 250 daily returns for each asset. Both assets are measured on an identical set of days, which is the part people usually get wrong: comparing a 365 day series against a 252 day series inflates the crypto number for a purely calendrical reason and tells you nothing.
The results, over those 250 shared observations:
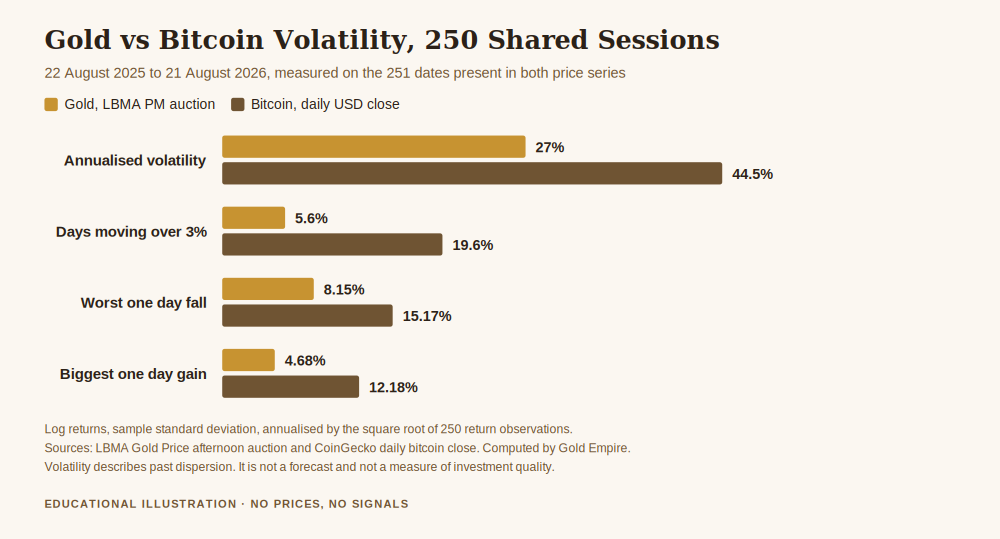
- Gold, daily standard deviation: 1.710%. Annualised: 27.0%.
- Bitcoin, daily standard deviation: 2.812%. Annualised: 44.5%.
- Ratio of bitcoin volatility to gold volatility: 1.64 times.
So over this particular year, bitcoin was about two thirds again as volatile as gold. Not ten times. Not a hundred times. If you were expecting a bigger gap, hold that thought, because the gap is bigger than 1.64 in the way that actually costs money, and the average is hiding it.
Why the 1.64 Ratio Is the Least Interesting Number Here
Standard deviation is an average, and averages are calm by construction. They smooth over precisely the days that end accounts. So I counted the large days directly instead.
Over the same 250 sessions, gold moved more than 3% in a single day on 14 occasions, which is 5.6% of days. Bitcoin did it on 49 occasions, which is 19.6% of days. That is a ratio of about 3.5 to 1, more than double the 1.64 you get from comparing the standard deviations. Roughly speaking, gold handed you a 3% day about once a month, and bitcoin handed you one about once a week.
The single worst days tell the same story. Gold’s largest one day fall in the sample was 8.15%, on 30 January 2026. Bitcoin’s was 15.17%, on 6 February 2026. Bitcoin’s largest single day gain, 12.18%, landed on the final day of the sample.
This is the thing to take away. The volatility ratio says the two assets are within shouting distance of each other. The frequency of large moves says they are not. When people are surprised by a crypto position, it is almost never because the annualised number surprised them. It is because a Tuesday did.
What This Does to Position Size
Now the practical half, and this is arithmetic rather than advice.
Suppose you want a bitcoin position to carry the same amount of risk, in currency terms, as a gold position you are already comfortable with. Risk in currency terms is roughly position value multiplied by volatility. If bitcoin is 1.64 times as volatile, then to hold the risk constant, the bitcoin position has to be smaller by the inverse of that ratio. One divided by 1.64 is 0.61. The bitcoin position would be about 61% of the size of the gold position.
Read that the other way round, because that is the direction the mistake runs. If you take a position size that felt reasonable in gold and you apply the same size to bitcoin, you have not taken the same risk. You have taken about 1.64 times the risk, silently, without deciding to. Nothing on your screen tells you this. The platform shows you a position, not a risk contribution.
And because the tails are 3.5 times more frequent rather than 1.64, the sizing correction that keeps your average day comfortable still leaves you meeting a large day far more often than you are used to. Sizing for the standard deviation is the floor of the work, not the ceiling.
I am deliberately not telling you what either position should be. That number depends on the size of your account, what else is in it, and what you can absorb without changing how you behave, and I do not know any of those things about you. What I am telling you is that the two positions should not be the same size, and that most people’s are.
One Honest Caveat About Gold’s Own Number
Gold at 27% annualised volatility is high by gold’s own historical standards. Gold has spent long stretches of its history nearer half that. This particular twelve month window contained an 8.15% single day fall in a metal that frequently goes years without one, so the number you are reading reflects an unusually active period for gold rather than a permanent property of it.
That cuts both ways for the comparison. If gold reverts to a quieter regime and bitcoin does not, the ratio widens. If both quieten, it may not move much at all. A twelve month window is a snapshot, and I chose it because it is recent and because both series are complete across it, not because it is representative of anything. Run the same code over a different year and you will get a different pair of numbers. That is not a flaw in the method, it is the honest situation, and anyone quoting you a single volatility ratio without naming a window is selling you something.
What This Article Does Not Say
It does not say which asset is better. Volatility is not quality. A more volatile instrument is not a worse one, and a less volatile instrument is not a safer one, particularly since the lower volatility asset here is the one that can be held without counterparty risk and the higher volatility one is not.
It does not say bitcoin is or is not digital gold. That claim is about correlation, monetary properties and behaviour in a crisis, none of which I measured here. I measured dispersion. Dispersion is one narrow slice of a much larger argument, and I would rather give you the slice I can defend than an opinion I cannot.
It does not predict anything. Every figure in this article is a description of 250 days that have already happened. Volatility clusters and changes regime, and the next 250 days are under no obligation to resemble the last.
And there is not a single price level anywhere in this article, in either asset, deliberately. Everything is a percentage or a ratio, so that it remains true whatever the screen says on the day you read it.
Get the free Gold Empire survival sheet, a one page guide to the account habits that decide whether a volatile month is survivable, including how to size a second instrument next to the one you already hold. One email, no spam, unsubscribe anytime.
Frequently Asked Questions
What is the gold vs bitcoin volatility ratio right now?
Over the 250 shared trading days ending 21 August 2026, bitcoin’s annualised volatility was 44.5% against gold’s 27.0%, a ratio of 1.64 to 1. That ratio is specific to that window and will be different over a different one, so treat it as a measurement with a date attached rather than a constant.
Does higher volatility mean bitcoin is riskier?
It means the daily moves are more widely dispersed, which is one component of risk and not the whole of it. Risk also includes the chance of permanent loss, custody and counterparty exposure, liquidity in a stressed market and your own behaviour under pressure, none of which standard deviation measures.
Why measure both assets on the same days?
Because bitcoin trades roughly 365 days a year and the gold benchmark fixes only on London business days. Annualising a 365 observation series and a 252 observation series with the same formula creates a difference that comes from the calendar rather than from the market, which is why this comparison uses only the 251 dates present in both.
How do I size a bitcoin position next to a gold position?
The arithmetic in this article says that matching risk rather than matching size means the more volatile position is proportionally smaller, about 61% in this sample. The actual figures depend on your account and your tolerance, and this is a description of the calculation and not a recommendation of any position size.
Is annualised volatility the same as the volatility shown on my platform?
Often not. Platforms and indicators use varying lookback lengths, sometimes intraday data, sometimes simple ranges rather than standard deviation of log returns. Two tools can both be correct and disagree, so check what a number is measuring before comparing it to anything.
Where Gold Empire Fits
Gold Empire is free to follow. Daily gold analysis with the reasoning attached, losing days included, plus an optional Kit for people who want the method written down. Nothing here promises a profit and nothing here ever will.
Survival first, as always. Volatility is only half of the position size question and risk management in gold trading is where the other half lives. If the arithmetic above was the interesting part, how much to risk per trade and position sizing for gold take it further, and what is leverage in gold trading explains the mechanism that turns a 3% day into something much larger on your balance. For the question of which gold instrument you are actually holding in the first place, gold CFD versus physical gold covers the ground this article assumes.
About the author. Matthew writes Gold Empire. He is interested in the unglamorous half of this business, cost, size, frequency and the arithmetic of staying solvent, on the view that most accounts are lost to ordinary errors repeated patiently rather than to one dramatic mistake.
Disclaimer: This article is general educational content about measuring price volatility and the arithmetic of position sizing. It is not financial advice, not a recommendation to buy, sell or hold gold, bitcoin or any other asset, and not a suggestion to open any particular position. Trading gold, cryptocurrency, CFDs and leveraged products carries a high risk of losing money rapidly. No entry, stop or target discussed should be treated as a signal. All volatility figures were computed by me from two public sources: the LBMA Gold Price afternoon auction in US dollars, and daily US dollar closes for bitcoin from the CoinGecko market chart endpoint. Method: natural log returns between consecutive closes, sample standard deviation with one degree of freedom, annualised by the square root of the number of return observations, computed over the 251 dates from 22 August 2025 to 21 August 2026 that appear in both series, giving 250 returns per asset. Only dates present in both series were used so that the two assets are measured over identical observation dates. Because each series carries one observation per day, moves within a session are not captured and real intraday extremes were larger than any figure quoted here. Volatility is a description of past dispersion, not a forecast, and it does not measure custody risk, counterparty risk, liquidity risk or the risk of permanent loss. The 61% figure is the inverse of the measured volatility ratio and is an illustration of equal risk arithmetic, not a recommended position size. No price level for gold or bitcoin is quoted anywhere in this article and no trading results are represented. Past behaviour of any price series is not a prediction.
One step first
Where should we send the Gold Survival Sheet?
Leave your email and we will send the free one page checklist, then take you straight to the Telegram channel.
No cost and no obligation. Educational only, not financial advice, and nothing here promises a return. Unsubscribe any time in one click.
Leave a Reply