

Ask around in any trading group and you will be handed a dozen patterns before anyone asks what you are actually trying to do. This article takes a narrower path. Below are 5 price action rules every trader needs to know, and rather than assert them, I have tested each one against ten complete years of the daily gold benchmark so you can see the arithmetic underneath.
These are not entry signals. They are constraints, the sort of thing that decides whether you are still in this business in two years. No entry, stop or target discussed should be treated as a signal.
Before the rules, one word on where the numbers come from, because a rule without evidence is just an opinion said loudly.
Where these numbers come from
Everything I quote below comes from one source: the LBMA Gold Price, the daily benchmark administered in London and used across the industry for settlement and valuation. I downloaded the afternoon benchmark series and measured the window from 1 January 2016 to 31 December 2025, which is 2,506 published benchmark days, ten complete calendar years.
Two assumptions worth stating plainly, because you should never accept a statistic without them. First, one “day” here means one benchmark publication, so weekends and London holidays simply do not exist in the series. That works out at an average of 250.6 benchmark days per year. Second, every percentage is measured benchmark to benchmark, close of one to close of the next, which means intraday swings are invisible to it. The daily numbers below are therefore the calm version of reality, not the dramatic one.
The 5 price action rules every trader needs to know, in order
They are in this order deliberately. The first two decide how often you trade, which matters more than the last three combined.
Rule 1: The chart records what happened, it does not lean anywhere
The most common thing a beginner does with a chart is extend it. Yesterday closed strong, so today should follow. It is such a natural way for a mind to work that it barely registers as an assumption.
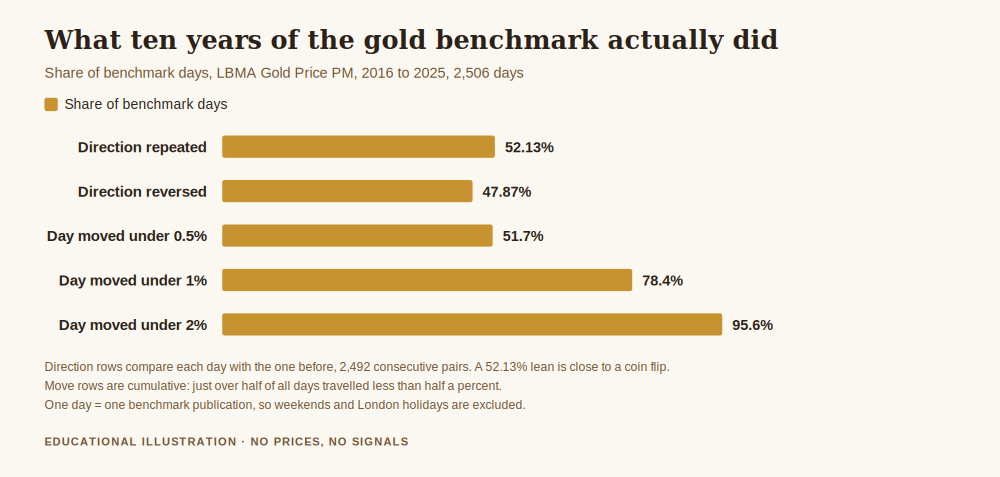
Here is what the benchmark actually did. Across 2,492 consecutive pairs of days in that ten year window, the gold benchmark moved in the same direction as the previous day 52.13 percent of the time, and in the opposite direction 47.87 percent of the time.
Read that carefully, because it is easy to read it as support for momentum. Yesterday’s direction gets you 52 out of 100 rather than 50 out of 100. That is a coin very slightly out of true, and it is nowhere near enough to pay for a spread, a commission and a wrong guess about size. Anyone who tells you gold trends reliably from one day to the next is describing a two percentage point lean as if it were a law.
What follows from this is not “never trade continuation”. It is that direction alone is close to worthless, so whatever you are trading, the reason had better be something other than “it went up yesterday”. Price action is a record of transactions that already happened. It has no memory and no obligation.
Rule 2: Most days are not worth your attention
In the same window, 51.7 percent of benchmark days moved less than half a percent. 78.4 percent moved less than one percent. The average absolute daily move was 0.661 percent, and the median was 0.480 percent, which is lower still because a handful of violent days drag the average up.
So slightly more than half of all trading days are, for practical purposes, quiet. If you sit at a screen every one of those 250 days looking for something to do, the market will oblige you, because a chart at sufficient magnification always looks like it is doing something.
This is the rule that saves the most money and gets ignored the most often. The trader who takes twenty positions a month in a market that is genuinely moving on maybe eight of those days is not being more active, they are paying the spread twelve extra times for the privilege of watching noise. Patience is not a personality trait here, it is a cost control measure.
Rule 3: A level only counts if you marked it before price arrived
Levels drawn after the fact always look perfect. That is not because you have a good eye, it is because you can see where price turned, and you are drawing to the answer.
The discipline is simple to state and hard to keep: mark your levels when the market is closed or quiet, write down what you expect to happen at each one, and then do not move them because price is approaching. A level you shifted twenty minutes ago is no longer a level, it is a rationalisation with a line attached.
I have written separately on how these zones actually form in what support and resistance means in gold trading. The mechanics matter, but the sequencing matters more. Marked first, then traded. Never the other way round.
Rule 4: Context outranks pattern, every time
The same candle formation means opposite things depending on where it appears. An engulfing candle at the top of an extended run and the identical shape in the middle of a range are not the same event, and no pattern label captures the difference.
This is why pattern lists are such a poor way to learn. A list gives you thirty shapes and no way to rank them, and the beginner ends up finding all thirty every session. What you actually need is a read on the structure first, then a look at whether the candle in front of you fits it or fights it. That order of operations is the whole skill, and I laid out the structural side in what market structure is in gold trading.
If you take one thing from this rule: a pattern is a sentence, and structure is the paragraph it sits in. Reading the sentence alone is how people end up confidently wrong.
Rule 5: Size the position before you like the trade
The fifth rule is the one that keeps the other four from mattering.
Recall that 95.6 percent of benchmark days moved less than two percent. That sounds reassuring until you turn it around: roughly one day in every twenty-three moved more than two percent, and on a leveraged account the arithmetic of those days is what decides whether you are still trading next year. You do not get to know in advance which day it is.
So the size and the exit have to be decided while you are indifferent, before the chart has had a chance to persuade you. Once you like a trade, every number you choose will be a little more generous than it should be. That is not weakness, it is how anyone behaves when they already want something. The defence is sequence: decide the risk, then look at the setup. Where that line belongs is the subject of where to place a stop loss on XAU/USD, and the broader framework sits in risk management for gold trading.
Why rules beat instinct here
There is a reason I keep pushing constraints rather than techniques, and it is not modesty about my own reading of a chart.
The European Securities and Markets Authority, when it introduced its product intervention measures on contracts for difference, published what national regulators had found across EU jurisdictions. Their analyses showed that 74 to 89 percent of retail accounts typically lose money, with average losses per client ranging from 1,600 to 29,000 euros.
That is a wide band because different regulators measured different populations, and it is worth reading honestly rather than as a scare statistic. What it says is that the base rate for this activity is poor, and it is poor across every jurisdiction that looked. Nothing in that finding is about pattern recognition. It is about cost, size, frequency and staying power, which is exactly what rules 2 and 5 govern.
If the base rate is that unforgiving, then the sensible first goal is not to find a better entry. It is to stop doing the things that make the base rate what it is.
How to actually put these into practice
Reading a rule and running one are different activities. Here is the version I would give someone starting on Monday.
Write the five rules on one page, in your own words, and keep the page where you can see it. Rules held in memory quietly soften. Then, for a month, log every position against them: which rule, if any, you broke. Do not try to improve your results during that month. Just measure.
Most traders discover the same thing, which is that rule 2 accounts for the bulk of the damage. Not bad analysis, simply too many positions on days that were never going anywhere. If that is what your log says, you now have a specific problem to fix rather than a vague sense that you should be more disciplined.
If reading charts calmly is the part you find hardest, how to read a gold chart with a clear head covers the practical side of that.
Get the free Gold Empire survival sheet, a one page guide to the constraints that keep an account alive through exactly the kind of market this article describes. One email, no spam, unsubscribe anytime.
Frequently asked questions
Are these 5 price action rules every trader needs to know enough on their own?
No, and I would be suspicious of anyone who said otherwise. They are constraints, not a method. They tell you when not to act and how much to risk when you do, which leaves the question of what you are actually looking for entirely open. What they do is stop the two errors that end most accounts, trading too often and sizing after falling in love with a chart.
Does the 52.13 percent figure mean momentum trading does not work?
It means daily direction on its own carries almost no information for this instrument in this period. Momentum approaches that work tend to operate on different horizons, with filters and position management doing much of the work. The figure is a warning against the naive version, the one that reads a green day as a reason to buy.
Why measure a daily benchmark rather than intraday candles?
Because the LBMA benchmark is a published, auditable price with a documented methodology, which means you can check every number in this article yourself. Intraday feeds vary between brokers, so any statistic drawn from one is really a statistic about that broker. The tradeoff is that daily data understates intraday movement, and I would rather understate it than quote something you cannot verify.
Do these rules apply to instruments other than gold?
The rules do. The specific percentages do not, and you should not carry them across. Every market has its own distribution of quiet and violent days, and the honest thing to do is measure your own rather than borrow mine.
How long before rules like these show up in results?
Longer than most people are willing to wait, because the benefit arrives as an absence. You do not see the losses you did not take. This is why the month of logging matters, it gives you something to look at other than the balance, which is far too noisy to judge a change of behaviour by.
Is it worth trading at all if 74 to 89 percent of accounts lose money?
That is a fair question and it deserves a straight answer rather than a sales one. That base rate is real, and anyone deciding to trade should decide it with the number in front of them. What I can say is that the figure describes a population that overwhelmingly trades too large and too often, and that the sensible response is either to fix those two things or to conclude that the activity is not for you. Both are respectable answers.
Where Gold Empire fits
Gold Empire is a free Telegram channel where I post gold analysis with the reasoning stated before the move rather than after it, losing days included, because a record that only shows the good days is not a record. There is nothing to buy in order to follow along, and an optional Kit if you want more structure later. I do not publish profit claims, and given the ESMA figures above, you should be wary of anyone who does.
The free survival sheet is the one page version of the constraints in this article, meant to sit next to your screen rather than in a folder.
About the author. Matthew writes Gold Empire. He is interested in the unglamorous half of this business, cost, size, frequency and the arithmetic of staying solvent, on the view that most accounts are lost to ordinary errors repeated patiently rather than to any single dramatic trade.
Disclaimer: This article is general educational content about how price data and leveraged markets behave. It is not financial advice and it is not a recommendation to buy or sell anything. Trading gold, CFDs and leveraged products carries a high risk of losing money rapidly. No entry, stop or target discussed should be treated as a signal. All statistics are computed from the published LBMA Gold Price PM benchmark for 2016 to 2025, with the assumptions stated in the article, and external figures are linked so you can check them yourself.
One step first
Where should we send the Gold Survival Sheet?
Leave your email and we will send the free one page checklist, then take you straight to the Telegram channel.
No cost and no obligation. Educational only, not financial advice, and nothing here promises a return. Unsubscribe any time in one click.
Leave a Reply