GOLD EMPIRESurvive First, Then Grow

Category: Tools & Brokers

  • How to Trade XAUUSD in US Accounts, and Why the Order Gets Rejected

    How to Trade XAUUSD in US Accounts, and Why the Order Gets Rejected

    A reader in Ohio sent me a screenshot last month. His platform showed XAUUSD, the chart was live, the spread was quoted, and every time he tried to open a position the order was rejected. He assumed his account was broken, then that his broker was scamming him, and by the time he wrote to me he was about to wire money to an offshore firm that had promised him it would work.

    That last step is the one that ends accounts, so it is worth answering the question properly. How to trade XAUUSD in US accounts is not a platform problem, and it is not a broker being difficult. It is a rulebook, and once you can see the rulebook the answer becomes straightforward: the instrument most of the world calls XAUUSD is largely not available to United States retail clients in the form they are used to, and the routes that are available are different products with different arithmetic.

    Nobody explains this to people before they have already deposited somewhere, which is precisely why it costs them money. So here is the structure, the actual published numbers, and what changes about position size when you take one route rather than another.

    How to Trade XAUUSD in US Accounts, and Why the Order Gets Rejected

    Start with a distinction that sounds pedantic and is worth real money.

    XAUUSD as it appears on most international platforms is a contract for difference or a rolling spot contract on gold. You never receive metal. You hold a leveraged bilateral contract with your broker whose value tracks the gold price, and you close it for cash. That is one product.

    The United States regulates that product as a commodity transaction, not a currency one, and that single classification decides everything else. The Commodity Exchange Act, in section 2(c)(2)(D), covers leveraged or margined retail transactions in commodities and treats them as though they were futures contracts, which means they must be traded on a registered exchange through registered intermediaries. There is an exception, and the exception is where gold falls out: the transaction escapes that treatment only if it results in actual delivery within 28 days. The CFTC restated this in its final interpretive guidance on actual delivery of 24 March 2020, where it describes the 28 day limit and what possession and control have to mean for delivery to count.

    A rolling XAUUSD position does not deliver anything to you in 28 days. It rolls. So it does not fit the exception, and it therefore has to live on an exchange, and a retail contract for difference is not an exchange product. That is the whole mechanism. The rejection on the screen is that paragraph, expressed as an error message.

    The confusion comes from the currency side, where a genuinely different regime applies. The CFTC’s retail foreign currency rules, published on 10 September 2010 and effective 18 October 2010, created a registration category called the retail foreign exchange dealer and allow leveraged off exchange trading in currency pairs through those registered firms. EURUSD is a currency pair. XAUUSD, despite the ticker looking identical in shape, is not. The rules that let an American trade the first one do not extend to the second.

    What the Same Rulebook Says About Size

    While we are inside those rules, there are two published numbers worth carrying away, because they tell you what a regulated venue is expected to look like.

    The first is the security deposit floor. Under the final retail forex rules, the Commission set minimum security deposits of 2 percent of notional value for major currencies and 5 percent for all other currencies, with the National Futures Association authorised to set the specific levels inside those parameters. Two percent is 50 to 1. Five percent is 20 to 1.

    The second is the capital requirement on the firm itself. A futures commission merchant or retail foreign exchange dealer must hold minimum net capital of 20 million dollars, plus 5 percent of the amount by which its liabilities to retail forex customers exceed 10 million dollars. That is the bar for being allowed to sit on the other side of retail trades in that market.
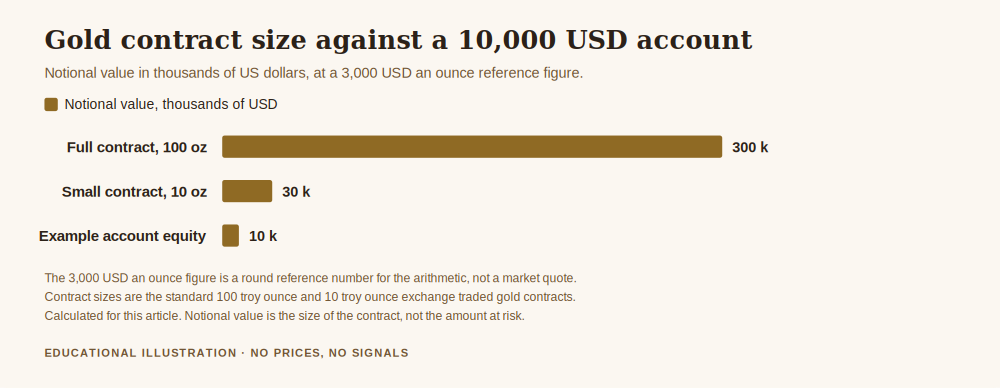
    Chart on how to trade XAUUSD in US accounts, comparing the notional exposure of a full sized and a small sized gold contract against a ten thousand dollar account
    How to trade XAUUSD in US markets means choosing a contract size first: the same account carries very different exposure depending on which contract it uses.

    Run those percentages against an account and the picture sharpens. I calculated the following for this article on the stated assumption of a 10,000 dollar account. At the 2 percent floor, that account can carry 500,000 dollars of notional value. At the 5 percent floor, it can carry 200,000 dollars. Those are ceilings on what the rules permit, not suggestions about what is sensible, and the gap between those two ideas is where most accounts are lost. I have written about that gap at length in how much to risk per trade, and none of what follows replaces it.

    The Routes That Actually Exist

    So what is available. Three broad routes, and they are genuinely different instruments rather than three doors to the same room.

    Exchange traded gold futures. This is the direct analogue. Gold futures trade on a registered United States exchange through a registered futures commission merchant, and the contract is standardised. The full sized gold contract is 100 troy ounces and there is a smaller contract at 10 troy ounces. Using 3,000 dollars an ounce purely as a round reference number for the arithmetic rather than as a market quote, the full contract represents 300,000 dollars of notional value and the smaller one 30,000 dollars, a factor of ten between them. For a 10,000 dollar account those two contracts are not variations on a theme. One of them is thirty times the account and the other is three times it.

    Gold backed exchange traded products. Bought and sold like a share through a securities brokerage. No leverage by default, no expiry, no roll, and no margin mechanics to manage. It is a different exposure with different costs, and it is the route that has almost nothing in common with what a XAUUSD trader is used to doing.

    Physical metal. Bought outright, delivered, stored. The 28 day delivery test is satisfied trivially because you actually receive the gold. It is an ownership decision rather than a trading one.

    What is not on the list is the thing people go looking for after the rejection: an offshore firm that will accept a United States resident and offer the familiar XAUUSD ticker at high leverage. Those firms exist and they will take the deposit. What you give up is every protection the paragraphs above describe, starting with the capital requirement and ending with any practical route to recovering money from a firm outside the jurisdiction. The reader from Ohio was one wire transfer away from that, and the screenshot that started it looked exactly like a technical fault.

    What Changes About the Way You Trade

    Suppose you take the futures route. Four things change, and none of them are about analysis.

    Size stops being continuous. On a contract for difference platform you can trade 0.03 lots. On a futures exchange you trade one contract or none. The smallest available position becomes the question, and if the smallest available position is too large for your account then the honest answer is that the account is not yet the right size for the instrument, not that you should stretch. How much money to start trading gold is worth reading with this specifically in mind.

    Contracts expire. A rolling XAUUSD position can be held indefinitely. A futures contract has a delivery month, and holding one into that month has consequences a retail account does not want. Positions have to be rolled deliberately, on a date you know in advance.

    Margin is set by a clearing house, and it changes. It is published, which is an improvement on the bilateral version, but it moves, typically upward, in exactly the volatile conditions in which you would least like it to move.

    The cost structure is different. Commission per contract and exchange fees replace a spread that was buried in the quote. Neither arrangement is inherently cheaper. They are visible in different places, and the futures version is easier to measure precisely because it is itemised.

    What does not change is the part that decides whether you survive. The instrument determines your minimum size, your expiry and your fee structure. It does not determine your risk per trade, your stop discipline or whether you can sit out a session. Those were always the constraint, and they remain the constraint on a different venue. Risk management in gold trading is the piece that holds all of this together, and it applies identically whichever route you end up on.

    Free gold survival sheet

    Get the free Gold Empire survival sheet, a one page guide to protecting your account when the instrument or the venue changes underneath you. One email, no spam, unsubscribe anytime.

    Get the free survival sheet →

    Frequently asked questions

    How to trade XAUUSD in US accounts, in one sentence?
    In the familiar leveraged off exchange form, generally you cannot, because United States rules treat leveraged retail gold as a commodity transaction that must go through a registered exchange unless it delivers metal within 28 days; the available routes are exchange traded gold futures, gold backed exchange traded products, or physical metal.

    Why can Americans trade EURUSD but not XAUUSD the same way?
    Because currency and gold sit under different parts of the law. The 2010 retail forex rules created a registered dealer category for off exchange currency trading. Gold is a commodity, not a currency, so it falls under the retail commodity transaction provisions instead, and those require an exchange.

    Is the 28 day rule about my holding period?
    No. It is a test applied to the contract, not to you. It asks whether the arrangement results in actual delivery of the metal, with possession and control passing to the buyer, within 28 days of the transaction. A rolling cash settled position does not, which is why it does not qualify.

    Can I just use an offshore broker?
    Firms outside the jurisdiction will often accept the account. What you are giving up is the capital requirements, the segregation rules and any realistic route to recovering funds if the firm fails or simply stops answering. That is a large amount of protection to trade away for a familiar ticker.

    Which route is best for a small account?
    That depends on facts about your situation that this article cannot see, and it is a question for a licensed professional in your jurisdiction rather than for a blog. What this article can tell you is the arithmetic: a smaller contract carries roughly a tenth of the notional exposure of the full sized one, and no entry, stop or target discussed should be treated as a signal.

    Where did the numbers in this article come from?
    The 28 day actual delivery test and the description of CEA section 2(c)(2)(D) come from the CFTC final interpretive guidance of 24 March 2020, linked above. The 10 September 2010 publication date, the 18 October 2010 effective date, the 2 percent and 5 percent security deposit floors and the 20 million dollar capital requirement plus 5 percent of customer liabilities above 10 million dollars come from the CFTC retail foreign currency page and its published question and answer document, also linked. The notional value figures were calculated for this article from the contract sizes and a 3,000 dollar an ounce reference figure chosen for legibility, not taken from any market quote.

    Where Gold Empire fits

    Gold Empire is free to follow. Daily XAU/USD analysis on Telegram with the level and the risk written down before the trade, losing days included. There is a free survival sheet for anyone who wants the capital protection side on one page, and an optional kit for people who want the full process. No profit is promised anywhere, because nobody can promise one.

    If the venue question is live for you, how to open a gold trading account covers the practical steps and the checks worth making first, what is leverage in gold trading explains what those security deposit percentages actually do to an account, and the author page explains who writes this and why.

    About the author. Matthew writes Gold Empire. He spends most of his time on the survival end of this job, the part where an account is still there in twelve months, and he has a particular interest in the rules people only discover after they have already sent money somewhere. Nothing here is a recommendation, and no entry, stop or target discussed should be treated as a signal.


    Disclaimer: This article is general educational content about the regulatory structure of gold trading for retail clients in the United States. It is not financial advice, not legal advice, not tax advice and not a recommendation to buy, sell or use any product, venue or firm. It is a summary written for general readers and is not a statement of the law; rules change, they depend on your residency, your status and the legal entity holding your account, and only a licensed professional can tell you what applies to you. The regulatory figures are quoted from the CFTC sources linked in the text, which were checked and reachable at the time of writing. The notional value figures were calculated for this article from clearly stated assumptions, and the 3,000 dollars an ounce reference used in the arithmetic is a round number chosen for legibility rather than a market quotation. Leveraged trading in gold carries a high risk of losing money rapidly, and a majority of retail accounts lose money. Past behaviour of any market does not indicate future behaviour. No entry, stop or target discussed should be treated as a signal.


  • How to Modify a Trade on MT4 Without Making It Worse

    How to Modify a Trade on MT4 Without Making It Worse

    There is a button in MetaTrader 4 that has cost more accounts than any indicator ever will. It is not a dramatic button. You right click an open position, choose Modify or Delete Order, and a small window appears with two fields in it. That is the whole feature. And yet how to modify a trade on mt4 is one of those questions where the mechanical answer takes ninety seconds and the important answer takes the rest of this article, because the platform will happily let you do something that quietly doubles what you stand to lose.

    So I am going to cover both. First the mechanics, properly, including the two things that go wrong and the error message nobody explains. Then the arithmetic of what each kind of modification actually does to your risk, which is the part that decides whether you are still trading in a year. No gold price appears anywhere in this article, and nothing here is a signal.

    How to Modify a Trade on MT4: What the Feature Actually Is

    Start with a definition, because the word modify is doing a lot of work and MetaQuotes is precise about it. In their own documentation, managing a trade position consists of opening a position, modifying a position, placing pending orders, modifying or deleting pending orders, and closing a position. And MetaQuotes defines modifying a position as changing the Stop Loss and Take Profit levels attached to the open position.

    Read that again, because it is narrower than most people assume. Modifying a position in MT4 changes two things and only two things: where your stop sits and where your target sits. It does not change your entry price, which has already happened. It does not change your lot size, which is fixed at the moment of execution. If you want a different size, you are not modifying, you are closing part of the position or opening another one, and those are different operations with different consequences.

    That distinction matters more than it sounds, and I will come back to it, because almost every expensive mistake in this area comes from someone changing the stop when what they actually wanted was a different size.

    The mechanical steps

    In the Terminal window at the bottom of the platform, on the Trade tab, you will see your open positions. Right click the one you want and choose Modify or Delete Order. You can also double click the Stop Loss or Take Profit cell on that row, which opens the same window.

    The order window appears with Type set to Modify Order. You will see two fields, Stop Loss and Take Profit, each with a Copy As button next to it that fills in the current market price so you can adjust from there rather than typing a full number. Enter the levels you want and click the long Modify button in the middle. If the field is greyed out or the button does nothing, that is not a bug, and the next section explains it.

    The same window handles pending orders, with one addition: for an order that has not triggered yet you can also change the price at which it triggers and its expiry, because nothing has been executed and everything is still adjustable. The four pending order types, Buy Limit, Buy Stop, Sell Limit and Sell Stop, are all editable in this way until the moment they fill, at which point they become positions and the narrower rules above apply.

    The two things that go wrong

    The Modify button will not activate. The most common reason is that you have not actually changed anything yet, since MT4 keeps the button inert until the values differ from what is already set. Type a different number and it wakes up.

    You get an invalid stops error. This is the one that generates confusion, and it is not your platform misbehaving. Brokers set a minimum distance from the current price inside which a stop or a target may not be placed, and if you try to put your level closer than that, the server rejects the modification. The distance is a broker setting rather than a platform setting, it differs between firms and between instruments, and it can widen during volatile periods precisely when you most want to move something. Which is worth knowing in advance: the ability to place a stop very close to price is not a feature you are guaranteed at the moment you need it.

    The Modification That Is Almost Always Fine

    Moving a stop in the direction of your entry, tightening it, reduces the money at risk on the position. Nothing about that is dangerous to your account arithmetic. You have decided to accept a worse chance of the trade working in exchange for a smaller loss if it does not, and whether that trade off is wise depends on your plan rather than on the platform.

    The specific case worth naming is moving the stop to your entry price, which turns the position into one that can no longer lose money at the broker level, ignoring spread and slippage. It has a name and its own considerations, and I have written about them separately in what a break even stop in gold trading is. The point here is only that it belongs to the safe direction, arithmetically speaking.

    Adjusting a Take Profit is similarly unremarkable in risk terms. Whether you should is a question about your method. It cannot increase your loss.

    The Modification That Ends Accounts

    Now the other direction, and this is the whole reason the article exists.

    Price moves against your open position. It approaches your stop. You look at the chart and a reason arrives, fully formed and entirely convincing, that the stop is a little too tight, that the level is about to hold, that a few more points of room is all this needs. So you open Modify Order and drag the stop further away.

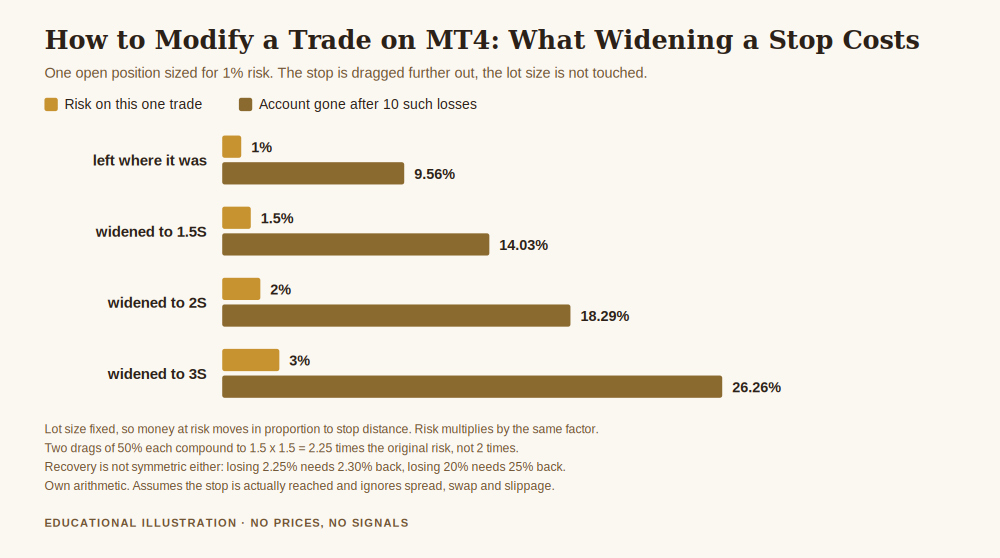
    Here is what you have just done, in numbers. You sized that position so that hitting the stop would cost you a fixed amount, call it one percent of the account. Your lot size is fixed, and MT4 will not change it in this window. Money at risk equals lot size multiplied by the distance to the stop. Move the stop twice as far away and the lot size does not move to compensate, so the money at risk doubles. The risk multiplies by exactly the factor you widened by.

    Chart for how to modify a trade on mt4, showing that widening a stop from S to 3S triples the risk on the trade from 1 percent to 3 percent of the account
    How to modify a trade on mt4 without changing the risk you agreed to: the lot size does not move when the stop does.

    Widen by half and one percent becomes 1.5 percent. Double the distance and it becomes two percent. Triple it and it becomes three percent, three times the loss you agreed to when you had a calm view of the situation.

    And it compounds within a single trade, which is the part people miss. Two drags of fifty percent each are not a hundred percent more risk. They multiply: 1.5 times 1.5 is 2.25. You will have taken a one percent risk and turned it into 2.25 percent while feeling, both times, that you were making a small adjustment.

    The second bar in that chart is the one worth sitting with. Lose ten trades at the original one percent over a year and you are down to 90.44 percent of the account. Lose ten trades that each became 2.25 percent through this exact habit and you are down to 79.65 percent. Same ten losing trades, same method, same market. The gap is 10.79 percentage points of your capital, and every point of it was created by a button rather than by the market.

    Recovery is not symmetric either, which is the quiet part of the arithmetic. Losing 2.25 percent requires 2.30 percent to get back to level, because you are now earning on a smaller base. That gap is trivial at small numbers and brutal at large ones: a 20 percent loss requires 25 percent to recover, and a 50 percent loss requires 100 percent. Every widened stop moves you a little further along that curve.

    Why the Reasoning Feels So Convincing

    I want to be fair to the impulse, because dismissing it as indiscipline is both rude and useless.

    The reason it feels right is that it is occasionally correct. Sometimes price does turn around just past where your stop was, and the trade you widened for goes on to work. That is a genuine outcome and it happens often enough to teach you the wrong lesson very effectively. The problem is not that widening never works. The problem is that it pays out immediately and charges you later, so the feedback arrives in the wrong order for learning anything true.

    There is also a structural point. At the moment you are considering the modification, you are the worst informed you have been about this trade all day. You are holding an open loss, which is a poor state for judgement, and you are looking at price rather than at your plan. The version of you who set that stop had none of those handicaps. The modification is not new analysis. It is a proposal to overrule a calmer person using worse information.

    The honest test, and it costs nothing: if you were flat right now, with no position and no attachment, would you enter this trade at this price with the stop at the new level? If the answer is no, the modification is not a trading decision. It is a way of not accepting a loss that has already happened.

    Free gold survival sheet

    Get the free Gold Empire survival sheet, a one page guide to protecting your account from the small decisions that quietly enlarge a loss, including a rule for when a stop may and may not be moved. One email, no spam, unsubscribe anytime.

    Get the free survival sheet →

    A Rule Worth Writing Down Before You Need It

    The useful protection is not willpower, it is deciding the policy while nothing is at stake. Mine is three lines and it fits on a card.

    A stop may move toward the entry at any time, and away from it never. Tightening reduces risk and can be done on judgement. Widening increases it and is simply not available, so there is no decision to make in the moment.

    If the stop looks wrong, the position was sized wrong. The correct response to a stop that feels too tight is a smaller position with a wider stop, decided before entry. That is a sizing exercise, and it belongs in how to calculate lot size for gold and forex rather than in the Modify window.

    Set the stop when you open the trade, not afterwards. MT4 lets you attach both levels in the order window at entry, while you still have no position and no opinion about being right. A stop chosen then is a plan. A stop chosen while an open trade is moving against you is a reaction.

    If you want the reasoning behind where the level goes in the first place, where to place a stop loss on XAUUSD covers it, and how to manage a gold trade after you enter covers the legitimate things you can do to a position that is already open, of which widening the stop is not one.

    Frequently Asked Questions

    How do I modify a trade on MT4 in one line?
    Right click the position on the Trade tab of the Terminal window, choose Modify or Delete Order, enter new Stop Loss or Take Profit values, and click Modify. That is the entire feature, and in MetaQuotes’ own terms modifying a position means changing those two levels and nothing else.

    Can I change the lot size of an open position?
    No. Size is fixed at execution and the Modify window will not touch it. You can close part of the position, which reduces size, or open a separate position, which is a new trade with its own risk. Confusing these with modification is how a stop gets widened when a smaller position was what was needed.

    Why does MT4 say invalid stops when I try to modify?
    Your broker enforces a minimum distance between the current price and any stop or target, and your level is inside it. It is a server side rule rather than a platform limitation, it varies by firm and instrument, and it can widen when the market is busy. Place the level further away or wait for the constraint to ease.

    Is it ever right to widen a stop?
    As a general policy for a retail account, no, and the arithmetic is why. Widening does not buy the trade more time for free. It multiplies your risk by the factor you widened by, because the lot size does not change with it. If a wider stop is genuinely correct for the setup, the position should have been smaller from the start.

    Does modifying a trade cost anything?
    There is no charge for the modification itself. The cost is entirely in what the new levels do to your risk, plus the ordinary costs of the position such as spread and any overnight financing, which continue regardless of where your stop sits.

    Where did the numbers in this article come from?
    The definition of modifying a position and the pending order types are from MetaQuotes’ own MetaTrader 4 documentation, linked above. Every percentage is my own arithmetic on assumptions stated in the text: a fixed lot size, an initial risk of one percent, and the stop actually being reached. They are not measurements of any market or of anyone’s results.

    Where Gold Empire fits

    Gold Empire is free to follow. Daily gold analysis with the reasoning attached, losing days included, and an optional Kit for people who want the survival side written down in one place. There is no promise of a return here, because nobody honest can make one.

    Knowing which buttons enlarge a loss is a survival topic rather than a technical one, which is why it sits under risk management in gold trading. If you are still setting the platform up, how to add gold to MetaTrader 4 comes before this one, and how much to risk per trade is where the one percent in the arithmetic above is decided in the first place.

    About the author

    Matthew has spent a long time around gold, most of it learning things the slow way, and now writes them down so other people can learn them the fast way. He is more interested in the mechanics that quietly drain accounts than in the setups that fill timelines. Nothing in this article is personal advice, and no entry, stop or target discussed should be treated as a signal.


    This article is educational content about a platform feature and about the arithmetic of position risk. It is not investment advice, not a recommendation of any broker, platform or account type, and not a solicitation to trade. Platform behaviour, minimum stop distances and order handling rules differ by broker, by instrument and by jurisdiction and change without notice, so verify the current terms with your own firm. The definition of modifying a position and the description of pending order types are taken from MetaQuotes’ published MetaTrader 4 help on trade positions and order types. Every percentage in this article is my own arithmetic on the stated assumptions, chosen to illustrate the method rather than to describe any real account. Trading gold carries a real risk of losing money, including more than you deposit in some account types. No gold price level is quoted anywhere here. Nothing accounts for your personal circumstances, and no entry, stop or target discussed should be treated as a signal. If you are unsure, speak to someone properly qualified in your own jurisdiction before you risk anything.


  • How to Add XAUUSD in MT5, and What You Just Added

    How to Add XAUUSD in MT5, and What You Just Added

    You have installed the platform, the account is funded, and gold is not in the list. So the first question is the practical one, how to add xauusd in mt5, and it has a short answer that takes about fifteen seconds.

    The second question is the one that actually matters, and almost nobody asks it. Having made the symbol appear, what exactly have you added? Because the answer is set by your broker rather than by any standard, and getting it wrong is one of the more expensive ways a new gold account ends.

    This article does both. The fifteen seconds first, then the screen you should read before you place a single order on it.

    How to Add XAUUSD in MT5, the Short Version

    MetaTrader 5 does not show every instrument your broker offers. It shows a working subset in the Market Watch window, and gold is frequently not in the default list.

    The route is documented in the platform’s own Market Watch help page. Open Market Watch, then open the symbol manager, which the documentation describes as the command to Open the window for managing symbols with the command Symbols of the context menu. That gives you the full list of what your broker actually offers rather than what is currently displayed.

    In that window, the documentation notes that you can use the filter at the top of the window. Type the first letters of the symbol name or description in it. Type gold, or type XAU. Then, as the help puts it, Double-click on a symbol name to toggle it into the Market Watch list, or use the Show button.

    Gold now appears in Market Watch and you can open a chart from it. That is the whole of the mechanical answer.

    One detail worth knowing while you are in there, from the same page: If there are open positions or pending orders for the financial instrument, or when its chart is open, the instrument cannot be hidden. If a symbol refuses to disappear later, that is why, and it is not a fault.

    Why Gold Was Missing, and Why It Might Be Called Something Else

    Three ordinary reasons cover almost every case.

    The first is simply that the default list is short. Brokers ship a small Market Watch so the window is usable, and the full catalogue sits behind the symbol manager. Nothing is wrong.

    The second is naming. There is no rule that gold must be called XAUUSD. Depending on the firm you may find GOLD, or XAUUSD with a suffix attached, and the suffix is the part to pay attention to. This is why searching the description rather than the exact ticker is the more reliable move.

    The third is the account type. A demo and a live account at the same firm can carry different instrument sets, and some symbols are restricted by jurisdiction or by account tier. If gold genuinely is not in the symbol manager at all, that is a question for the broker rather than a platform problem.

    A fourth possibility is not a problem at all. Outside trading hours the symbol exists but sits still, which people sometimes read as a broken feed. Gold trades nearly around the clock on weekdays and stops at the weekend, so a frozen quote on a Sunday is the market being shut.

    The Screen to Read Before You Trade It

    Here is where the survival part of this article begins.

    Once the symbol is in Market Watch, the same help page describes reading its trading conditions: click Specification in the context menu of the Market Watch window. That panel states the contract size, the execution mode, the margin requirement and the commission your broker has set for your account.

    Read it once, properly, because those values are not standard across the industry. They are settings. Two firms can offer something called XAUUSD where one full lot means different quantities of metal, and the platform will let you trade either of them with identical confidence.

    Contract size is the line that matters most, and the next section is entirely about why.

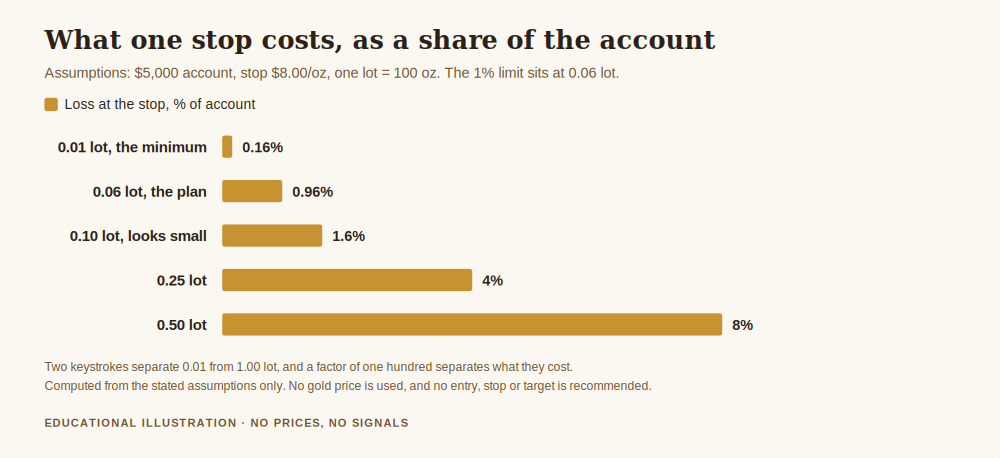
    Chart supporting how to add xauusd in mt5, showing the loss at the stop as a share of a 5,000 account at 0.01, 0.06, 0.10, 0.25 and 0.50 lot on a 100 ounce contract
    How to add xauusd in mt5 is the easy half. The contract size on the specification screen is what decides whether 0.10 lot is a small number or a large one.

    What the Contract Size Does to Your Risk

    Take the most common retail convention, where one full lot of gold is one hundred ounces. Every figure below is computed from that assumption, and none of them depends on the price of gold.

    At 0.01 lot you hold one ounce, so a move of one dollar an ounce is worth one dollar to your account. At 0.10 lot you hold ten ounces and the same move is worth ten dollars. At 1.00 lot you hold one hundred ounces and it is worth one hundred dollars.

    The distance between the smallest and largest of those is a factor of one hundred. The distance on screen between them is two keystrokes.

    That is the whole hazard, and it explains a category of account failure that looks mysterious from outside. Nobody intends to trade a hundred times their planned size. They copy a lot figure from a tutorial written for a broker whose contract size was different, or they assume the gold contract behaves like the currency pairs they practised on, and the position is wrong before the chart has been considered at all.

    Note that this has nothing to do with being right about direction. A correctly analysed trade in the correct direction at a hundred times the intended size is still a serious problem, because the loss you had planned for is now a loss you cannot absorb.

    Turning the Specification Into an Order Size

    Once you have read the contract size, sizing is arithmetic rather than judgement.

    Assume a five thousand account, a limit of one percent of it on any single trade, so fifty, and a stop eight dollars an ounce away from entry. On a one hundred ounce lot convention, one full lot would lose eight hundred at that stop. Fifty divided by eight hundred gives 0.0625 lots.

    Round that down, never up, so 0.06 lot. Rounding down leaves you slightly inside your limit. Rounding up puts you outside it, and the habit of rounding up is how a one percent rule quietly becomes something else.

    Compare that with clicking 0.10 because it looks like a small, round, harmless number. At 0.10 lot the same stop costs eighty, which is 1.6 percent of the account, or 1.6 times the risk you decided on. That is not a catastrophe on one trade. Repeated across a losing run it is the difference between a drawdown you recover from and one you do not.

    Higher leverage does not change any of this. Leverage sets the margin your broker holds, not the money you lose at your stop. The two get confused constantly, and the confusion is expensive. For context on where the limits come from, the ESMA product intervention measures of 27 March 2018 capped retail leverage on gold at 20:1 in that regime and required negative balance protection.

    The Suffix Trap

    One specific version of this is worth naming, because it catches people who have done everything else right.

    Where a broker lists several variants of gold, the variants can differ in contract size, in execution mode, in commission and in minimum size. They are different products wearing nearly the same name.

    The failure is undramatic. You read the specification carefully on one variant, size correctly from it, then some weeks later add a chart from a different variant and size it from what you learned the first time. The arithmetic was right. It was applied to the wrong contract.

    The defence is to check the specification of the exact symbol on the exact chart you are about to trade, and to keep only the variant you actually use in Market Watch. Hiding the rest is the same double-click that showed them.

    Free gold survival sheet

    Get the free Gold Empire survival sheet, a one-page guide to sizing a gold position from the contract specification rather than from a number you copied, including the arithmetic used on this page. One email, no spam, unsubscribe anytime.

    Get the free survival sheet →

    Frequently Asked Questions

    How to add xauusd in mt5 in one sentence?
    Open Market Watch, open the Symbols window from the context menu, filter for gold or XAU, then double-click the symbol to show it in the list.

    I cannot find XAUUSD anywhere in the symbol list.
    Search for the description rather than the ticker, because your broker may list gold under a different name. If nothing appears at all, the instrument may not be offered on your account type or in your jurisdiction, and that is a question for the broker.

    Why does the price never move after I add it?
    Most often the market is closed, which on gold means the weekend. If quotes stay frozen during normal weekday hours, check the connection status and then the symbol’s trading sessions in its specification.

    Does MT5 work the same way as MT4 for this?
    The idea is the same, a symbol list you can add to, but the windows and menus differ, so instructions written for the older platform will not match exactly. The specification habit described here matters equally on both.

    Is 0.01 lot always one ounce of gold?
    No, and this is exactly the assumption to avoid. One ounce at 0.01 lot follows from a one hundred ounce contract, which is common but is a broker setting rather than a rule. Read the contract size on the specification screen for the symbol you are about to trade.

    Where did the numbers in this article come from?
    The platform instructions are quoted from the MetaTrader 5 Market Watch help page linked above, and the leverage cap and negative balance protection from the ESMA measures also linked above, both checked live before publication. Every other figure is computed from the stated assumptions, a one hundred ounce lot convention, a five thousand account, a one percent risk limit and an eight dollar an ounce stop. None of them depends on the price of gold.

    Gold Empire is free to follow. Daily XAUUSD analysis with the reasoning stated before the trade rather than after it, on Telegram, and a free survival sheet for anyone who wants the capital protection material in one place. There is an optional Kit for people who want the whole method. No profit promises, and nothing here is a signal service.

    If you want the rest of this thread: risk management in gold trading is the pillar this article sits under, how to add gold to MetaTrader 4 covers the same job on the older platform, and how to calculate lot size for gold turns the contract size into an order you can actually place. More about who writes this is on the author page.

    About the author. Matthew writes Gold Empire. He spends most of his time on the unglamorous half of this business, the part concerned with still being here next year, and he has never met an account that was lost because the platform was hard to configure, only ones lost because nobody read what they had configured. Nothing in this article is a recommendation to trade, and no entry, stop or target discussed should be treated as a signal.

    Disclaimer: This article is general educational content about platform configuration, contract specifications and position sizing in retail gold trading. It is not financial advice, not investment advice and not a recommendation to buy, sell or use any product, venue or firm. Platform behaviour and instrument settings vary by broker and may change, and regulatory wording is quoted from the source linked in the text. Trading leveraged products carries a substantial risk of loss and most retail accounts lose money. All figures are illustrative calculations from the stated assumptions, not predictions, and not claims about any past or future performance.


  • How to Get Gold Price Alert Without Living on the Chart

    How to Get Gold Price Alert Without Living on the Chart

    Here is a question that arrives in my inbox in a dozen different phrasings, always from someone who has been staring at a screen too long: how to get gold price alert notifications that actually reach you, so you can stop sitting there refreshing a chart. It sounds like a technical question about which button to press. It is not. It is a question about how much of your life this is going to take, and whether the answer to that is going to be decided by you or by the market.

    I want to answer the button part properly, because it deserves a proper answer. But I want to do the arithmetic first, because the arithmetic is what tells you how many alerts to set and where, and almost nobody does it.

    What a price alert actually is, and what it is not

    An alert is a message. That is the whole of it. When a condition you specified becomes true, something tells you. Nothing is bought, nothing is sold, nothing changes in your account.

    That sounds obvious written down, and yet the confusion between an alert and an order is the single most expensive misunderstanding in this whole topic. An order is an instruction sitting at your broker that will execute whether you are awake or not. An alert is a tap on the shoulder that does nothing at all unless you are there to receive it and act.

    Which means an alert cannot protect a position. Only an order can do that. If you find yourself thinking of an alert as a sort of soft stop loss, a way to keep an eye on things without committing to an exit, stop and reread that sentence, because it is the shape of a very common way to lose money slowly.

    What an alert is genuinely good for is the opposite job. It buys you permission to be absent. It lets you close the platform, do your actual work, sleep properly, and still be told when the one thing you were waiting for happens. That is a survival tool, not an analysis tool, and it is why I care about it.

    How to get gold price alert coverage for the hours you cannot watch

    Let me show you why this matters more than it sounds, with numbers I worked out myself and assumptions you can check.

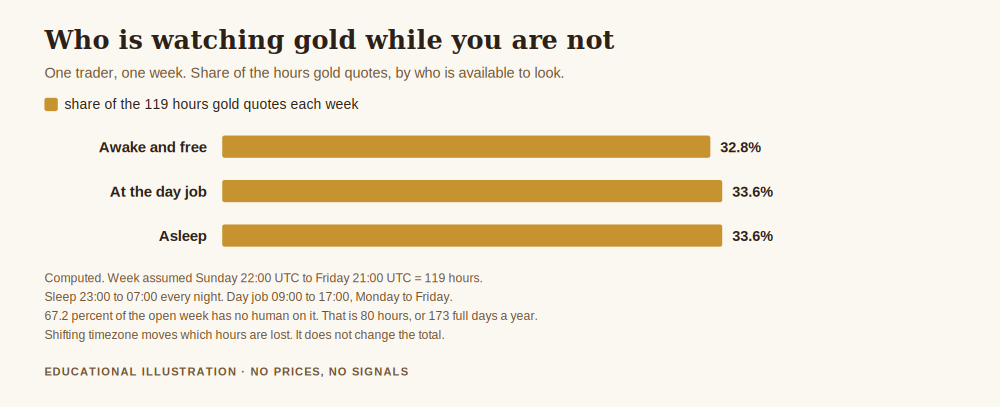
    Spot gold quotes from roughly Sunday evening to Friday evening. Taking a common broker window of Sunday 22:00 UTC to Friday 21:00 UTC, that is 119 hours of quoting in a 168 hour week. Now put a human being into it. Assume they sleep from 23:00 to 07:00 every night, and hold down a job from 09:00 to 17:00, Monday to Friday.

    Count the hours where the market is open and that person is both awake and not at work. The answer is 39. That is 32.8 percent of the time gold is quoting.

    Which means 67.2 percent of the open week has nobody on it. Eighty hours a week. Across a year, that is 4,160 hours of live gold market that you were never going to see, the equivalent of 173 complete days.

    Chart for how to get gold price alert, showing that only 32.8 percent of the 119 hours gold quotes each week is watchable by one person, with 33.6 percent lost to the day job and 33.6 percent to sleep
    Working out how to get gold price alert coverage starts here: two thirds of the trading week has no human on it.

    Split the loss and it is almost perfectly even. The day job takes 40 of those open hours, 33.6 percent. Sleep takes another 40, another 33.6 percent. Neither is optional, and I am not going to pretend otherwise. Shifting your timezone changes which hours you lose. It does not change the total by a single hour.

    So the honest framing is not “how do I watch more.” You cannot watch more, not sustainably, and the people who try are the ones I meet later with a story about a bad month. The framing is: given that two thirds of this is happening without me, what do I want to be told about, and what am I happy to miss?

    Where you can actually set one

    There are four places, and they are not interchangeable.

    In the trading platform itself. MetaTrader has a built in alerts tab, and it also exposes alerts to code. The MetaQuotes reference for the Alert function describes it plainly as displaying a message in a separate window, and notes one limitation worth knowing before you rely on it: it does not work in the strategy tester. The catch with all platform alerts is that the platform has to be running. Close the terminal and the alert dies with it.

    Push to your phone. This is the one that matters, because it survives the terminal being closed on that machine. MetaTrader supports it through SendNotification, and the documented pattern is instructive: the code is supposed to check whether the terminal actually has permission to send notifications before it tries, because if that permission was never granted the message goes nowhere silently. That failure mode is worth internalising. An alert you believe is armed and is not is worse than no alert at all, because you have stopped watching on the strength of it.

    Your broker’s own app. Most now have price alerts built in, running on their servers rather than your machine, which makes them the most robust of the lot. Whether they are reliable is a question about your broker rather than about alerts, and if you are still choosing one, the broker comparison is where I would start.

    A charting site. TradingView and similar tools have well built alert systems that run in their cloud. If you already live in a chart package, this is often the least friction. If you are weighing the platforms up, TradingView versus MetaTrader covers the wider trade off.

    Whichever you pick, test it once, deliberately, by setting an alert you know will fire in the next few minutes. Then go and confirm the message actually arrived on the device you will be holding. Do not skip this. Untested alerts are the most common quiet failure in this entire subject, and you discover the problem at the exact moment you needed it to work.

    The most valuable alert is not a price alert at all

    Now the part I actually wanted to write.

    A lot of what moves gold hardest is not a surprise. It is scheduled, published months ahead, and available free. The Federal Reserve says so on its own FOMC calendar page: the committee holds eight regularly scheduled meetings during the year, plus others as needed, and the minutes of those regularly scheduled meetings are released three weeks after the date of the policy decision.

    Read that as an operator rather than a reader. Eight meetings, each with a minutes release three weeks later, is sixteen dated events every year that you can know about today. My arithmetic on a 252 day trading year puts that at one every 15.8 trading days, or roughly every 22.8 calendar days.

    Sixteen entries in a calendar. That is the entire setup cost. No price level, no platform, no code, nothing that can silently fail because a permission was not granted. And it tells you something a price alert structurally cannot: not that something has already happened, but that something is about to.

    The difference between those two is the difference between reacting and preparing. A price alert always arrives after the move started. A calendar entry arrives before it. If you want the fuller picture of what the meeting itself does to gold, what the FOMC is and why gold reacts is the companion piece, and nonfarm payrolls covers the other big scheduled one.

    How many alerts is too many

    Here is where most people go wrong once they discover alerts work. They set forty of them.

    The relevant number is not how many alerts you have. It is what fraction of them lead to you doing anything. Assume a patient process that takes two trades a week, which is not an unusual pace for someone trading gold around a job. My arithmetic on that assumption:

    • 5 alerts a week: 40 percent lead to a trade, 3 interruptions bought nothing, 156 a year.
    • 10 alerts a week: 20 percent lead to a trade, 8 wasted, 416 a year.
    • 20 alerts a week: 10 percent lead to a trade, 18 wasted, 936 a year.
    • 40 alerts a week: 5 percent lead to a trade, 38 wasted, 1,976 a year.
    • 80 alerts a week: 2.5 percent lead to a trade, 78 wasted, 4,056 a year.

    Put a time cost on it. Say each alert costs five minutes to open the platform, look, decide nothing is there, and put the phone down. At 10 alerts a week that is 34.7 hours a year spent on alerts that led nowhere. At 40 a week it is 164.7 hours. At 80 a week it is 338 hours, which is more than eight full working weeks, spent looking at a chart to conclude nothing.

    The spacing you choose controls this directly, and the arithmetic is simple ratio work with no price in it at all. If your levels sit 0.25 percent apart and a day travels a 1.0 percent range, the day touches about four of them. Tighten the spacing to 0.10 percent and that same day touches ten. Widen it to 0.50 percent and it touches two. You are not measuring the market when you set spacing. You are choosing how often it is allowed to interrupt you.

    The alert that quietly hurts you

    One warning, and it is the reason I framed this article around absence rather than coverage.

    Alerts can become a mechanism for being at the chart more, not less. It happens gradually. You set a few, they fire, you look. You set more so you do not miss anything. Now your phone buzzes eleven times a day and each buzz is an invitation to open the platform and have an opinion. You have not automated your attention. You have outsourced the decision about when to pay attention to a set of price levels you chose last Tuesday.

    The test I would apply is simple. Does this alert correspond to something in my plan that I would act on? If yes, keep it. If it is there because I am curious, delete it, because curiosity that costs you a look at the chart on a day you had decided not to trade is not free. I have written about the version of this that ends badly in how to stop overtrading and revenge trading, and the path there usually starts somewhere this innocent.

    The good version looks like this. A handful of alerts, spaced widely enough that they fire rarely, on levels that matter to a plan you wrote down when the market was closed. A calendar with sixteen Fed dates in it. And a stop order resting at the broker doing the actual protecting, because that is the thing that works while you are asleep for those 40 hours a week. Position sizing that lets you sleep is the foundation under all of it, and risk management in gold trading is the piece I would read next.

    Free gold survival sheet

    Get the free Gold Empire survival sheet, a one-page guide to protecting your account through the kind of market this article describes. One email, no spam, unsubscribe anytime.

    Get the free survival sheet →

    Frequently asked questions

    How to get gold price alert notifications on my phone?

    Use a channel that does not depend on your desktop staying open. In MetaTrader that means push notifications rather than the terminal alert window, and the documentation makes clear the terminal must have been granted permission to send them or the message goes nowhere. Broker apps and charting sites run their alerts on their own servers, which is more robust again. Whichever you use, fire one test alert and confirm it arrives on the device you actually carry.

    Will a price alert close my trade for me?

    No. An alert is a message and nothing else. Only an order resting at your broker can act on your position while you are away. Treating an alert as a substitute for a stop order is the most expensive mistake in this topic, and it is a common one.

    How many alerts should I set?

    Fewer than feels natural. On the assumption of two trades a week, ten alerts a week means eight of them bought you nothing, which works out at about 35 hours a year of looking at charts to conclude there was nothing to do. Forty a week costs 165 hours. The right number is the number that matches the plan you wrote down, not the number of levels you find interesting.

    Is a free alert good enough?

    For this purpose, generally yes. Nothing in the arithmetic above improves because you paid for the alert. The reliability question is whether the alert runs somewhere that stays on when your computer does not, and plenty of free options do.

    What about a calendar instead of a price alert?

    That is the recommendation, alongside rather than instead. Sixteen dated Fed events a year are published in advance and cost nothing to record, and unlike a price alert they warn you before a move rather than after it starts.

    Where did the figures in this article come from?

    The eight regularly scheduled meetings and the three week minutes lag are quoted from the Federal Reserve’s own FOMC calendar page, linked above, and the two platform notes are from the MetaQuotes references also linked above. Every other figure is my own arithmetic, computed in Python from the assumptions stated in the text: a quoting week of Sunday 22:00 UTC to Friday 21:00 UTC, sleep from 23:00 to 07:00, work from 09:00 to 17:00 Monday to Friday, two trades a week, five minutes per interruption, and a 252 day trading year. No gold price appears anywhere in this article, and none is needed, because every figure is a count, a share or a ratio.

    Where Gold Empire fits

    Gold Empire is a free place to learn how gold actually behaves and how accounts actually die, written for people who would rather survive the first two years than have a spectacular first month. Everything on the site is free to read. If you are new here, start here is the guided way in, and it explains who writes this and why. There is a free survival sheet if you want the one page version, and an optional kit for people who want the whole framework in order. Nothing here promises you a return, because nobody honest can.

    About the author

    Matthew has spent a long time around gold, most of it learning things the slow way, and now writes them down so other people can learn them the fast way. He is more interested in the mechanics that quietly drain accounts than in the setups that fill timelines. Nothing in this article is personal advice, and no entry, stop or target discussed should be treated as a signal.


    This article is educational content about how price alerts and notifications work, and about the arithmetic of attention. It is not investment advice, not a recommendation of any platform, broker or product, and not a solicitation to trade. Trading gold carries a real risk of losing money, including more than you deposit in some account types. The FOMC meeting count and the minutes release lag are quoted from the Federal Reserve, and the two platform behaviours from the MetaQuotes documentation, both linked in the text. Every other number is my own arithmetic on the assumptions stated in the article and is not a measurement of any market or of anyone’s results. No gold price level is quoted anywhere here. Nothing accounts for your personal circumstances, and no entry, stop or target discussed should be treated as a signal. If you are unsure, speak to someone properly qualified in your own jurisdiction before you risk anything.


  • TradingView vs MetaTrader: What You Are Actually Paying For

    TradingView vs MetaTrader: What You Are Actually Paying For

    Every few weeks somebody in the Gold Empire group asks about tradingview vs metatrader, and they always ask it the same way: which one is better. I understand why the question comes out like that, because that is how the comparison articles are written. But it is the wrong question, and answering it as asked is how people end up paying a few hundred dollars a year for something that was never going to fix what was actually wrong with their trading.

    So let me answer a different question, one that has a real answer. What does each of these two things actually do, what does each one cost, and which of the two is even capable of affecting your results. That last part is where most of the comparison articles quietly stop, and it is the only part that decides anything.

    Chart for tradingview vs metatrader showing the annual chart subscription cost as a percentage of different account sizes
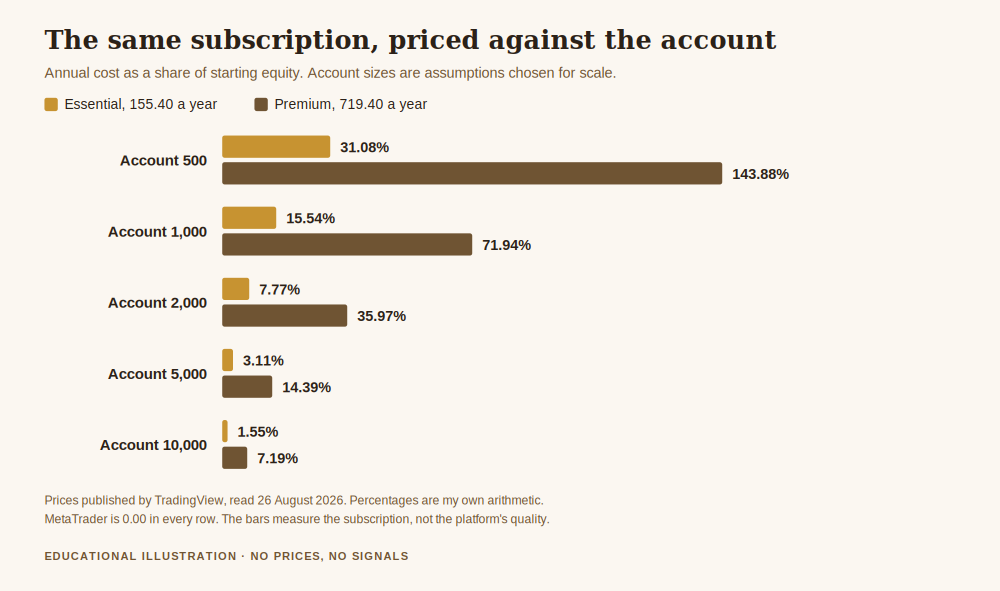
    The tradingview vs metatrader question priced properly: the same subscription is an ordinary business cost on one account and most of a year’s work on another.

    What each one actually is, stated plainly

    These two products are not the same kind of thing, which is the root of most of the confusion. Comparing them directly is a little like comparing a set of binoculars to a fishing licence.

    TradingView is a charting service you rent

    TradingView is a website and an app that draws charts, holds your watchlists, runs your alerts and lets you publish and read other people’s scripts. You reach it in a browser. There is a free tier and there are paid tiers, and the paid tiers are a subscription that renews.

    The published prices, which I read off TradingView’s own pricing page on the day I wrote this, run in five steps. Free at nothing. Essential at 12.95 a month billed annually. Plus at 29.95. Premium at 59.95. Ultimate at 199.95. What climbs with the price is the allowance: charts per tab goes 1, 2, 4, 8, 16, indicators per chart goes 2, 5, 10, 25, 50, and the alert counts climb alongside them. Those are their figures on their page, not an audit by me, and vendors change prices whenever they like.

    MetaTrader is a terminal your broker hands you

    MetaTrader 4 and MetaTrader 5 are desktop programs made by MetaQuotes. You can download MetaTrader 5 from MetaQuotes at no charge, and the same is true of MetaTrader 4. There is no subscription tier and no upgrade path, because the software is not the product being sold to you. Your broker is the one paying to run the server it connects to, and your broker is who you actually have a relationship with. If you have not opened an account yet, the mechanics of that are in how to open a gold trading account.

    TradingView vs MetaTrader: the part neither marketing page leads with

    Here is the thing that reframes the whole tradingview vs metatrader argument, and once you have seen it you cannot unsee it.

    Neither of these programs decides what happens to your money. Your broker does.

    Look at what a MetaTrader terminal actually knows about the instrument you are trading. In the MetaQuotes documentation there is a list of symbol properties the terminal reads, and among them sit four separate volume limits: the smallest ticket you may send, the largest single ticket, the step between allowed sizes, and the maximum total across every order you have working in one direction. The terminal does not set a single one of those. It reads them from the server and displays them. The same is true of your spread, your commission, your swap, your leverage, your margin requirement and whether your stop was honoured at the price you asked for.

    So when someone says a platform gave them a bad fill, the platform did not. The broker did, and the platform reported it faithfully. Changing the window you look through does not change the weather. That is the whole reason choosing a broker for gold trading deserves ten times the attention people give it, and choosing chart software deserves an afternoon at most.

    What the subscription costs, written out

    Monthly prices are designed to feel small, so let me do the multiplication that the pricing page does not do for you. These are my own sums on their published annual rates, assuming the rate simply repeats, which is an assumption and not a forecast.

    • Essential: 155.40 a year, 777.00 over five years.
    • Plus: 359.40 a year, 1,797.00 over five years.
    • Premium: 719.40 a year, 3,597.00 over five years.
    • Ultimate: 2,399.40 a year, 11,997.00 over five years.

    MetaTrader is 0.00 in every one of those columns. Over five years the gap between the free tier and Premium is 3,597.00, and between the free tier and Ultimate it is 11,997.00. Whether those are large numbers depends entirely on something the pricing page cannot know, which brings us to the number that actually matters.

    The hurdle nobody puts on the pricing page

    A fixed annual cost is a hurdle. Before your account has made a single unit of profit, it has to earn back the subscription just to stand still. Divide the annual cost by the account and you get that hurdle as a percentage. The account sizes below are assumptions I chose to show the shape, not recommendations about what anyone should fund.

    • On a 500 account: Essential is a 31.08% hurdle, Premium is 143.88%.
    • On a 1,000 account: Essential is 15.54%, Premium is 71.94%.
    • On a 2,000 account: Essential is 7.77%, Premium is 35.97%.
    • On a 5,000 account: Essential is 3.11%, Premium is 14.39%.
    • On a 10,000 account: Essential is 1.55%, Premium is 7.19%.
    • On a 25,000 account: Essential is 0.62%, Premium is 2.88%.

    Read the Premium row twice. On a 1,000 account it asks for 71.94% of the account back before anything else happens. On a 25,000 account the identical product asks for 2.88%, which is a completely ordinary software line item for a small business. The tool did not change between those two rows. The account did.

    Turn it around and each tier quietly names the account it was priced for. If you decide a tool should cost at most 2% of equity a year, which is a threshold I picked rather than a rule handed down from anywhere, then Essential fits an account of about 7,770, Plus about 17,970, Premium about 35,970, and Ultimate about 119,970. Nobody at TradingView is hiding this. It simply is not their question. It is yours.

    Reading the indicator allowance backwards

    The upgrade ladder is sold mostly in indicator slots, so it is worth pricing them. Going from Essential to Plus buys 5 more indicators per chart for 204.00 a year, which is 40.80 per slot per year. Plus to Premium buys 15 more for 360.00, which is 24.00 a slot. Premium to Ultimate buys 25 more for 1,680.00, which is 67.20 a slot.

    The arithmetic is fine. The premise is what deserves a second look. An upgrade sold in indicator slots only pays for itself if the missing indicators were the reason for the losses, and on an account that is bleeding they essentially never are. I have never once reviewed a blown account and found that the problem was a fifth indicator the person could not afford. The problem was size, or it was a stop that was moved, or it was a trade taken out of boredom. None of those have a price on any pricing page. The same money spent on nothing at all, left sitting in the account, is a bigger and more honest upgrade. If you want the ranked version of what actually moves the needle, it is in risk management in gold trading and then how much to risk per trade.

    So which one, then

    Here is the honest answer, and it is duller than the comparison articles.

    Use whatever your broker gives you, which is usually MetaTrader, and use TradingView’s free tier alongside it if you like the charts better, which many people do. Pay for a tier only when a specific limit is genuinely blocking work you are already doing well, and when the annual cost is a small share of your account rather than a meaningful share. If you cannot name the limit that is blocking you, the upgrade is not the thing you are buying, and the honest name for what you are buying is hope.

    One more practical note, since it comes up every time. Charting in one place and executing in another means your chart and your fills come from two different data feeds, and they will not agree to the tick. That is normal and it is not a fault in either product, but it does mean your journal should record the broker’s numbers, not the chart’s. If you want your MetaTrader charts set up sensibly in the first place, we walked through it in how to add gold to MetaTrader 4, and the TradingView equivalent is in the best chart settings for TradingView.

    Free gold survival sheet

    Get the free Gold Empire survival sheet, a one-page guide to spending your money on the things that actually keep an account alive, starting with the ones that cost nothing. One email, no spam, unsubscribe anytime.

    Get the free survival sheet →

    Frequently asked questions

    In tradingview vs metatrader, can I trade directly from TradingView?

    With some brokers, yes, through a connection you set up between the two. Whether it is available to you depends on your broker, not on your subscription tier, so check with them rather than with the pricing page. Note that this does not change who executes the order or on what terms. It changes which screen you clicked.

    Is the free TradingView tier good enough?

    For most people reading this, yes. It gives you one chart per tab and two indicators per chart, and if two indicators is genuinely the constraint on your trading then you are in a much better position than the average person who asks me this. Start there and let a real limitation, not a feeling, be what moves you up.

    Does MetaTrader cost anything at all?

    Not from MetaQuotes. The terminals are offered for download at no charge, and your broker supplies the account. What you pay in that arrangement is the spread, the commission and the swap on your trades, which is a real cost and is worth measuring from your own statement. It just is not a software cost.

    Will better charts improve my results?

    Better charts make you more comfortable, and comfort is worth something. But the things that decide whether an account survives are position size, the risk you take per trade, and whether you follow your own rules on a bad day. None of those live in the charting software. That is not a slogan, it is what the arithmetic above keeps pointing at.

    Why do the two platforms show slightly different prices?

    Because they are quoting different feeds, and on an over the counter market like spot gold there is no single official price that everyone must quote. Small differences are expected. If the differences are not small, that is a question for your broker and it belongs in the same conversation as how you evaluate a broker in the first place.

    What Gold Empire actually does

    Gold Empire is a free education channel for people trading gold, and the order in the name is deliberate: survive first, then grow. We publish the mechanics of this market, the ways accounts get destroyed, and the habits that keep people around long enough to get good at it. The free gold survival sheet is the one page version of that, and it costs nothing.

    Everything here is free to read. There is an optional kit for people who want the material organised into a working system, and following along without ever buying it is a completely normal way to use this channel. We share our own results openly, and signals are part of what the channel offers, but we do not promise profits, because no honest channel can. If you want the next steps in order, start with risk management in gold trading, then how much to risk per trade.

    About the author

    Matthew writes the Gold Empire material. He spent his first two years upgrading things, the charts, the screens, the indicator packages, while the one number that was actually destroying the account went unexamined the entire time, and most of what he publishes now is the article he wishes somebody had handed him then. He reads every message in the group and answers the ones about risk first. You can read more about the Gold Empire approach here.


    This article is educational content, not financial advice. The prices quoted are the vendors’ own published figures read on 26 August 2026 and can change without notice, and every percentage in it is my own arithmetic on stated assumptions about account sizes and cost thresholds, not a quote, a recommendation or a claim about anyone’s results. Gold Empire has no commercial relationship with TradingView or MetaQuotes. This article does not account for your personal circumstances, your tax position or your risk tolerance, and nothing in it is a recommendation to buy or sell any instrument or to open an account anywhere. Trading leveraged products carries a high risk of losing money rapidly, and no entry, stop or target discussed should be treated as a signal. Consider speaking to a licensed professional in your jurisdiction before making decisions about your money.


  • Raw Spread Account vs Standard Account: Which One Actually Costs Less?

    Raw Spread Account vs Standard Account: Which One Actually Costs Less?

    Somebody in the Gold Empire group asked this last week, and the way they asked it is the reason I am writing a whole article about it. The question was raw spread account vs standard account, which one is better, and they had already read four forum threads that all disagreed. That is not surprising, because almost every answer you find online is an opinion about which one feels more professional. It is not a matter of opinion. It is a subtraction, and you can do it on the back of a receipt in about thirty seconds once somebody shows you which two numbers to subtract.

    So that is what this is. No brand names, no affiliate links, no recommendation about where to open an account. Just the arithmetic that decides it, the point where one becomes cheaper than the other, and the much more important thing that this argument usually distracts people from.

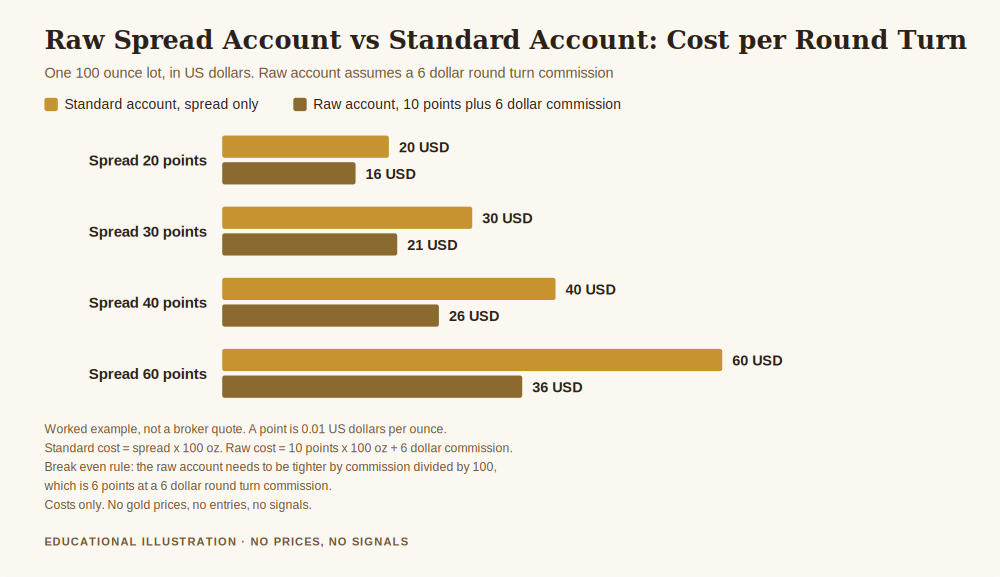
    Chart comparing a raw spread account vs standard account, showing the round turn cost in dollars per lot at different spread levels
    Raw spread account vs standard account, the same trade priced two ways: the commission has to be smaller than the spread you save.

    What the two account types actually are

    A standard account charges you nothing that looks like a fee. The broker’s cost is built into the spread, the gap between the price you can buy at and the price you can sell at. You pay it silently, on every entry and every exit, and it never shows up on your statement as a line item.

    A raw spread account, sometimes called raw, ECN or zero, does the opposite. It shows you a much tighter spread and charges an explicit commission per lot instead. The cost is visible. Many people read that visibility as honesty and stop thinking there, which is exactly the mistake.

    Neither structure is generous and neither is a trick. They are two ways of billing you for the same service. The only question that matters is which one bills you less for the trading you actually do, and that question has a numerical answer.

    The one calculation that settles raw spread account vs standard account

    Take the standard retail gold contract, where one lot is 100 troy ounces. Check your own contract specification rather than trusting me on that, because it is the assumption everything below rests on and platforms do vary.

    On the standard account, your round turn cost is the spread multiplied by 100 ounces. On the raw account, it is the tighter spread multiplied by 100 ounces, plus the commission. Set those equal and the commission cancels into something very simple:

    The spread saving you need, per ounce, equals the round turn commission divided by 100.

    That is the whole thing. If a broker charges 6 dollars per lot round turn, the raw account has to be at least 6 cents per ounce tighter than the standard account before you are one cent better off. In platform terms, where a point on gold is a hundredth of a dollar per ounce, that is 6 points. A 3 dollar commission needs 3 points of saving, a 10 dollar commission needs 10 points, a 12 dollar commission needs 12.

    Notice what is absent from that formula. Your account size is not in it. Your win rate is not in it. Your timeframe, your strategy and your broker’s marketing are not in it. The break even point between the two account types depends on two numbers only, and both of them are published before you deposit a penny.

    Putting real spreads through it

    Here is the same subtraction across a grid, with a 6 dollar round turn commission assumed. Each cell is the raw account’s cost minus the standard account’s cost, in dollars per lot. A negative number means the raw account is cheaper.

    Standard spread Raw 5 pts Raw 10 pts Raw 15 pts Raw 20 pts Raw 30 pts
    20 points -9.00 -4.00 +1.00 +6.00 +16.00
    30 points -19.00 -14.00 -9.00 -4.00 +6.00
    40 points -29.00 -24.00 -19.00 -14.00 -4.00
    60 points -49.00 -44.00 -39.00 -29.00 -24.00

    The break even line runs diagonally through that table, exactly where the raw spread sits 6 points below the standard spread. Below and left of it the raw account wins, above and right of it the standard account wins. There is no cell where one structure is universally better, which is why the forum arguments never resolve. Both sides are describing a real cell of the same table.

    Why the honest answer is often that it barely matters

    Now the part the comparison articles leave out. Suppose the two accounts are exactly 6 points apart, so on paper they are identical. How much money is actually in dispute over a year?

    Round turns per year At 0.01 lots At 0.10 lots At 1.00 lot
    50 3 30 300
    250 15 150 1,500
    1,000 60 600 6,000

    Those are dollars, and the assumption is stated in the header: 6 points of difference, that is all this table prices. If you trade 0.01 lots fifty times a year, the entire raw spread account vs standard account debate is worth 3 dollars to you. You could spend a fortnight researching it and lose more in opportunity cost than you could possibly win. If you trade a full lot a thousand times a year, it is worth 6,000 dollars and deserves a spreadsheet.

    The size of the decision scales with your volume, not with how strongly people argue about it online. Most retail traders are in the top left of that table and behave as though they are in the bottom right.

    The number that should worry you instead

    Here is where I want to change the subject slightly, because this is the part that keeps accounts alive. Stop comparing your costs to each other and start comparing them to your risk per trade.

    Say you risk one percent of your account on a position. Call that amount 1R, the unit that everything in risk management for gold trading is measured in. Now express the round turn cost as a percentage of that 1R:

    Account equity 6 dollar cost 12 dollar cost 30 dollar cost
    1,000 60.0% of 1R 120.0% 300.0%
    5,000 12.0% of 1R 24.0% 60.0%
    10,000 6.0% of 1R 12.0% 30.0%
    25,000 2.4% of 1R 4.8% 12.0%

    Read the top row again. A thousand dollar account risking one percent puts 10 dollars at risk per trade. If the round turn cost is 6 dollars, every single position starts 60 percent of the way into its own stop before the market has done anything at all. At a 30 dollar cost, which is what a full lot on a wide spread looks like, the cost is three times the entire risk budget of the trade.

    When that is your situation, the account type is not your problem. Your position size is enormous relative to your account, and no fee structure on earth fixes that. The arithmetic for getting it right is in how to calculate lot size for gold and forex and in how much to risk per trade, and it will do far more for your survival than any broker comparison.

    What it looks like over a year

    Run 250 round turns through the same assumption and the drag becomes visible. At a 6 dollar cost, a 1,000 dollar account pays 150 percent of its own equity in trading costs over a year, a 5,000 dollar account pays 30 percent, and a 25,000 dollar account pays 6 percent. Same fee, same trades, wildly different outcome, and the only variable that changed was how much capital was standing behind each ticket.

    That is the real cost lesson, and it has nothing to do with which account type you picked.

    Some context on how big these numbers are

    It helps to know what the market itself does in a day. Using the LBMA gold price benchmark, I pulled every afternoon fixing from 4 January 2016 to 24 August 2026, which is 2,669 sessions and 2,668 consecutive price steps, about 251 fixings per year. The median absolute move from one fixing to the next is 0.4998 percent, call it 50 basis points.

    Against a day that typically moves 50 basis points, a few points of spread difference is small. That is genuinely true, and it is the argument standard account defenders make. What it misses is that you do not pay the cost once per day, you pay it once per round turn, and the tables above are what happens when you multiply a small number by a large frequency.

    Costs do not kill accounts on their own. They kill accounts in combination with trading too often at too large a size, which is the same combination behind most of the failures documented by regulators. The European Securities and Markets Authority, when it introduced its retail intervention measures, cited evidence that between 74 and 89 percent of retail accounts typically lose money, and capped retail leverage on gold at 20 to 1. Not because spreads were the villain, but because size and frequency were.

    How to answer this for yourself in ten minutes

    Forget reviews. Do this instead.

    Open both account types with the same broker on demo, at the same hour of the day, and write down the live spread on gold in each, several times across a normal session and once around a scheduled news release. You are looking for the average gap between them, in points. Then look up the round turn commission and divide it by 100. If the gap is bigger than that number, the raw account is cheaper for you. If it is not, it is not.

    Two cautions from watching people do this badly. First, compare like with like, because a spread quoted at three in the morning on a quiet Tuesday is not the spread you will trade. Second, remember that spreads widen, and they widen on both account types, usually at the exact moment you most want to act, which is one of the reasons trading gold through high impact news is its own separate problem.

    If you are still at the stage of choosing where to trade at all, cost structure is somewhere around fifth on the list of things that matter. Regulation, withdrawal reliability, execution quality and how the firm behaves in a bad week all come first. We went through that ordering in how to choose a broker for gold trading, and the underlying mechanics of what you are paying for are in what the spread in gold trading really costs you.

    Free gold survival sheet

    Get the free Gold Empire survival sheet, a one-page guide to protecting your account from the costs and habits that quietly drain it. One email, no spam, unsubscribe anytime.

    Get the free survival sheet →

    Frequently asked questions

    In raw spread account vs standard account, which is cheaper for a beginner?

    Usually neither, by enough to matter. Beginners trade small and infrequently, which is the top left corner of the cost table above, where the annual difference is a few dollars. The account type becomes a real decision once your yearly volume is high enough that a few points per round turn compounds into a number you would notice.

    Is a commission always worse than a wider spread?

    No, and that is the point of the divide by 100 rule. A commission is only worse if it exceeds the spread you save. A visible fee is not inherently more expensive than an invisible one, it is just easier to see, and being easier to see is a feature rather than a warning.

    Do raw spread accounts have better execution?

    That is a separate question and it is not answered by the pricing model. Execution quality is about how your orders are filled, especially in fast conditions, and you can only judge it by trading the account and watching what happens to your fills. Do not let a tight advertised spread stand in for evidence about execution.

    What about swap charges, do they change the comparison?

    They do if you hold positions overnight, and they are charged separately from both structures. If you carry trades for days, the swap can easily be larger than the whole spread and commission argument. We covered how that works in what swap in gold trading means.

    My broker offers both. Can I just switch later?

    Generally yes, and that is a good reason not to agonise over it now. Trade on whichever you are on, record your actual costs for a month from your own statement, then make the decision with your own data instead of somebody else’s forum post.

    What Gold Empire actually does

    Gold Empire is a free education channel for people trading gold, and the order in the name is deliberate: survive first, then grow. We publish the mechanics of this market, the ways accounts get destroyed, and the habits that keep people around long enough to get good at it. The free gold survival sheet is the one page version of that, and it costs nothing.

    Everything here is free to read. There is an optional kit for people who want the material organised into a working system, and following along without ever buying it is a completely normal way to use this channel. We share our own results openly, and signals are part of what the channel offers, but we do not promise profits, because no honest channel can. If you want the next steps in order, start with risk management in gold trading, then how much to risk per trade.

    About the author

    Matthew writes the Gold Empire material. He spent his first years in this market paying costs he had never calculated, on positions that were far too big for the account they sat in, and most of what he publishes now is the article he wishes somebody had handed him then. He reads every message in the group and answers the ones about risk first. You can read more about the Gold Empire approach here.


    This article is educational content, not financial advice. The cost figures in it are worked examples built on stated assumptions, a 100 ounce standard lot and a 6 dollar round turn commission, not quotes from any broker, and your own contract specification and fee schedule are the only numbers that apply to your account. It does not account for your personal circumstances, your tax position, or your risk tolerance, and nothing in it is a recommendation to buy or sell any instrument or to open an account anywhere. Trading leveraged products carries a high risk of losing money rapidly, and no entry, stop or target discussed should be treated as a signal. Consider speaking to a licensed professional in your jurisdiction before making decisions about your money.


  • The Best Way to Fund a Brokerage Account, and the Two Checks That Come First

    The Best Way to Fund a Brokerage Account, and the Two Checks That Come First

    The best way to fund a brokerage account is the method you can reverse, in an amount you can afford to lose entirely, into a firm you checked before the money left your bank. That sentence contains no product recommendation and it is the whole article in one line. Everything below is the reasoning, because most people funding an account for the first time are thinking about speed and fees, and the two things that actually decide the outcome are reversibility and who is on the other end.

    This is the least glamorous moment in trading and the one with the highest concentration of permanent damage. Once money arrives in a trading account it is exposed to two separate risks that have nothing to do with each other. The first is the market, which is the risk you signed up for. The second is the possibility that the account is not what you think it is, and that risk is not managed by a stop loss. It is managed before the transfer, or not at all.

    Why the Best Way to Fund a Brokerage Account Is a Question About Reversibility

    Payment methods are not interchangeable. They differ in one property that matters more than fees, speed or convenience: whether a third party can claw the money back for you if the other side turns out to be dishonest or simply refuses to pay.

    A card payment sits at one end. Card networks run chargeback procedures, and the money moves through an intermediary who has a relationship with you and an interest in your complaint. A bank transfer sits in the middle. It is traceable, it is slow, and recovering it depends on the receiving bank cooperating, which they may or may not do. Cryptocurrency sits at the far end. A confirmed transfer is final by design. There is no administrator, no dispute window and nobody to appeal to. That is a feature of the technology, not a flaw, but it means the decision is made entirely before you press send.

    Ranking by reversibility inverts the usual ranking. The method that clears fastest and cheapest is usually the one that offers you the least protection, and the friction of a slower method is doing something for you even when it feels like an obstacle.

    The Numbers Behind the Warning

    This is where the argument stops being a matter of temperament. The FBI’s Internet Crime Complaint Center publishes an annual report with reported losses broken out by crime type, and the investment category has a shape that is hard to look away from.

    In the 2024 IC3 Annual Report, reported losses to investment fraud were $6,570,639,864, from 47,919 complaints. The year before, the same category recorded $4,570,275,683 from 39,570 complaints, and the year before that $3,311,742,206 from 30,529 complaints. Working from those published figures, reported investment fraud losses grew 43.8 percent in a single year, and 98.4 percent across two years, which is to say the number very nearly doubled while most people were not watching. Investment was the largest single loss category in the 2024 report, ahead of business email compromise at $2,770,151,146.

    Chart supporting the best way to fund a brokerage account, showing what a funding fee costs to break even and on a round trip
    The arithmetic of a funding fee, computed for the best way to fund a brokerage account: what you must gain to be square again, and what a round trip costs if you never trade at all.

    Divide the 2024 loss total by the 2024 complaint count and you get roughly $137,120 of reported loss per investment complaint. I computed that myself and the assumption matters: it divides the full reported loss by every investment complaint, including the ones that reported no loss at all, so it is not the typical victim’s experience and it is not a median. It is a rough scale marker, and the scale is a life changing amount of money per report.

    The same report puts total reported losses across all crime types at $16.6 billion from 859,532 complaints in 2024, a 33 percent increase on the previous year, with an average reported loss of $19,372 per complaint. These are reported figures from one country’s reporting channel, so they undercount rather than overcount. Nobody files a complaint about the money they did not lose.

    The Fee You Pay Twice

    Now the boring arithmetic, which is the part I actually care about, because it applies on every single deposit rather than only in the bad case.

    Suppose a funding method takes a percentage fee off the top. Call it f. The money that lands in the account is what remains after the fee, so to get back to the amount you originally sent, the account has to gain 1/(1 minus f) minus 1. That is slightly more than the fee itself, and the gap widens as the fee grows.

    A 1 percent funding fee needs a 1.01 percent gain to be square. A 2 percent fee needs 2.04 percent. A 3.5 percent fee needs 3.63 percent, and a 5 percent fee needs 5.26 percent. The assumption is simple and stated: the fee is taken off the deposit and nothing else changes.

    Now put the withdrawal on the other end, because money that goes in eventually comes out. If the same percentage applies both ways and you never place a single trade, a 1 percent method costs 1.99 percent of the money round trip, a 2 percent method costs 3.96 percent, and a 3.5 percent method costs 6.88 percent. Six point eight eight percent, for doing nothing at all. That is a real cost with no market risk attached to it, and it is invisible because it happens at two moments separated by months.

    The practical consequence is that funding an account repeatedly in small pieces with a percentage fee method is expensive in a way that compounds against you, while a flat fee method rewards the opposite behaviour. Neither is universally right. The point is that this is arithmetic you can do in thirty seconds with your own broker’s published schedule, and almost nobody does it.

    Check the Firm Before You Check the Fee

    Fees are a second order question. The first order question is whether the entity receiving the money is regulated somewhere real, under the name it is trading under, for the activity it is actually performing.

    Three checks cost about ten minutes between them. Look up the firm on the register of the regulator it claims, and read the entry rather than the badge on the website, because badges are images and images are easy to make. Confirm the legal entity name on the payment instruction matches the entity on the register, since a mismatch between the regulated name and the name your bank will see is a genuine warning rather than an administrative quirk. Check how old the domain is, which the CFTC suggests doing through ICANN’s public lookup in its own advisory on trading platforms making outsized claims.

    If any of those three come back ambiguous, the correct amount to transfer is zero. Not a small test amount. Zero. A test deposit tells you a payment rail works, which was never the thing in doubt.

    The Third Party Rule

    There is one rule with no exceptions, and it is the rule most often broken by people who are being defrauded without knowing it: the money must travel from an account in your own name directly to the firm, and it must come back the same way.

    Not through a helpful intermediary. Not through an account manager’s personal wallet. Not through someone in a group chat who offers a better rate. Not through a friend of a friend who will convert the currency for you. The CFTC’s advisory on money mules explains the other half of this, which is that people who move money on behalf of strangers can be committing a criminal offence, sometimes while believing they are doing a favour or working a legitimate remote job.

    A legitimate broker wants a clean audit trail as badly as you do, because their own licence depends on it. When someone offers to work around the payment process, the workaround is the product being sold. The related CFTC advisory on relationship investment scams describes the pattern in which trust is built over weeks before any request for money appears, and the request, when it comes, always involves an unusual payment route.

    Test the Exit Before You Trust the Entrance

    Here is the check that would have saved more accounts than any other, and it takes a fortnight of patience.

    Fund the account with an amount you would shrug at. Trade nothing, or trade the smallest size available. Then withdraw a portion, back to the same account it came from, and watch what happens. Not whether it arrives, but how it arrives: whether the process is documented, whether the timeline matches what was published, whether anybody contacts you to talk you out of it.

    That last one is the real signal. Pressure applied at the moment of withdrawal is the single clearest tell there is, and it costs nothing to test for. A firm that processes a small withdrawal without commentary has told you something no marketing page can tell you. If you want the mechanics of what a normal timeline actually looks like, how long a forex withdrawal takes covers the stages and where the delays legitimately come from.

    Fund In Steps, Not In One Move

    The last piece is size, which is the same question as position sizing wearing different clothes.

    The amount in the account sets the maximum possible loss from anything, market or otherwise. A larger balance does not make you safer. It makes the worst case larger. Funding in stages, with a working account balance and the rest left in your bank, caps the damage from every failure mode at once, including the ones nobody predicted, and it costs you nothing except the inconvenience of a second transfer later.

    The counterargument is percentage funding fees, which punish multiple transfers. That is a genuine tension and it resolves in favour of a flat fee method if you plan to fund in stages, which is another reason the fee schedule and the funding plan need to be decided together rather than one after the other.

    Free gold survival sheet

    Get the free Gold Empire survival sheet, a one page guide to the account habits that decide whether a bad month is survivable, including the funding and withdrawal checks this article argues for. One email, no spam, unsubscribe anytime.

    Get the free survival sheet →

    Frequently asked questions

    What is the best way to fund a brokerage account for a first deposit?
    The method that is reversible, in the smallest amount the firm will accept, after you have checked the firm on its regulator’s register. The first deposit is a test of the relationship rather than the start of a trading career, and treating it that way costs you a couple of weeks and nothing else.

    Is a card deposit better than a bank transfer?
    They protect you differently rather than one being better. Card payments carry chargeback procedures that give you a route to dispute, while bank transfers are traceable but slower to recover. The gap between both of them and an irreversible transfer is much larger than the gap between them.

    Why do brokers charge to fund an account at all?
    Payment processing genuinely costs them money, and some pass it through. What matters is whether it is a flat amount or a percentage, because a percentage on both ends of a round trip costs 3.96 percent of the money at a 2 percent rate even if you never place a trade.

    Should I fund the account in one transfer or several?
    Several, unless the fee structure makes that expensive. The balance in the account is the maximum you can lose to any cause at all, so keeping most of the capital in your bank caps every failure mode at once.

    Someone offered to deposit on my behalf at a better rate. Is that normal?
    No. Money should move from an account in your name straight to the firm and back the same way. Moving funds for other people can amount to acting as a money mule, which the CFTC warns can be a criminal offence even when the person believes they are helping.

    Where Gold Empire Fits

    Gold Empire is free to follow. Daily gold analysis with the reasoning attached, losing days included, plus an optional Kit for people who want the method written down. Nothing here promises a profit and nothing here ever will.

    Survival first, as always. This article is the money movement half of a question whose other half is capital allocation, and risk management in gold trading is where the two meet. If you have not opened the account yet, how to open a gold trading account covers what happens before the first transfer and the best broker for gold trading covers the questions worth asking while you still have the leverage of being a prospect. Once the money is in, how much to risk per trade decides how long it survives contact with the market.

    About the author. Matthew writes Gold Empire. He is interested in the unglamorous half of this business, cost, size, frequency and the arithmetic of staying solvent, on the view that most accounts are lost to ordinary errors repeated patiently rather than to one dramatic mistake.

    Disclaimer: This article is general educational content about payment mechanics, fee arithmetic and fraud avoidance. It is not financial advice, not legal advice, not tax advice, and not a recommendation of any broker, payment provider, platform or account type. Trading gold, CFDs and leveraged products carries a high risk of losing money rapidly. No entry, stop or target discussed should be treated as a signal. Fraud figures are quoted directly from the FBI Internet Crime Complaint Center’s 2024 IC3 Annual Report and are reported losses from complaints filed with that one channel, which means they undercount total fraud rather than overcount it. The figure of roughly $137,120 per investment complaint, the growth rates of 43.8 percent and 98.4 percent, and all fee break even and round trip percentages were computed by me from the published figures and from stated fee rates; the fee calculations assume a percentage taken off the transfer with nothing else changing, ignore currency conversion, intermediary bank charges, spread, commission, financing and slippage, and the fee rates used are illustrative examples rather than any particular firm’s published schedule. Payment reversibility depends on your jurisdiction, your bank, your card issuer and the specific scheme rules that apply to you, none of which this article can know. Consumer protection procedures referenced are described from the published CFTC money mules advisory and CFTC relationship investment scam advisory. No gold price level is quoted anywhere in this article and no trading results are represented. Verify your own broker’s terms and your own regulator’s register before moving any money.


  • How to Add Gold to MetaTrader 4, and the One Line to Check Before You Trade It

    How to Add Gold to MetaTrader 4, and the One Line to Check Before You Trade It

    How to add gold to MetaTrader 4 is a question with a fifteen second answer and a much longer consequence. The fifteen seconds are worth having, so I will give them to you first and then explain why the second half of this article exists at all. The short version: gold is usually hidden rather than missing, and it lives in a folder you have to open on purpose.

    The longer version is the one that costs people money. Once the symbol is on your screen, there is a single line in its contract specification that decides how much of your account is at stake every time you type a number into the volume box. Two brokers can both hand you something called GOLD and mean quantities that differ by a factor of a hundred. Nobody warns you, because from the platform’s point of view nothing is wrong. You asked for one lot and you got one lot.

    How to Add Gold to MetaTrader 4 in Under a Minute

    Gold is not on the default watchlist for most accounts, which is why it looks absent. It is not. Here is where it is hiding.

    Find the Market Watch panel, the list of instruments with bid and ask prices, usually down the left side. If it is not visible, open it from the View menu. Right click anywhere inside that list and choose Symbols. You will get a window with folders in it, and gold will be inside one called Metals, Spot Metals, Commodities or something similar depending on your broker. Open the folder, find the gold line, and either double click it or select it and press Show. It appears in Market Watch and you can now open a chart from it.

    MetaTrader 5 works the same way with one extra convenience: there is a plus button underneath the Market Watch list, and MetaQuotes describes the behaviour as typing “the name of the symbol” after which “the list of suitable symbols is shown”. The official Market Watch documentation is worth two minutes of your time, and the equivalent MetaTrader 4 help covers the older interface.

    If the folder is there but gold is not in it, that is not a display problem. It means the account type you opened does not carry metals, and no amount of clicking will add them. That is a conversation with your broker, and it is a fast one.

    Why It Is Almost Never Called “Gold”

    The symbol you are looking for is most often XAUUSD. XAU is the standard code for one troy ounce of gold, so XAUUSD reads as the price of gold in dollars, exactly like EURUSD reads as the price of euros in dollars. Some brokers do label it GOLD. Others use both, for different products.

    Then there are the suffixes, and these matter more than they look. You will see things like XAUUSD.m, XAUUSDmicro, XAUUSD.c, GOLDmini, or the same name with a dot and two letters after it. A suffix is not decoration. It is usually the broker telling you which contract you are about to trade, and different suffixes on the same underlying metal can carry different contract sizes, different minimum volumes and different margin requirements.

    This is also why a symbol that worked on your demo may not exist on your live account, or may exist under a different name with a different size behind it. The demo and the live server are different servers with different symbol lists.

    The One Line in the Contract Specification That Decides Everything

    Before you place a single order, right click the symbol and open Specification. MetaQuotes describes this window as showing “the symbol trading conditions (contract specification)”, and it lists spread, margin, execution type and, the line that matters here, contract size.

    Contract size tells you how many ounces one lot represents. The common conventions are 100 ounces for a standard contract, 10 for a mini and 1 for a micro. Read that again, because the ratio between them is 100 to 10 to 1. The same ticket, the same typed volume of 1.00, means a hundred times more metal on the first than on the last.

    The platform will not stop you. The order dialog does show you the resulting position value before you confirm, which is the number people scroll past. So let me make the case for not scrolling past it, in percentages rather than in dollars, so that it applies to your account whatever size it is.

    Chart supporting how to add gold to MetaTrader 4, showing the percent of account equity moved by a single session when the position controls ten times the account
    How to add gold to MetaTrader 4 matters because the contract size sets your exposure multiple, and the exposure multiple sets what an ordinary day does to the account.

    What One Ordinary Day Actually Does

    I took the London afternoon gold benchmark published by the LBMA, 2,666 sessions from 4 January 2016 to 19 August 2026, and measured every day to day move. Half of all sessions moved 0.4997% or less. One session in four moved more than 0.9671%. One in ten moved more than 1.5719%. One in twenty moved more than 2.0948%. The largest single session in the whole sample moved 7.8289%, on 30 January 2026, and it was a fall.

    Those look like small numbers because gold is not a volatile asset by percentage. The exposure multiple is what turns them into something else. Define that multiple as the notional value of your position divided by your account equity, and call it E. An E of 10 means you are controlling ten times the money you have. A day that moves gold by d percent moves your account by E times d percent, and here is what that produces at E of 10:

    • A median day: 5.00% of the account.
    • Three days in four are under: 9.67%.
    • One day in ten exceeds: 15.72%.
    • One day in twenty exceeds: 20.95%.
    • The worst day in the sample: 78.29%.

    Two reference points are worth memorising. At an E of 2.00, a median day is worth about 1% of your account, which is roughly what most risk frameworks would call a normal day. And at an E of 12.8, the worst session in this ten year sample takes the entire account. Not a margin call, not a scare. All of it.

    Frequency matters as much as magnitude. Walking the same series forward, an account running at E of 20 had a session costing 10% or more of equity in 22.81% of all sessions, with a median wait of just 3 sessions before the first one arrived. At E of 50, 2.96% of sessions were large enough to cost 100% of the account.

    The Mistake That Multiplies Everything by One Hundred

    Now put the two halves together, because this is the specific accident this article exists to prevent.

    Suppose you sized a position sensibly for a micro contract, one ounce per lot, and arrived at an exposure multiple of 1. Modest. Defensible. Then suppose you traded that same volume on the standard symbol, one hundred ounces per lot, because the names looked alike and you did not open Specification.

    Your E is no longer 1. It is 100. A median day, the sort of day nobody remembers, now moves 49.97% of your account. The worst day in the sample would have moved 782.89% of it, which is simply a way of saying the account ended long before the day did, and on an account without negative balance protection the loss does not stop politely at zero.

    The error is not in your analysis, your entry or your discipline. It is in a dropdown. That is what makes it worth thirty seconds of prevention.

    Free gold survival sheet

    Get the free Gold Empire survival sheet, a one page guide to the account habits that decide whether a bad month is survivable, including the contract size check this article argues for. One email, no spam, unsubscribe anytime.

    Get the free survival sheet →

    The Thirty Second Check, Every Time You Change Broker

    This is the whole habit, and it is short enough to actually do.

    Open Specification and read the contract size. Write it down. Then open the order dialog, type the volume you intend, and read the position value it shows you before confirming. Divide that value by your account equity. That is your E. If it is a number you would not say out loud to someone whose opinion you respect, change the volume, not the plan.

    Do this again on every new account, every new broker and every symbol with a suffix you have not traded before. The check is not clever. It is just the one thing that stands between a correct idea and a hundredfold error, and it costs less time than reading this paragraph did.

    What This Does Not Say

    It does not say small contracts are safer. A micro contract traded at fifty lots is the same exposure as a standard contract traded at half a lot. The contract size is not the risk. The contract size multiplied by your volume, divided by your equity, is the risk, and only the last of those three is fully under your control.

    It does not say the worst day will repeat. The 7.8289% session is one observation from one decade, and a single daily benchmark understates what happens inside a day, so the real intraday extremes were worse than anything quoted here.

    It does not recommend any exposure multiple. There is no number in this article you should copy. The point is that you should know what yours is, and most people who blow accounts could not have told you.

    And nothing here is a view on the price of gold. There is no price level anywhere in this article, deliberately. Everything is expressed as a percentage so that it stays true whatever the market is doing when you read it.

    Frequently Asked Questions

    Why can I not find gold in MetaTrader 4 at all?
    Most often it is hidden rather than absent: right click in Market Watch, choose Symbols, and open the Metals or Commodities folder. If it genuinely is not listed there, your account type does not carry metals and only your broker can change that.

    What is the difference between XAUUSD and GOLD?
    Usually nothing but the label, since both refer to spot gold priced in dollars. Occasionally a broker uses the two names for products with different contract sizes, which is exactly why the answer comes from the Specification window rather than from the name.

    What do the suffixes like .m or micro mean?
    They generally identify the contract variant, and different variants can carry different contract sizes, minimum volumes and margin requirements. Treat a suffix you have not seen before as an unknown instrument until you have read its specification.

    How to add gold to MetaTrader 4 on a phone?
    The mobile apps use the same symbol list: open Quotes, press the plus icon, and browse to the Metals group. The contract size is still worth checking, and it is easier to misread on a small screen, which is an argument for doing the check on a desktop first.

    Why does one lot cost so much more on my new broker?
    Almost always because the contract size differs from your old one. Compare the two Specification windows side by side before you assume anything about margin or leverage has changed.

    Where Gold Empire Fits

    Gold Empire is free to follow. Daily gold analysis with the reasoning attached, losing days included, plus an optional Kit for people who want the method written down. Nothing here promises a profit and nothing here ever will.

    Survival first, as always. The exposure multiple in this article is the same quantity approached from the platform side, and how to calculate lot size for gold forex is where the arithmetic gets done properly. What is leverage in gold trading explains the mechanism that makes E larger than 1 in the first place, and risk management in gold trading is the piece that ties size, frequency and survival together. If you are still choosing where to open an account, how to open a gold trading account and the best broker for gold trading cover what to ask before you sign up, and contract size belongs on that list of questions.

    About the author. Matthew writes Gold Empire. He is interested in the unglamorous half of this business, cost, size, frequency and the arithmetic of staying solvent, on the view that most accounts are lost to ordinary errors repeated patiently rather than to one dramatic mistake.

    Disclaimer: This article is general educational content about trading platform setup and position sizing arithmetic. It is not financial advice, not a recommendation of any broker, platform or account type, and not a suggestion to open any particular position. Trading gold, CFDs and leveraged products carries a high risk of losing money rapidly. No entry, stop or target discussed should be treated as a signal. Platform behaviour is described from the publicly published MetaTrader 5 Market Watch documentation and MetaTrader 4 help published by MetaQuotes; menu names, symbol names, suffixes, contract sizes and folder labels are set by each individual broker and will differ, so your own Specification window is the authority and not this article. Contract sizes of 100, 10 and 1 ounces are the common market conventions and are used here as illustrative examples, not as a statement about any particular broker’s products. All market figures were computed by me from the published LBMA gold benchmark, afternoon fix, across the 2,665 price steps between 2,666 published sessions from 4 January 2016 to 19 August 2026, using published benchmark values only. Because the sample contains one observation per business day, intraday extremes are understated and the real worst case within a session was larger than any figure quoted here. Position outcomes are treated as linear in the underlying move, ignoring spread, commission, financing and slippage, each of which makes a real result worse rather than better. The exposure multiples shown are illustrations of arithmetic and are not recommendations of any position size. No gold price level is quoted anywhere in this article and no trading results are represented. Past behaviour of a public benchmark is not a prediction.


  • How Long Does a Forex Withdrawal Take, and What the Wait Is Made Of

    How Long Does a Forex Withdrawal Take, and What the Wait Is Made Of

    How long does a forex withdrawal take is one of those questions that gets answered badly on purpose. Support desks say three to five business days because it is true often enough to be safe. Forum threads say it took them two hours, or eleven days, and both are telling the truth about their own case. Neither answer helps you, because a withdrawal is not one process with one duration. It is three separate waits stacked end to end, and only the middle one runs on published rules that anyone can check.

    So I went and checked them. The middle wait, the part where money actually moves between banks, is governed by operating hours the Federal Reserve publishes openly. I took those hours, ran them against every calendar day of this year, and found something I did not expect to be quite so stark: the single biggest thing you control about the length of your wait is not your broker, not your payment method, and not your verification status. It is which day of the week you press the button.

    How Long Does a Forex Withdrawal Take: The Three Clocks

    Before the arithmetic, the anatomy. Money leaving a trading account passes through three custodians, and each one has its own clock running at its own speed for its own reasons.

    Clock one is the broker’s internal review. Somebody, or some system, checks that the request came from you, that the destination matches a verified method already on file, and that nothing about the pattern trips an anti money laundering flag. This clock has no published schedule anywhere in the industry. It is a business process, it varies by firm, by time of day, by whether a human needs to look, and it is the one leg where a firm’s operational quality shows up plainly.

    Clock two is the payment rail. Once the broker releases the payment, it has to travel on an actual settlement system, and settlement systems keep hours. This is the leg people assume is instantaneous because sending a message feels instantaneous. It is not, and its hours are a matter of public record.

    Clock three is your receiving bank. Funds arriving at your bank still have to be posted to your account, which is a separate internal process from the settlement that delivered them. Same shape as clock one, opaque, and dependent on the institution.

    Two of those three clocks are private business processes you cannot inspect. One of them is published. Guess which one everybody argues about and which one nobody measures.

    Clock Two, and Why It Is the Only One You Can Actually Check

    In the United States, high value payments between banks run over the Fedwire Funds Service, which the Federal Reserve describes as a real time gross settlement system where transfers become immediate, final and irrevocable once processed. Excellent. Now read the hours, which sit in the same document.

    The Fedwire business day opens at 9:00 p.m. eastern time on the preceding calendar day and closes at 7:00 p.m. eastern time, Monday through Friday, excluding designated holidays. There is a further cutoff at 6:45 p.m. eastern time for transfers made for the benefit of a third party, which is what a payment to a broker’s customer is.

    Read that again with your own withdrawal in mind. If your broker finishes its review at 8:00 p.m. eastern on a Friday, there is no rail running. Not a slow rail, not a queue, no rail at all. The system reopens at 9:00 p.m. eastern on Sunday for Monday’s business day. Nothing was lost, nobody was negligent, and your money sat still for roughly two and a half days because of a published schedule that has nothing to do with your account.

    The cheaper alternative rail behaves differently and, in one respect, worse. The automated clearing house is described by the Federal Reserve as a nationwide network through which institutions send each other batches of electronic transfers. The operative word is batches. ACH does not move your payment when your payment is ready, it moves it when the batch goes, which is why an ACH transfer that could physically complete in seconds routinely takes days.

    And then there is the part that makes the whole conversation honest. Since 20 July 2023 the United States has had the FedNow Service, which the Federal Reserve describes as maintaining uninterrupted 24x7x365 processing, with a 24 hour business day every day of the week including weekends and holidays, settling funds in near real time. Instant settlement, at any hour, any day, has existed for years now.

    Which means that when a withdrawal takes days, the delay is not a law of physics. It is a choice of rail, made by institutions, for reasons of cost and risk and habit. That is not an accusation, those are often good reasons. But it does change the question you should be asking from “why is this slow” to “which rail is this firm using, and why”.

    The Day of the Week Costs More Than Anything Else You Control

    Here is where it stops being anatomy and starts being arithmetic. I took the Fedwire calendar, Monday to Friday minus the eleven Federal Reserve holidays, and asked a single question for every one of the 365 days of 2026: if the broker releases the payment after today’s cutoff, how many calendar days pass before a rail exists to carry it?

    How long does a forex withdrawal take, shown as the mean number of calendar days before the payment rail can move the money, by the weekday the request is made
    How long does a forex withdrawal take, measured on the one clock that publishes its hours: the payment rail, by the day you ask.

    Monday through Thursday all sit at roughly one day, between 1.00 and 1.17. Friday sits at 3.10. Saturday at 2.10, Sunday at 1.10. Across the whole year the mean is 1.50 calendar days.

    The gap between Friday and Tuesday is 2.08 calendar days. Two days of waiting, bought with nothing, obtained by nothing, caused entirely by which square of the calendar the request landed in. No verification tier, no premium account, no support ticket changes that number, because it is not about you.

    Holidays stack on top. The worst case in 2026 is four calendar days, and it occurs five separate times: a request on Thursday 24 December does not meet a rail until Monday 28 December, and the same four day gap opens around Juneteenth, Independence Day, Labor Day and Columbus Day. If your withdrawal habit is “I do the admin on Friday afternoon”, you have quietly signed up for the slowest version of this available, every single week, forever.

    The fix costs nothing and takes no negotiation. Submit early in the week, and early in the day. That is the entire intervention.

    What the Wait Actually Costs, and Why That Matters Less Than You Think

    There is a tidier argument I could make here, and it happens to be wrong, so let me make it and then knock it down honestly.

    The argument goes: money parked at a broker is money not earning the risk free rate, therefore delays cost you. True. Let us price it. Using the Federal Reserve H.15 three month Treasury constant maturity, which stood at 3.87 percent per year on 17 August 2026, on an actual over 365 basis with no compounding, five days of float on 10,000 units of account currency costs about 5.30. On 100,000 it costs about 53. Thirty days on 10,000 costs about 31.81.

    That is the honest size of it, and it is small. Five days of waiting on a five figure balance costs less than lunch. Anyone telling you that withdrawal speed matters because of lost interest is selling something.

    So why care at all? Because the delay is not valuable information about money. It is valuable information about the firm. A withdrawal is the only test in this entire business where you find out, with certainty and at a time of your choosing, whether the balance on your screen is a number or an asset. Everything else on the platform is a promise. The withdrawal is the settlement of that promise, and it is the one experiment you can run cheaply, early, and repeatedly.

    Which is the actual advice buried in all of this arithmetic: make a small withdrawal deliberately, soon after you fund an account, before the balance is large enough for the answer to hurt. Not because you need the money. Because you need the answer, and the answer costs about five units of currency to obtain.

    When the Wait Stops Being Plumbing

    Everything above describes a slow but functioning system. Now the other case, and it is worth being precise rather than dramatic about it, because the two look identical from the outside for the first several days.

    The FBI’s Internet Crime Complaint Center publishes an annual count of what people report losing. In its 2025 Annual Report, IC3 logged 1,008,597 complaints and 20.877 billion dollars in reported losses, an average of 20,699 dollars per complaint across every category of internet crime it tracks.

    Investment fraud was the largest single loss category of the year: 72,984 complaints, 8,648,617,756 dollars. Divide those and the average investment fraud complaint runs to roughly 118,500 dollars, about 5.7 times the average across all crime types. This category does not take small amounts from many people. It takes life changing amounts from fewer people.

    The IC3 report also describes the mechanism, and this is the part that belongs in an article about withdrawals. In the pattern it documents, victims who try to take their money out are told they must first pay taxes and fees, as a final extraction before the operators disappear with everything. The report notes victims are then targeted again by people offering to recover the lost funds.

    So here is the line, and it is bright, and it has no exceptions worth entertaining:

    A legitimate firm never requires you to send money in order to receive money. Withdrawal fees are deducted from the amount leaving. They are not collected in advance as a separate deposit, ever, by anyone, for any reason, under any name.

    Tax, clearance fee, insurance, verification bond, liquidity charge, anti money laundering deposit. The label changes and the request does not. If a withdrawal is blocked until you fund something, you are not experiencing a delay. You are being shown the end of the script.

    Distinguishing this from ordinary slowness turns out to be simple, once you stop measuring the wrong variable. The length of the wait tells you almost nothing, because as the chart above shows, four calendar days can be entirely normal. The direction of the money tells you everything. Money owed to you should only ever move toward you.

    If It Has Already Gone Wrong, the Clock Is the Only Lever Left

    IC3 runs a Recovery Asset Team that asks receiving banks to freeze funds before they move on. In 2025 it ran 3,574 domestic freeze actions and froze 507,042,623 dollars, plus 326 international actions freezing 171,970,560 dollars. That is 679,013,183 dollars in total.

    Set that against the 20.877 billion dollars of reported losses for the year and it comes to 3.25 percent.

    Sit with that number for a second, because it reframes the whole subject. A dedicated federal recovery process, working with the banks, staffed and funded, recovers a low single digit percentage of what gets reported. Not because the process is bad, its own success rate on the incidents it reaches in time is far higher, but because most cases never reach it while the money is still catchable. The report’s own guidance is blunt about it: if you discover a fraudulent transfer, time is of the essence, contact your financial institution immediately and request a recall, and file at ic3.gov regardless of the amount.

    Recovery is not a plan. Not sending the money is the plan. The 3.25 percent is what the backup plan is actually worth.

    What This Does Not Say

    It does not say that a slow withdrawal means fraud. The overwhelming majority of delays are exactly what the first half of this article describes, a calendar and a batch window, and treating every wait as a crisis will cost you nothing but sleep and your own credibility with a support desk that is probably doing its job.

    It does not name a broker, rate one, or suggest that fast withdrawals prove a firm is sound. Speed is a service level, not a solvency test. A firm can pay quickly for years and still be badly run.

    It does not model your broker’s internal review or your bank’s posting, because neither publishes hours. The chart above is the rail only, which is precisely why it is the only leg I was willing to put a number on.

    And the payment hours cited are those of the United States system. If your broker, your bank, or your correspondent chain sits in another jurisdiction, the shape of the argument holds and the specific hours do not.

    Free gold survival sheet

    Get the free Gold Empire survival sheet, a one page guide to the account habits that decide whether a bad month is survivable, including the small test withdrawal this article argues for. One email, no spam, unsubscribe anytime.

    Get the free survival sheet →

    Frequently Asked Questions

    So how long does a forex withdrawal take, in one sentence?

    Broker review, plus a payment rail that averaged 1.50 calendar days across 2026 and reaches 3.10 on a Friday, plus your bank’s posting time. The middle figure is the only one anybody publishes, and it is usually the smallest of the three.

    Why is my withdrawal slower than my deposit was?

    Deposits are usually taken by card or instant transfer, which are built for speed because the money is arriving. Withdrawals frequently go by wire or by batch clearing, and they also pass through a review step that deposits do not have. Different direction, different rail, different checks.

    Does asking support to hurry it up help?

    Only on clock one. Nobody at a brokerage can make a settlement system run outside its published hours. If the delay is the weekend, escalation changes nothing except your blood pressure.

    Is a withdrawal fee itself a warning sign?

    No. A fee deducted from the amount you are withdrawing is ordinary commercial practice. A fee you are asked to deposit before the withdrawal will be released is the pattern the IC3 report describes, and it is categorically different.

    How small should a first test withdrawal be?

    Small enough that losing it teaches you something cheaply, and large enough that the firm processes it as a real payment rather than waiving the checks. The point is the process, not the sum.

    Where did the day of the week figures come from?

    I computed them from the Fedwire operating hours published by the Federal Reserve, applied to all 365 days of 2026 against the eleven Federal Reserve holidays. The full assumptions are in the disclaimer below.

    Where Gold Empire Fits

    Gold Empire is a free publication about the unglamorous half of trading gold: cost, size, frequency, and the account mechanics that decide whether anyone is still here in a year. There is nothing to buy. The free survival sheet is the one page version of the habits that keep an account intact, and the reading list is open to everyone.

    If this was useful, how to open a gold trading account covers the other end of the same pipe, the deposit side and the verification that makes withdrawals smoother later. Choosing a broker for gold trading is where the due diligence belongs, before the money goes in rather than after. The difference between a real and a demo account is worth reading beside this one, because a demo account never has to answer the question this article is about. And risk management for gold trading remains the piece everything else here is built on.

    About the author. Matthew writes Gold Empire. He is interested in the unglamorous half of this business, cost, size, frequency and the arithmetic of staying solvent, on the view that most accounts are lost to ordinary errors repeated patiently rather than to any single dramatic trade.

    Disclaimer: This article is general educational content about payment mechanics and account safety. It is not financial advice, not a recommendation of any broker, payment method or product, and not a suggestion to open or close any position. Trading leveraged products carries a high risk of losing money rapidly. No entry, stop or target discussed should be treated as a signal. The settlement hours and the batch clearing description are quoted from the Fedwire Funds Service, FedACH and FedNow Service pages published by the Federal Reserve Board. The weekday waiting figures were computed by me from those published Fedwire hours applied to all 365 calendar days of 2026, against the eleven Federal Reserve observed holidays for that year, and they model the interbank rail only, excluding any broker’s internal review and any receiving bank’s posting time. The cost of float figures use the Federal Reserve H.15 three month Treasury constant maturity of 3.87 percent as published for 17 August 2026, on an actual over 365 basis with no compounding, no fees and no tax. The fraud and recovery figures are as published in the FBI IC3 2025 Annual Report, with per complaint averages computed by me by dividing published totals by published counts; IC3 records only what is reported to it, so those figures are a floor rather than a census. These are United States payment systems and United States crime reporting, and your jurisdiction may differ. No gold price level is quoted anywhere in this article and no trading results are represented.


  • Difference Between Real and Demo Trading Account: The Reset Is the Whole Story

    Difference Between Real and Demo Trading Account: The Reset Is the Whole Story

    The difference between real and demo trading account is not the platform, the spread or the chart. Both give you the same instrument, the same candles and usually the same broker. The difference is that a demo account can be started over and a real one cannot, and that single fact changes what your results mean, not just how they feel.

    I want to make that concrete rather than motivational. I ran a simple simulation of a trader with no skill whatsoever, then asked how often that trader still produces a demo record that looks like talent, and how sure the answer becomes once you allow a few restarts. Then I measured how far gold actually travels between two published prices, because that is where the second difference lives: a demo fills your stop where you asked, and a market fills it where the next price happens to be.

    What the Difference Between Real and Demo Trading Account Actually Is

    Strip away the marketing and there are three real differences, in order of how much damage they do.

    The first is the reset. A demo balance is refillable. When it is gone you press a button and start again with a clean number, and nothing about the previous attempt follows you. A real balance has no such button, which means every result you produce on it is a single draw from the distribution, and you have to live inside whichever draw you got.

    The second is the fill. A demo is a simulator, and simulators are polite. Your stop order gets the price you typed. In a real market an order is a request, and on the days that actually matter the next available price is somewhere else entirely.

    The third is you. On a demo the money is imaginary, so the part of your brain that protects you stays asleep. Nothing in a demo can teach you what you will do when a real position is 2 percent underwater and your rule says close it.

    Everything else people list, minimum deposit, execution model, the little “practice” label in the corner, is downstream of those three.

    The Reset Is the Biggest Difference, and It Is Measurable

    Here is the experiment. I simulated a trader with no edge at all: a coin flip, where a win pays exactly one unit of risk and a loss costs exactly one unit of risk, with 2.0 percent of current equity risked on each trade and 100 trades in a run. Expectancy is precisely zero. This trader knows nothing, has no method, and never improves.

    Across 200,000 simulated runs, the median run finished at minus 1.98 percent, and 53.94 percent of runs finished at a loss. That much is unsurprising. What matters is the tail. 13.64 percent of runs finished at plus 20 percent or better, and 1.79 percent finished at plus 50 percent or better. One run in seven, from a trader with no skill at all, produces a record that in any other context would be called evidence of a method.

    I ran the same thing for a trader who is slightly behind after costs, a 47.5 percent win rate for an expectancy of minus 0.05 units of risk per trade. That trader still finished at plus 20 percent or better in 5.48 percent of runs.

    Now Allow the Restart

    This is the part that makes demo records almost meaningless. Nobody blows a demo account and quits. They reset it. So the honest question is not what one run looks like, it is what the best run out of several looks like, because the best one is the one that gets remembered, screenshotted and treated as the baseline.

    Difference between real and demo trading account shown as the chance a no edge trader still produces a winning demo run after several restarts
    The difference between real and demo trading account, measured: restarts, not skill, produce the good looking record.

    For the trader with no edge at all, the probability that at least one run finishes at plus 20 percent or better climbs from 13.64 percent for a single run to 35.60 percent over three, 51.97 percent over five, 76.93 percent over ten and 94.68 percent over twenty. At fifty restarts it is 99.93 percent. Even the trader who is losing money to costs reaches 43.10 percent over ten restarts and 67.62 percent over twenty.

    The size of the best run is just as striking. Taking the median of the best result out of a set of runs: one run has a median of minus 1.98 percent, best of five has a median of plus 24.61 percent, best of ten plus 34.99 percent, and best of twenty plus 40.50 percent. Nothing improved. No method was learned. The only thing that changed was how many times the trader was allowed to try.

    That is the whole argument. A demo account does not measure a trader, it samples one. A real account gives you one sample and charges you for it.

    What This Does Not Say

    It does not say demo results are worthless, and it does not say a good demo result means you have no edge. It says a good demo result is not evidence on its own, because the same result is produced in bulk by pure chance plus restarts. If you want your demo record to mean something, the number of restarts has to be part of it, and honestly reported. One run of 100 trades, kept whether it went well or badly, is worth more than ten runs of which you remember one.

    It is also worth noticing the drawdown figure hiding inside those pretty runs. The median worst drawdown inside a run was 20.02 percent for the no edge trader. Even the runs that ended well spent time deeply underwater, and on a demo that time costs nothing.

    The Second Difference: Your Stop Is a Request, Not a Guarantee

    A demo fills a stop order at the stop price. That is the single most flattering assumption a simulator makes, and it hides the entire category of risk that ends real accounts.

    To size it, I took the published LBMA gold benchmark, afternoon fix, from 4 January 2016 to 14 August 2026. That is 2,663 published sessions and 2,662 steps from one published price to the next. The benchmark is a once a day auction, so each step is the move between two fixings rather than the intraday path, which makes it a conservative way to look at gaps.

    The median absolute step was 0.4998 percent. But 23.67 percent of steps were 1 percent or more, 5.75 percent were 2 percent or more, and 1.28 percent were 3 percent or more. The largest single fall in the sample was 7.83 percent, on 30 January 2026, and the largest rise was 5.27 percent, on 24 March 2020.

    Read Those Numbers as Stop Distances

    Turn them around and they answer a question every real account eventually asks. If your stop sits 1.0 percent away from your entry, a single step exceeded that distance on 23.67 percent of steps. At 1.5 percent away, 11.12 percent. At 2.0 percent away, 5.75 percent. Splitting the sample further, steps that crossed a weekend were worse than weekday steps at every threshold: 25.27 percent of weekend steps moved 1 percent or more against 23.24 percent of weekday steps, and 6.99 percent moved 2 percent or more against 5.42 percent.

    On a demo, none of that exists. Your stop is honoured at the number you typed on every one of those days. On a real account, one in twenty steps is bigger than a 2 percent stop, and when the price you asked for is not available, you get the one that is. That is not a broker cheating you, it is what a market is.

    If you want the mechanism behind this in more depth, what is a weekend gap in gold trading covers the gap itself, and where to place stop loss on XAUUSD covers how to choose the distance in the first place.

    The Third Difference Is the One No Simulator Can Reproduce

    The first two differences are arithmetic. This one is not, so I will not pretend to have measured it, but it is the one traders report most.

    On a demo you take the trade. On a real account you hesitate, or you take it and close it early, or you skip the one that would have worked and take the next one out of frustration. The rule you wrote is identical. The behaviour is not, because the money is.

    The regulator’s numbers are the closest thing to evidence I can point at for what happens when real money meets leverage. In its 2018 product intervention measures, ESMA reported that national regulators found 74 to 89 percent of retail accounts typically lose money on these products, with average losses per client ranging from 1,600 to 29,000 euros. Those are real accounts, not demos. Nobody in that statistic was short of information about how the platform works.

    This is also where account size stops being a detail. A demo hands you a round balance that has nothing to do with your life. How much money you actually need to start trading gold and the difference between a cent account and a standard account both come down to the same question: whether the smallest trade you can place still fits inside a risk budget you can survive.

    How I Would Actually Use a Demo Account

    None of this makes demo accounts useless. It makes them useful for a narrower set of things than people use them for.

    A demo is good for mechanics. Learning where the order ticket is, what happens when you modify a stop, how the platform displays position size, how to place a pending order without fumbling. That is real learning and there is no reason to pay for it.

    A demo is good for testing whether a written plan can be followed at all. If you cannot follow your own rules when nothing is at stake, the answer for the real account is already in.

    A demo is poor at estimating your edge, for the reason the simulation above shows. It is poor at estimating your costs, because financing and slippage are either absent or idealised. And it is worst of all at estimating you, since the entire variable it removes is the one that decides most outcomes.

    If I were moving from one to the other, I would do it in a size small enough that the first losing streak is boring, and I would keep the demo record honestly, restarts and all, so the number I carry across is the average and not the highlight. The wider framework for that sits in risk management for gold trading, which is the piece I would read before opening anything with real money in it.

    Free gold survival sheet

    Get the free Gold Empire survival sheet, a one page guide to sizing your first real positions so that the move from demo to live does not decide your account for you. One email, no spam, unsubscribe anytime.

    Get the free survival sheet →

    Frequently Asked Questions

    How long should I trade on a demo before going live?

    I would not answer that in weeks. I would answer it in evidence: a written plan, a number of trades executed to that plan, and an honest record including the runs you restarted. Time on a demo is easy to accumulate and proves very little on its own.

    Why are my demo results so much better than my real results?

    Three reasons, and they stack. You are seeing the best of several demo attempts rather than a single one, your stops were filled at the price you asked for rather than the price available, and you behaved differently because nothing was at stake. The first is the one people underrate, and it is the largest.

    Is a demo account exactly the same market data as a real account?

    Usually the feed is the same or close to it, which is why demos look convincing. What differs is what happens to your order when it meets that feed. Execution, not data, is where the simulation stops.

    Does the difference between real and demo trading account disappear on a small live account?

    It shrinks but it does not vanish. Real money at any size restores the fills and removes the reset, which are two of the three differences. The behavioural one scales with how much the amount matters to you, which is personal rather than numeric.

    Should I use a cent account instead of a demo?

    They answer different questions. A demo teaches mechanics for free. A cent account gives you real fills and no reset button at a size that does limited damage. Many people benefit from doing the first briefly and the second properly.

    Can a demo account tell me whether my strategy works?

    Only weakly, and only if you report every run rather than the best one. On the numbers above, a trader with no edge at all reaches a plus 20 percent run with 76.93 percent probability inside ten restarts, so a single good run is not distinguishable from luck without the rest of the record.

    Where Gold Empire Fits

    Gold Empire is a free Telegram channel where I post gold analysis with the reasoning written down before the move rather than after it, losing days included. Nothing has to be bought to follow along, and there is an optional Kit later for people who want more structure. I make no profit claims and I do not rank brokers for payment.

    The free survival sheet is the one page version of the sizing discipline that decides how the first live month goes. For neighbouring pieces, how to avoid losing money in forex trading takes the same subject from the cost side, and what is leverage in gold trading covers the mechanism that turns an ordinary day into a closed position.

    About the author. Matthew writes Gold Empire. He is interested in the unglamorous half of this business, cost, size, frequency and the arithmetic of staying solvent, on the view that most accounts are lost to ordinary errors repeated patiently rather than to any single dramatic trade.

    Disclaimer: This article is general educational content about how a simulated account differs from a funded one. It is not financial advice, not a recommendation of any broker, account type or platform, and not a suggestion to open any particular position. Trading gold and leveraged products carries a high risk of losing money rapidly. No entry, stop or target discussed should be treated as a signal. The simulation figures were computed by me under the assumptions stated in the text: 2.0 percent of equity risked per trade, a win paying one unit of risk and a loss costing one unit of risk, 100 trades per run, 200,000 runs per case, trades independent, and no improvement between runs. They describe a model, not any person’s results. The gold step figures were computed by me from the published LBMA gold benchmark, afternoon fix, over the 2,663 published sessions from 4 January 2016 to 14 August 2026. The client loss statistics and the leverage rules referenced are from ESMA and apply to retail clients in the European Union; your jurisdiction may differ. No gold price is quoted anywhere in this article and no trading results are represented. Past behaviour of a public benchmark is not a prediction.