Ask twenty traders what is a good risk reward ratio and you will get a number back almost instantly. One to two. One to three. Somebody will say never take anything under one to three, and say it with the confidence of a rule that has been handed down rather than tested.
Then watch what happens to accounts run on that rule. A lot of them lose money while religiously taking only high ratio trades, and the traders running them cannot work out why, because they followed the advice exactly.
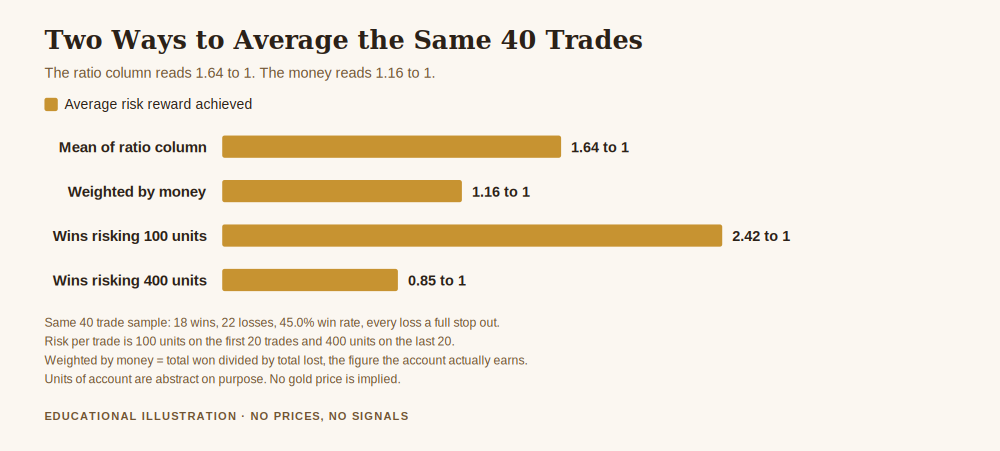
The problem is that the question has no answer on its own. A reward to risk ratio is one half of a pair, and the half you can choose is not the half that decides whether you make money. This article works through the arithmetic, which is short, and then through what it means for how you actually trade.
What Is a Good Risk Reward Ratio, and Why the Question Is Incomplete
Start with what the ratio is. If your stop is a certain distance from your entry, call that distance one unit of risk, or 1R. Your target is then some multiple of that distance. A target twice as far as the stop is 1:2. Three times as far is 1:3.
The useful thing about counting in R is that it strips out account size, lot size and the price of gold. Every trade becomes the same shape: risk one unit to try to make R units.
Now add the missing half. Over many trades, your outcome depends on the ratio and on how often you win. Those two numbers are tied together by one formula, the win rate at which you exactly break even:
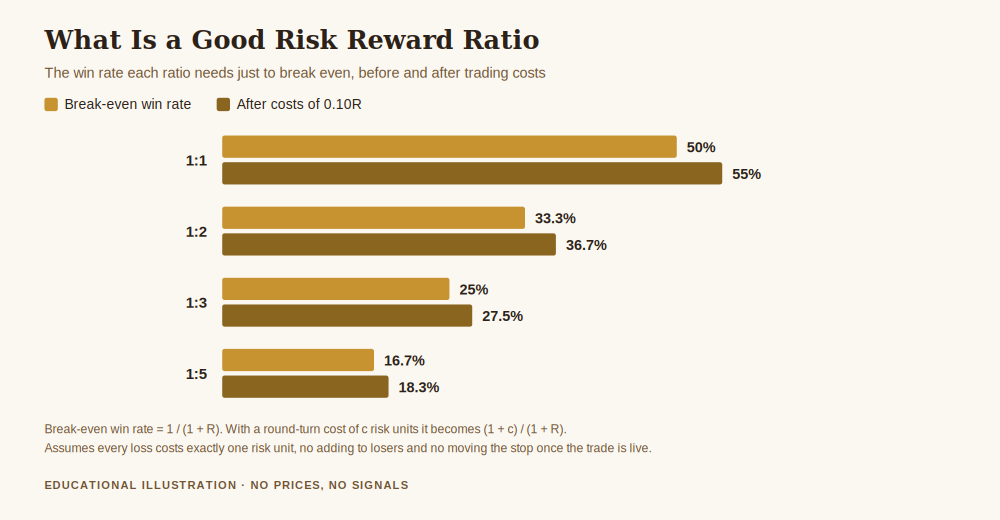
Break-even win rate = 1 / (1 + R)
Run it across the ratios people actually argue about:
- At 1:0.5, you need to win 66.7 percent of the time to break even
- At 1:1, you need 50.0 percent
- At 1:1.5, you need 40.0 percent
- At 1:2, you need 33.3 percent
- At 1:3, you need 25.0 percent
- At 1:5, you need 16.7 percent
This is the table that gets quoted in support of wide targets, and read quickly it does look like an argument for them. At 1:5 you only need to be right one time in six. That sounds like an easier job than being right half the time.
It is not an easier job. It is the same job, described differently, and the next section is the reason.
The Part That Changes the Answer
Here is what the table leaves out. When you move your target further away, you do not keep the same win rate. You lower it, because a more distant target is less likely to be reached before the stop is.
How much less likely? There is a clean way to put a number on it. Assume for a moment that price has no direction at all, that it is as likely to tick up as down, which is the honest starting assumption when you have not yet demonstrated an edge. Under that assumption the probability of reaching a target R times your stop distance, before touching the stop, is a classical result:
Probability of hitting the target first = 1 / (1 + R)
Look carefully at that formula. It is the same formula as the break-even win rate. Identical.
That equality is the whole answer to this article’s question. With no edge, the win rate the market hands you is exactly the win rate you need to break even, at every single ratio. Expectancy is zero at 1:1, zero at 1:3, zero at 1:5. Widening the target lowers your hit rate by precisely the amount that the bigger winners make up for. The scales balance everywhere.
So there is no ratio that is good in itself. There is no setting of the target that manufactures an edge out of nothing. If somebody tells you a particular ratio is the reason they are profitable, they have not understood where their money is coming from.
Then Costs Arrive, and Nothing Is Neutral Any More
Zero expectancy is the version without costs. Real trades pay a spread, and often a commission, on the way in and the way out.
Suppose that round turn costs you one tenth of your stop distance, a cost of 0.10R. It is a modest assumption for gold. Recompute the break-even win rates with costs included, using (1 + c) / (1 + R):
- At 1:1, the break-even win rate rises from 50.0 to 55.0 percent
- At 1:2, from 33.3 to 36.7 percent
- At 1:3, from 25.0 to 27.5 percent
- At 1:5, from 16.7 to 18.3 percent
And if the market is still giving you the no edge hit rate, expectancy is now negative at every ratio, by the same amount: minus 0.10R per trade, whichever ratio you choose.
That is worth stating plainly. Without an edge, every reward to risk ratio loses money at exactly the same rate, and the rate is the cost. The ratio is not where the outcome is decided. Costs and edge are.
Get the free Gold Empire survival sheet, a one-page guide to protecting your account through the kind of market this article describes. One email, no spam, unsubscribe anytime.
So What Is the Ratio Actually For?
It is not useless. It is just not what people think it is. Three real jobs it does:
It sets the bar your method has to clear. Once you choose a ratio, the table tells you the win rate you must beat. That converts a vague hope into a testable claim. Trading 1:2 means claiming you can win more than 33.3 percent of the time, or 36.7 percent after costs. That claim can be checked.
It shapes what your equity curve feels like. Wide targets mean long stretches of small losses broken by occasional large wins. Narrow targets mean frequent small wins and occasional painful losses. Same expectancy, very different experience, and the experience matters because it determines whether you can actually keep following your own method.
It decides how much costs hurt. Look again at the cost table. At 1:1 the cost adds 5.0 points to your required win rate. At 1:5 it adds 1.7 points. That is the one genuine, structural advantage of wider targets, and it is far smaller than the folklore suggests. It is a cost efficiency, not an edge.
The Number You Should Actually Be Hunting
If the ratio does not decide the outcome, the win rate must, and that means the honest question is not what ratio to use but whether your win rate genuinely clears the bar your ratio sets.
That is a harder question, because win rates are noisy. Suppose you trade 1:2, so you need to beat 33.3 percent. How many trades before you can say with reasonable confidence that your real win rate is above that line, rather than a lucky sample?
Using a 95 percent confidence interval and requiring it to be no wider than five percentage points either side, the sample sizes come out as:
- At 1:1, about 385 trades
- At 1:2, about 342 trades
- At 1:3, about 289 trades
At two or three trades a day, that is somewhere between eight and twelve months of trading before the number means much. Which is an uncomfortable answer, and it is the true one. Most traders change their method every few weeks, on samples of thirty or forty trades, where the noise is far larger than any edge they might have.
Ratios are attractive precisely because they are the part you can set instantly, today, by dragging a line on a chart. The win rate takes months to learn about. That asymmetry is why so much attention goes to the half that matters less.
What to Do With This on Monday
Pick a ratio your method can actually support and that you can tolerate sitting through, then leave it alone long enough to learn something.
If your method takes trades at structure and gets stopped often, a wide target may leave you losing eight in a row routinely, and most people abandon a method long before its arithmetic gets a chance to work. If your method is right frequently but gives back gains, a narrow target has a real cost problem you should measure rather than assume.
Then record the pair, not the ratio: what you targeted, and how often it actually came in. A ratio without its win rate written next to it is not a record of anything. And the cost, which almost nobody logs, belongs in that record too, because it is the one number in this article that is certain.
Frequently Asked Questions
What is a good risk reward ratio, in one sentence?
There is no such thing on its own, because with no edge every ratio has the same expectancy; a ratio is only good or bad relative to the win rate your method actually achieves against it.
Is 1:3 better than 1:1?
Not inherently. At 1:3 you need to win 25.0 percent of the time and at 1:1 you need 50.0 percent, and under a no edge assumption those are exactly the rates you would get. The genuine difference is that costs weigh less heavily on wider targets, which is a small structural advantage rather than a reason to be profitable.
Should I avoid ratios below 1:1?
Not automatically, but understand the bar. At 1:0.5 you need to be right two times in three just to break even, before costs, and a small slip in your win rate does a lot of damage. Methods that work at those ratios exist, and they need a genuinely high and well measured hit rate to survive.
Why do so many people say 1:2 is the minimum?
It is a reasonable rule of thumb for a beginner, mostly because it discourages the habit of taking tiny profits while leaving losses to run, which is a behavioural problem rather than a mathematical one. As a claim about expectancy it does not hold up.
Does this mean risk reward ratios do not matter?
They matter for what they control: the bar your win rate has to clear, how your equity curve feels to sit through, and how much your costs bite. They do not create an edge, and treating them as though they do is what leaves people confused about why a disciplined 1:3 account still shrinks.
Where did the numbers in this article come from?
Every figure is computed from the formulas stated in the text, break-even win rate of 1/(1+R), the same expression for the no drift probability of touching the target first, and a standard sample size calculation at 95 percent confidence. The retail leverage and loss context comes from the ESMA measures linked below, which was checked live before publication. The individual investor figures are from Barber and Odean 2000, cited in full below, whose reference and DOI were verified against the Crossref record before quoting.
Where Gold Empire Fits
None of this is theoretical for me. The research on individual traders is not flattering, and it is worth reading rather than arguing with. Barber and Odean studied 66,465 households at a large discount broker between 1991 and 1996, and reported that the households which traded most earned an annual return of 11.4 percent while the market returned 17.9 percent. They attribute the high trading levels, and the underperformance that followed, to overconfidence. The paper is Brad M. Barber and Terrance Odean, Trading Is Hazardous to Your Wealth: The Common Stock Investment Performance of Individual Investors, The Journal of Finance, volume 55, issue 2, pages 773 to 806, published April 2000, DOI 10.1111/0022-1082.00226.
That study is about equities rather than gold, and about turnover rather than target placement, so do not stretch it further than it goes. What it does establish is where the damage tends to come from, and it is not from choosing the wrong ratio. On the leveraged retail side, ESMA’s product intervention measures of 27 March 2018 capped retail leverage on gold at 20:1 and required negative balance protection, introduced against a backdrop of most retail CFD accounts losing money.
Gold Empire is free to follow. Daily XAUUSD analysis with the reasoning stated before the trade rather than after it, on Telegram, and a free survival sheet for anyone who wants the capital protection material in one place. There is an optional Kit for people who want the whole method. No profit promises, and nothing here is a signal service.
If you want the rest of this thread: risk management in gold trading is the pillar this article sits under, how much to risk per trade covers the other half of the sizing decision, and position sizing for gold turns both into an order you can actually place. More about who writes this is on the author page.
About the author. Matthew writes Gold Empire. He spends most of his time on the unglamorous half of this business, the part concerned with still being here next year, and he has a particular impatience with rules that sound authoritative and have never been checked. Nothing in this article is a recommendation to trade, and no entry, stop or target discussed should be treated as a signal.
Disclaimer: This article is general educational content about reward to risk ratios and trade expectancy. It is not financial advice, not investment advice and not a recommendation to buy, sell or use any product, venue or firm. Trading leveraged products carries a substantial risk of loss and most retail accounts lose money. All figures are illustrative calculations from the stated assumptions, not predictions, and not claims about any past or future performance.
One step first
Where should we send the Gold Survival Sheet?
Leave your email and we will send the free one page checklist, then take you straight to the Telegram channel.
No cost and no obligation. Educational only, not financial advice, and nothing here promises a return. Unsubscribe any time in one click.