GOLD EMPIRESurvive First, Then Grow

Author: Matthew

  • Is It Better to Buy Physical Gold or Gold Stocks? What the Cost Line Does to Your Risk

    Is It Better to Buy Physical Gold or Gold Stocks? What the Cost Line Does to Your Risk

    The question is it better to buy physical gold or gold stocks gets asked as though the two things are the same asset in different packaging, one of them simply more convenient than the other. They are not. A bar of gold and a share in a gold mining company are different kinds of thing entirely, and the difference is not convenience or storage. It is that one of them has a cost line and the other does not.

    That single structural fact explains almost everything people find surprising about gold equities, including the part that catches out most newcomers, which is that a gold share can fall on a day when gold rises. If you understand where the cost line sits, that stops being a mystery and becomes arithmetic.

    What You Actually Own in Each Case

    Hold physical gold and you own a quantity of metal. Its value moves one for one with the price of that metal, less whatever you paid to acquire and store it. There is no management, no payroll, no diesel bill and no mine that might flood. There is also nothing that can turn a 10 per cent move in gold into a 30 per cent move in your position. What the metal does, you get.

    Hold a gold mining share and you own a slice of a business whose product happens to be gold. That business digs metal out of the ground at a cost, sells it at the prevailing price, and keeps the difference. You own the difference, not the metal. You also own everything else that comes with a company: the debt, the jurisdiction the mine sits in, the quality of the management, the share count, and the possibility that any of those change without the gold price moving at all.

    Gold Empire is mostly about leveraged trading rather than long term holding, so I want to be clear why this matters here. The reason is that traders who move from trading gold to owning gold equities usually assume they are taking less risk, because equities feel tamer than a leveraged position. On the numbers below, that assumption is frequently wrong, and it is wrong in a way that only shows up once you are holding it.
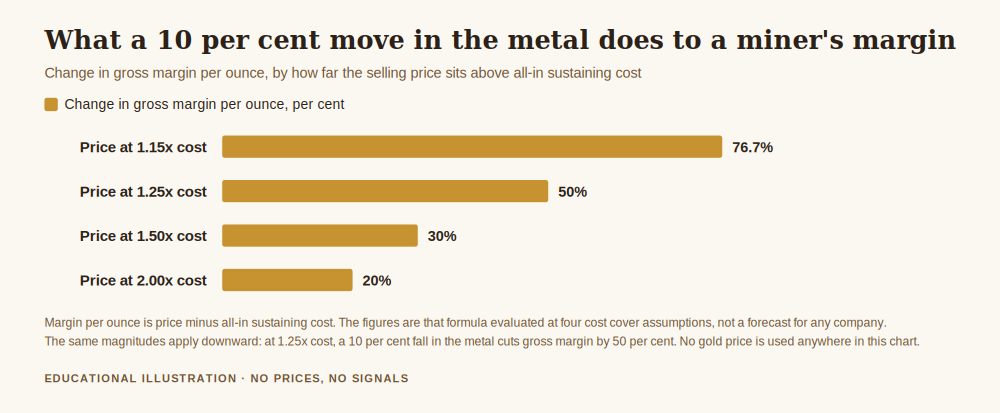
    Bar chart for the question is it better to buy physical gold or gold stocks, showing how much a miner's gross margin moves when the metal price moves 10 per cent
    Deciding whether it is better to buy physical gold or gold stocks starts here: how far the selling price sits above production cost decides how violently the margin reacts.

    The Cost Line, and Why the Industry Publishes It

    Mining companies report a standardised figure called all-in sustaining cost, usually shortened to AISC. It is designed, in the World Gold Council’s own words, to better reflect the full cost of keeping the mine in business, which means it includes not just digging the metal out but the ongoing capital needed to keep doing so next year.

    The World Gold Council publishes a quarterly series of the global average AISC of gold production, running from 2012 and updated alongside the Metals Focus Gold Mine Cost Service. You can see the all-in sustaining cost data on Goldhub directly, and the numbers in that series are worth reading slowly.

    In the first quarter of 2012, the global average AISC was US$926.78 an ounce. In the first quarter of 2026, the most recent quarter in the series as of 31 March 2026, it was US$1,785.49 an ounce. That is a rise of 92.7 per cent over fourteen years, a compound rate of 4.80 per cent a year. Narrow the window and it is sharper still: the first quarter of 2021 sat at US$1,058.59, so the cost of producing an ounce climbed 68.7 per cent in five years.

    Note what this figure is and is not. It is a cost of production, not a gold price, and nothing in this article quotes a gold price. But it is the number standing between the metal price and the shareholder, and it has been moving, upward, for over a decade.

    Is It Better to Buy Physical Gold or Gold Stocks for a 10 Per Cent Move?

    Now the arithmetic, and it needs no price level at all, only the relationship between the selling price and the cost.

    Suppose a producer sells its metal at some multiple of its all-in sustaining cost. Call that multiple m. Its gross margin per ounce is the price minus the cost, which is (m minus 1) times the cost. Now move the metal price by 10 per cent and ask what happens to that margin. The answer falls out of the formula: the margin changes by 0.1m divided by (m minus 1).

    Run it at four assumptions:

    • At a price 1.15 times cost, a margin of 13 per cent on revenue, a 10 per cent move in the metal moves the gross margin 76.7 per cent. An amplification of 7.7 times.
    • At 1.25 times cost, a 20 per cent margin, the move is 50 per cent. Amplification of 5 times.
    • At 1.50 times cost, a 33 per cent margin, the move is 30 per cent. Amplification of 3 times.
    • At 2.00 times cost, a 50 per cent margin, the move is 20 per cent. Amplification of 2 times.

    Two things are worth saying plainly about that table.

    The first is that this is exactly what leverage looks like, arriving through the income statement rather than through a margin account. A trader who would never open a five times leveraged position on gold may cheerfully buy a miner priced at 1.25 times its production cost, which delivers a similar amplification of the metal’s move into the thing they actually own. Nobody calls it leverage because no broker is lending anything. The mechanism is different, the arithmetic is not.

    The second is that it runs both ways, and this is where people get hurt. At 1.25 times cost, a 10 per cent fall in the metal cuts the gross margin by 50 per cent. The same producer, the same mine, the same tonnage, half the margin. The amplification is not a feature that only operates in your favour, and the tighter the margin, the more brutal the effect. A producer at 1.15 times cost loses 76.7 per cent of its gross margin on a 10 per cent decline in gold.

    The Costs Do Not Stand Still Either

    Here is the part the amplification table hides, because it treats cost as fixed while the price moves. Over any real holding period, it is not.

    Go back to the AISC series. A mine operating at the Q1 2012 global average that now operates at the Q1 2026 average would need its selling price to be 1.93 times what it was, just to hold the same absolute margin per ounce. Not to grow the margin. To stand still.

    The person holding physical metal has no equivalent line in their accounts. Their ounce did not get more expensive to produce, because they are not producing it. This is the structural asymmetry at the heart of the comparison, and it is why gold equities and gold do not track each other over long periods even though they are driven by the same commodity.

    Supply gives you a sense of how slowly the other side moves. In the second quarter of 2026, according to the World Gold Council’s Gold Demand Trends, mine production was 965.6 tonnes, up 2 per cent year on year. Mine output barely moves. A company cannot dig its way out of a cost problem at any speed that would help you.

    The Risks That Have Nothing to Do With Gold

    Everything above assumes the only thing that changes is the metal price and the cost of getting it out. A share carries more than that.

    It carries dilution, because a company that needs capital can issue more shares, and your claim on the margin gets smaller without the margin changing. It carries jurisdiction, because a mine sits in a specific country with specific tax and permitting rules that can be rewritten. It carries operational risk, because a single mine can flood, a grade can disappoint, a strike can stop production. It carries the equity market itself, which means that on the day everything falls together, your gold exposure can fall with it because it is priced in a stock market rather than a metals market.

    None of these are arguments against owning gold equities. They are arguments against owning them while believing you own gold. Those are different positions with different failure modes, and the failure mode is the thing I care about.

    So Which One

    The honest answer is that they do different jobs, and the question is what job you want done.

    If the job is to hold a store of value that moves with the metal and cannot be diluted, mismanaged or nationalised out from under you, that is what physical gold does, and paying storage is the price of that property. If the job is to take a geared position on the gold price with the gearing supplied by a business rather than a broker, that is what a gold equity does, and the amplification table above is the specification you are buying, in both directions.

    What neither of them is, is the other one with better logistics. The most expensive version of this decision is the one made by somebody who wanted the first job done and bought the second thing because it was easier to buy.

    Free gold survival sheet

    Get the free Gold Empire survival sheet, a one-page guide to working out what a position actually exposes you to before you take it. One email, no spam, unsubscribe anytime.

    Get the free survival sheet →

    Frequently Asked Questions

    Is it better to buy physical gold or gold stocks if I want exposure to the gold price?
    Physical tracks the metal one for one. A gold equity gives you an amplified, two way version of the same move, and the amplification depends on how far the selling price sits above production cost. At 1.25 times cost, a 10 per cent move in gold becomes a 50 per cent move in gross margin, upward or downward.

    Why do gold stocks sometimes fall when gold rises?
    Because you own the margin, not the metal, and the margin has two sides. Costs can rise faster than the price, a company can dilute, a mine can underperform, and the whole equity market can drag a share down regardless of what the commodity did that day.

    Are gold miners a form of leverage?
    In effect, yes, though nobody is lending you anything. The gearing comes from the gap between price and production cost rather than from a margin account. The arithmetic looks very similar, and it is worth treating the position with the same caution you would give any geared exposure.

    Does a rising all-in sustaining cost mean miners are a bad investment?
    Not on its own, because the selling price moves too. It does mean the margin is a moving target rather than a fixed property of the business, and that a company standing still on cost control is falling behind. The global average AISC rose 92.7 per cent between the first quarter of 2012 and the first quarter of 2026.

    Where did the numbers in this article come from?
    The all-in sustaining cost figures are from the World Gold Council’s quarterly AISC series on Goldhub, as at 31 March 2026, and the mine production figure is from its Gold Demand Trends for the second quarter of 2026. Both are linked above. The amplification percentages are the formula 0.1m divided by m minus 1, evaluated at four stated assumptions about how far the selling price sits above cost. They illustrate a relationship and are not a forecast for any company. No gold price level is quoted anywhere in this article.

    Where Gold Empire Fits

    Gold Empire is free to follow. Daily XAU/USD analysis on Telegram, with the reasoning stated before the trade rather than after it, losing days included. There is a free survival sheet for anyone who wants the capital protection material in one place, and an optional Kit for people who want the full method. Nothing here promises a profit and nothing here is a signal service.

    The pillar this sits under is risk management for gold trading, the wrapper comparison is in gold ETF vs physical gold returns, and the failure mode of a geared position is covered in gold CFD vs physical gold. More about who writes this is on the about page.

    About the author. Matthew writes Gold Empire and spends most of his attention on the boring mechanics that decide whether an account is still open in two years. He has a long standing habit of reading cost disclosures before price charts, on the grounds that the cost line is the part nobody puts in the marketing. Nothing in this article is a recommendation to trade, and no entry, stop or target discussed should be treated as a signal.


    Disclaimer: This article is general educational content about the structural differences between holding physical gold and holding shares in gold mining companies. It is not financial advice, not investment advice and not a recommendation to buy, sell or hold any instrument, product or company. Production costs, company accounts and tax rules change, so verify current details with primary sources before acting. Figures are taken from the stated public sources or are simple arithmetic on clearly stated assumptions, not predictions or performance claims. Trading leveraged products carries a substantial risk of loss and most retail accounts lose money.


  • How to Withdraw Profits From Forex Account, and Why Most Traders Never Do

    How to Withdraw Profits From Forex Account, and Why Most Traders Never Do

    Nobody opens a trading account in order to look at a number. They open it because they want the number to turn into something: a repaired roof, a holiday, a year of school fees, a phone they have been eyeing since the summer. Yet the question of how to withdraw profits from forex account balances is one of the least discussed subjects in this industry, and I think that is not an accident. The withdrawal is the moment the abstraction ends, and a lot of people have quietly arranged their trading so that moment never arrives.

    I want to treat this as two separate problems, because they get tangled. The first is mechanical: which buttons, how long, what the broker will ask for. The second is a policy problem, and it is the one that decides whether you ever hold any of this money. I will spend most of the article on the second, because the first is easy and the second is where accounts are lost.

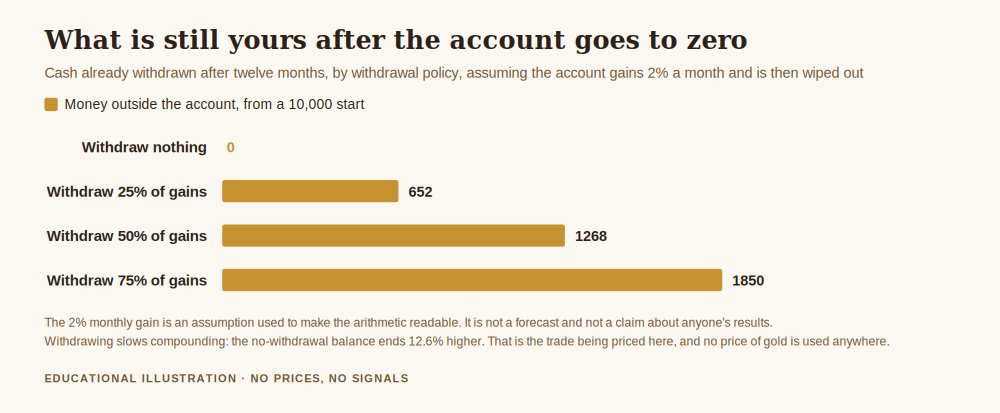
    Chart for how to withdraw profits from forex account, showing how much money sits outside the account after twelve months under four withdrawal policies
    How to withdraw profits from forex account balances is really a policy question, and this is the arithmetic of the policy.

    How to Withdraw Profits From Forex Account Balances, the Mechanical Part

    The rule that governs almost everything here is that the money goes back the way it came. Anti money laundering regulation pushes brokers to return funds to the original source, so a deposit by card is usually refunded to that card up to the amount deposited, and only the surplus goes out by bank transfer or to whatever e-wallet you used. This surprises people who expect to nominate any account they like, and it is the single most common reason a first withdrawal takes longer than expected.

    Before the first withdrawal, the broker will want identity documents and proof of address, and possibly proof of the payment instrument. Do this on the day you open the account rather than on the day you want the money, because verification is the step that adds days. You will also want to check your own arithmetic on fees: some brokers absorb the transfer cost, some do not, and an intermediary bank can take a cut of an international transfer that neither you nor the broker controls. For the timing side of all this, I wrote about how long a forex withdrawal takes separately.

    One thing worth doing on your very first withdrawal, whatever the size of the account: make it small. Send a token amount through the whole pipeline while nothing is at stake. You find out whether the name on your bank account matches the name on the trading account closely enough, whether your documents pass, and how long the chain really takes. Finding that out with a small sum is free. Finding it out when you urgently need the money is not.

    What a Withdrawal Actually Buys, in Arithmetic

    Here is the part I have never seen anyone write down, so let me put numbers on it. Take an account of 10,000 units and suppose, purely as an assumption to make the arithmetic readable, that it grows 2 per cent a month for twelve months. I want to be exact about the status of that number: it is an assumption chosen to make a comparison legible. It is not a forecast, not a target, and not a claim that anyone achieves it. Most retail accounts lose money, and there is a figure for that further down.

    Now compare four policies. Withdraw nothing. Withdraw 25 per cent of each month’s gain. Withdraw 50 per cent. Withdraw 75 per cent. After twelve months, the balances come out at 12,682, 11,956, 11,268 and 10,617 respectively, and the cash sitting outside the account is 0, 652, 1,268 and 1,850.

    Look at the cost of withdrawing first, honestly, because it is real. The trader who withdrew nothing finishes with a balance 12.6 per cent higher than the one who withdrew half of every gain. Compounding is not a myth, and taking money out of the machine slows the machine. Anyone who tells you withdrawing is free is selling something.

    Now add the event that the industry prefers not to model. Suppose that at the end of the twelfth month, the account balance goes to zero. A bad week with size on, a gap through a stop, a platform you should not have trusted, a margin close out. At that moment the trader who withdrew nothing has 0, and the trader who withdrew half of each month’s gain has 1,268, because that money stopped being exposed the day it left.

    You can find the break even point between those two policies. If you assign a probability to the account being wiped out at the end of the period, the two policies have the same expected value when that probability is 10.3 per cent. Below that, not withdrawing wins on expectation. Above it, withdrawing half of every gain wins. So the real question is not whether you believe in compounding. It is whether you think the chance of losing an entire retail trading account over twelve months is higher or lower than about one in ten.

    I know what I think, and I suspect you do too.

    Why Most Traders Never Withdraw Anything

    The usual explanation is greed. I have not found that to be true. The people I have watched never take money out for three quieter reasons.

    The first is that the balance has become a scoreboard. Withdrawing makes the number go down, and if the number is how you are keeping score, a withdrawal feels like a loss even though it is the only part of this activity that is unambiguously a gain. The fix is to keep two numbers: the balance, and a separate running total of everything you have ever taken out. The second number only ever rises, and once it exists, withdrawals start to feel like progress rather than subtraction.

    The second is that every sum looks small compared to what it could become if it stayed. This is the trap that makes the withdrawal permanently premature. There is no balance at which this feeling goes away by itself, because the argument scales with the account. The only cure is a rule that does not consult your feelings.

    The third is that withdrawing forces you to admit the number is real. While the money stays inside, gains are provisional, and so are losses. The day you send a sum to your bank account, the activity acquires a result you cannot revise. Quite a lot of people would rather not know, which is also why the same people do not track their trades properly.

    The Other Reason the Money Never Leaves

    There is a version of this problem that has nothing to do with your psychology, and everyone who trades online should know the shape of it.

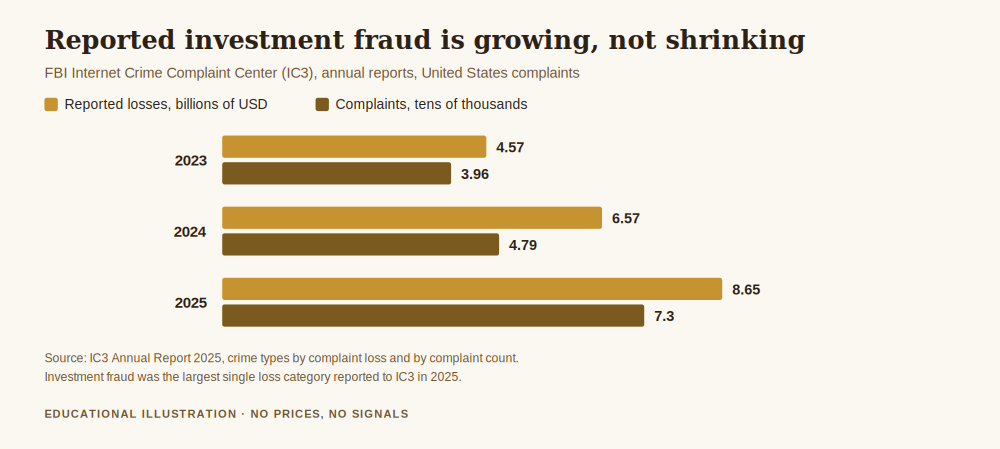
    The FBI’s Internet Crime Complaint Center publishes an annual report, and the 2024 edition records 859,532 complaints and a reported total of 16.6 billion dollars in losses, an increase of 33 per cent on the previous year. Investment fraud was the single largest category by money lost, with 47,919 complaints accounting for 6,570,639,864 dollars. Readers who trade gold might note the separate line for gold courier scams, 525 complaints and 219 million dollars, where criminals send couriers to collect cash and precious metals from victims in person.

    The mechanism inside a large share of the investment fraud figure is described in the report itself. In cryptocurrency investment fraud, the confidence scheme often called pig butchering, victims are coached to invest more and more money into what appears to be an extremely profitable platform, only to be unable to withdraw their funds. That last clause is the entire con. The platform shows gains, the dashboard is convincing, the support agent is friendly, and the withdrawal never completes. Under Operation Level Up, the FBI notified 4,323 victims of cryptocurrency investment fraud, and reported that 76 per cent of them did not know they were being scammed, with estimated savings to victims of 285,639,989 dollars.

    Draw the practical lesson from that. A small early withdrawal is not only a test of your own discipline, it is the cheapest possible test of whether the firm holding your money will actually give it back. A platform that makes depositing effortless and withdrawing complicated has told you something important, and it has told you while the sum at risk is still small. Run that test before the balance is worth defending, and check the firm’s registration with its regulator before you deposit at all.

    A Withdrawal Policy You Can Actually Keep

    A policy beats an intention because it does not require you to feel like withdrawing on the day. Four elements are enough.

    Set a fixed share of gains, not a fixed sum. A share scales with what the account produces and it removes the negotiation. If the month produced nothing, the policy costs you nothing, which is what makes it survivable in a flat stretch.

    Attach it to a date, not to a feeling or a milestone. The first business day of the month is ideal, because the alternative, withdrawing when it feels like enough, is exactly the feeling that never arrives.

    Send it somewhere with friction. A separate savings account that takes two days to reach is better than one you can sweep back in thirty seconds. The point of the withdrawal is that the money is no longer exposed to a decision you might make on a Thursday afternoon.

    Write down the share and review it twice a year. Not monthly, because monthly review is just the negotiation again with extra steps. If the account has grown enough that your share now takes out more than you want, change the number deliberately, in writing, in a calm week.

    None of this requires you to be a better person than you are. That is the entire design goal.

    What This Article Does Not Say

    It does not say the gains are coming. The 2 per cent monthly figure above is a stated assumption used to compare four policies against each other, and every number in that comparison changes if you change the assumption. The relationship between the policies is the durable part, not the balances.

    It is worth keeping the base rate in view. When the European Securities and Markets Authority restricted contracts for difference for retail clients, it published the evidence behind that decision, including national regulator findings that between 74 and 89 per cent of retail accounts typically lose money, with average losses per client running from around 1,600 to 29,000 euro. The ESMA announcement sets out the whole package. Most people reading this will not face the pleasant problem of deciding how much to withdraw. For the minority who do, the decision arrives quietly and is usually postponed.

    And it does not say withdrawing is free. It costs you compounding, measurably, and the arithmetic above prices that cost rather than hiding it. What it buys is the one thing a trading account cannot give you: money that a future bad week cannot reach.

    Free gold survival sheet

    Get the free Gold Empire survival sheet, a one-page guide to protecting your account, including the withdrawal policy described in this article. One email, no spam, unsubscribe anytime.

    Get the free survival sheet →

    Frequently Asked Questions

    How much of my profits should I withdraw?
    There is no universal figure, and anyone quoting one is guessing about your circumstances. What the arithmetic above shows is the shape of the trade: withdrawing half of each month’s gain leaves the balance 12.6 per cent lower after a year under the stated assumption, and leaves a meaningful sum beyond the reach of a bad week. Pick a share you can hold to for a year, write it down, and review it in six months.

    Will withdrawing ruin my compounding?
    It slows it, measurably, and the figures above quantify that rather than dismissing it. Whether the slowdown is worth paying for depends entirely on how likely you think a total loss of the account is. At a probability above roughly one in ten over a year, withdrawing half of each gain comes out ahead on expectation under these assumptions.

    Why is my broker sending money back to my card instead of my bank?
    Because anti money laundering rules generally require funds to return by the route they arrived, up to the amount originally deposited. Only the surplus above your deposits typically goes out by another method. It is a compliance requirement rather than an obstruction.

    What if a platform refuses to process my withdrawal?
    Treat it as the most serious warning sign there is. Being unable to withdraw is the defining feature of the investment fraud described in the IC3 report linked above, which recorded 6.57 billion dollars of investment fraud losses in 2024. Stop depositing immediately, keep all records, contact the firm’s regulator and file a complaint with the relevant national authority.

    Where did the numbers in this article come from?
    The balances, the withdrawn totals, the 12.6 per cent gap and the 10.3 per cent break even probability are arithmetic on one stated assumption, 2 per cent a month for twelve months from a 10,000 start, and you can reproduce them in a few lines of code. The fraud figures are quoted directly from the FBI IC3 2024 annual report and the regulatory figures from the ESMA announcement, both linked above. No gold price appears anywhere in this article.

    Where Gold Empire Fits

    Gold Empire is free to follow. Daily XAU/USD analysis on Telegram, with the reasoning stated before the trade rather than after it, losing days included. There is a free survival sheet for anyone who wants the capital protection material in one place, and an optional Kit for people who want the full method. Nothing here promises a profit and nothing here is a signal service.

    The pillar this sits under is risk management for gold trading, the account setup groundwork is in how to open a gold trading account, and the funding side is covered in the best way to fund a brokerage account. More about who writes this is on the about page.

    About the author. Matthew writes Gold Empire and spends most of his attention on the boring mechanics that decide whether an account is still open in two years. He has taken small withdrawals from every account he has ever run, mostly because he once watched a very good year become a rounding error in a single week and decided he would rather be slightly poorer on paper. Nothing in this article is a recommendation to trade, and no entry, stop or target discussed should be treated as a signal.


    Disclaimer: This article is general educational content about account administration, withdrawal mechanics and risk policy in retail trading. It is not financial advice, not investment advice, not tax advice and not a recommendation to buy, sell or hold any instrument, product or firm. Broker terms, payment rules and verification requirements differ by firm and by jurisdiction, so check your own broker’s current terms and your own tax obligations before acting. The growth figures used are stated assumptions for arithmetic, not predictions or performance claims. Trading leveraged products carries a substantial risk of loss and most retail accounts lose money.


  • Gold Futures vs XAUUSD Chart: Why the Two Charts Never Quite Match

    Gold Futures vs XAUUSD Chart: Why the Two Charts Never Quite Match

    Open a gold futures vs XAUUSD chart side by side and the first thing you notice is that they look almost identical. The second thing, if you look for another minute, is that they are not. The shapes agree, the turning points agree, but the candles do not line up, the sessions start and stop in different places, and every so often one of them has a gap that the other does not. Traders usually assume one of the two is wrong. Neither is. They are two different instruments that happen to track the same metal.

    This matters more than a chart curiosity, because the difference decides what you are actually holding, what it costs you to hold it, and who you are holding it with. I want to walk through the mechanics in the order they affect your account.

    Two Markets, One Metal

    The futures side lives on an exchange. COMEX lists a gold contract and that contract is a standardised, fixed lump of metal. You can see exactly how big it is in a source neither your broker nor I control: the US Commodity Futures Trading Commission publishes a weekly Commitments of Traders report, and the COMEX section of it labels each market with its contract size on the line above the data.

    In the report covering positions as of 15 September 2026, the entry reads GOLD, COMMODITY EXCHANGE INC., contracts of 100 troy ounces, with open interest of 409,899 contracts. Directly beneath it sits MICRO GOLD, contracts of 10 troy ounces, with open interest of 90,365. You can read the COMEX Commitments of Traders report yourself, and it will have moved on by the time you do, which is rather the point of using it.

    The spot side lives somewhere else entirely. XAUUSD as you see it in a retail terminal is not an exchange product. It is a contract for difference or a spot position quoted by your broker, priced off the over the counter loco London market, where gold has traded between banks for a very long time without any central exchange at all.

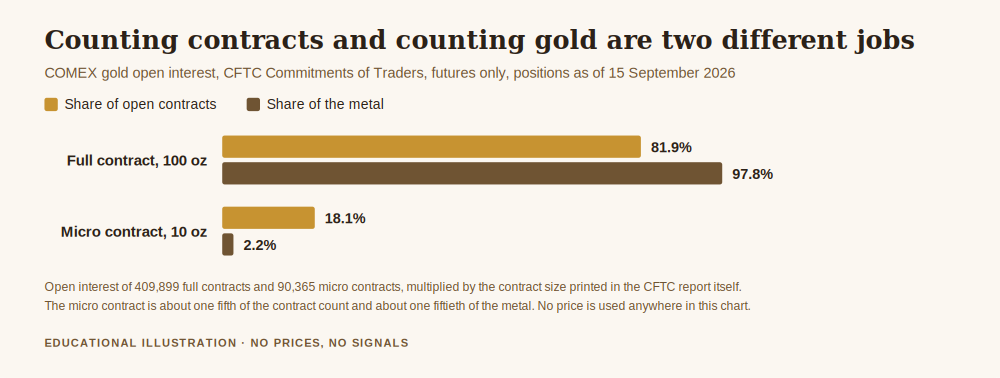
    Bar chart for gold futures vs XAUUSD chart comparison, showing COMEX full and micro gold contracts by share of open contracts and share of the metal
    Reading a gold futures vs XAUUSD chart starts with knowing what one unit of each actually is. Counting contracts and counting metal give very different answers.

    The Arithmetic That Makes the Two Comparable

    Here is the part that makes the comparison concrete, and it needs no price at all.

    One COMEX gold contract is 100 troy ounces. One standard lot of XAUUSD is also 100 troy ounces. So a single standard lot in your retail terminal carries the same quantity of metal as one full exchange contract. That is a fact worth sitting with if you have been treating a standard lot as a normal starting size.

    Work down the scale. One standard lot equals ten micro gold contracts. A 0.01 lot, the smallest size many brokers allow, is one troy ounce, which is a tenth of a single micro contract. The retail market slices the metal far finer than the exchange does, and that is genuinely the main practical advantage of the spot side.

    The open interest figures show how that plays out. Micro contracts are 18.1 per cent of all open COMEX gold contracts, which sounds like a substantial share of the market. Converted to metal, using the contract sizes printed in the same report, the full contracts account for 40,989,900 ounces and the micros for 903,650. The micro contract is therefore 2.2 per cent of the gold. Counting contracts and counting metal are two different jobs, and confusing them is how people talk themselves into believing a market is smaller or more retail than it is.

    Why the Charts Do Not Line Up

    Four mechanical differences produce almost every visible discrepancy between the two charts.

    The futures chart is stitched together. A futures contract expires. The chart you are looking at, if it runs back further than a few months, is a continuous series assembled from a sequence of contracts, each handed over to the next at some roll date. Every handover can leave a step in the series that never happened to anyone holding a position. Spot XAUUSD has no expiry, so its chart has no rolls and no stitches.

    The cost of time is expressed differently. Because a futures contract has a delivery date, the cost of holding metal over time is baked into the price of the contract itself. On the spot side the same economics arrive as a financing charge applied to your position, which is why an overnight XAUUSD position is debited or credited while the chart price carries no equivalent adjustment. We cover that mechanism in what is swap in gold trading.

    Settlement is a different animal. Spot loco London settles two good UK business days after the trade, per ICE Benchmark Administration, which administers the LBMA Gold Price. A futures contract settles at its delivery date, potentially months away. Two instruments with different settlement horizons are not obliged to print the same price at the same moment.

    The clocks are different. The exchange has a defined session with a defined daily break. The over the counter market has trading hours defined by banks in different time zones handing the book around. On top of that, the LBMA Gold Price runs auctions twice each business day, at 10:30 and 15:00 London time, with price formation in US dollars, as described by ICE Benchmark Administration and by the LBMA itself. That is ten benchmark auction moments in a normal working week which sit inside the over the counter market and have no equivalent on the futures chart.

    Why Most Retail Accounts End Up on the Spot Side Anyway

    Given that the exchange product is centrally cleared and transparently specified, it is fair to ask why almost every retail gold trader ends up on the spot side instead. There are three honest reasons and none of them is that one product is better.

    The first is granularity, which we have already covered. The exchange sells metal in lumps of 100 ounces, or 10 for the micro. If your risk budget on a single idea is small, the smallest exchange lump may already be too large to be sized sensibly, whereas a 0.01 lot of one troy ounce almost certainly is not.

    The second is access. A futures account is a different product from a retail spot account, with different paperwork, different minimums and a different relationship to margin. Plenty of traders never look at the futures side simply because the spot account was the one in front of them.

    The third is the absence of expiry. A spot position can be held indefinitely, subject to financing, while a futures position has a date on it and must be closed or rolled. For somebody holding a view over weeks rather than hours, not having to manage a roll is a real convenience, even though the cost of time has not disappeared, it has only changed its address.

    The flip side of those three conveniences is the counterparty point below, and it is a genuine trade, not a free lunch. Exchange clearing is something you give up in exchange for granularity and ease of access.

    What Your Gold Futures vs XAUUSD Chart Comparison Should Change

    Three practical consequences, in order of how much money they touch.

    First, the counterparty question. A COMEX position is cleared through the exchange clearing house. A retail XAUUSD position is a contract with your broker, which means your broker’s solvency and conduct are part of your risk, not an afterthought. That is not an argument against the spot side. It is an argument for choosing the firm carefully, which is what choosing a broker for gold trading is about.

    Second, the sizing question. If one standard lot is one full exchange contract, then the difference between 0.01 and 1.00 in the volume box is a factor of one hundred in metal. The fine granularity of the retail market is a genuine gift for risk control, and it is also the thing that lets somebody place an exchange sized position by accident in a terminal that makes it feel like a small number. The mechanics of translating that into an actual risk figure are in how to calculate lot size for gold forex.

    Third, the data question. If you analyse on one chart and execute on the other, your levels are drawn from a series that your fills will not exactly respect. The gaps you see on a stitched futures chart are not gaps your spot position can trade through, and the session boundaries differ. Analyse on the instrument you trade, or at minimum know which of the two you are looking at.

    Free gold survival sheet

    Get the free Gold Empire survival sheet, a one page guide to protecting your account, including the contract size arithmetic that decides how big a standard lot really is. One email, no spam, unsubscribe anytime.

    Get the free survival sheet →

    Frequently Asked Questions

    Is XAUUSD the same as gold futures?
    No. XAUUSD in a retail terminal is a spot or contract for difference position with your broker, priced off the over the counter loco London market. Gold futures are standardised exchange contracts with expiry dates, cleared centrally. They track the same metal closely, which is why the charts look alike, but the instrument, the counterparty, the expiry and the way the cost of time is charged are all different.

    Which chart shows the real gold price?
    Both show a real price for a real instrument, and neither is the single official price of gold. If you want a published benchmark rather than a live quote, the LBMA Gold Price is set by auction twice each business day at 10:30 and 15:00 London time and is published by ICE Benchmark Administration.

    Why does my broker’s gold chart differ from the futures chart I see elsewhere?
    Usually some combination of four things: the futures series is stitched across contract rolls, the two instruments have different settlement horizons, the cost of holding time sits inside the futures price but arrives as a financing charge on the spot side, and the trading sessions do not share the same boundaries. Quote source differences add a little more on top.

    How much gold is in one standard lot?
    One hundred troy ounces, the same quantity as one full COMEX gold contract as labelled in the CFTC report. One micro gold contract is ten troy ounces, and a 0.01 lot is one troy ounce.

    Where did the numbers in this article come from?
    The contract sizes and the open interest figures are taken directly from the CFTC Commitments of Traders report for COMEX, futures only, positions as of 15 September 2026, and that report is linked above. The percentage shares are simple multiplication of those two published figures, open interest multiplied by the contract size printed on the same line. The auction times and the settlement convention come from ICE Benchmark Administration. No price level is quoted anywhere in this article.

    Where Gold Empire Fits

    Gold Empire is free to follow. Daily XAU/USD analysis on Telegram, with the reasoning stated before the trade rather than after it, losing days included. There is a free survival sheet for anyone who wants the capital protection material in one place, and an optional Kit for people who want the full method. Nothing here promises a profit and nothing here is a signal service.

    The pillar this sits under is risk management for gold trading, the definition work is in what is spot gold meaning, and the leverage that turns a hundred ounce position into a small looking number is covered in what is leverage in gold trading. More about who writes this is on the about page.

    About the author. Matthew writes Gold Empire and spends most of his attention on the boring mechanics that decide whether an account is still open in two years. He has a long standing habit of reading contract specifications before charts, which makes him poor company at trading meetups and has saved him more money than any indicator. Nothing in this article is a recommendation to trade, and no entry, stop or target discussed should be treated as a signal.


    Disclaimer: This article is general educational content about market structure, contract specifications and instrument differences in gold trading. It is not financial advice, not investment advice and not a recommendation to buy, sell or hold any instrument, product or firm. Contract specifications and broker terms change, so verify current details with the exchange and with your own broker before acting. Figures are taken from the stated public sources or are simple arithmetic on them, not predictions or performance claims. Trading leveraged products carries a substantial risk of loss and most retail accounts lose money.


  • How to Set Price Alerts on MT5, and Where to Actually Put Them

    How to Set Price Alerts on MT5, and Where to Actually Put Them

    Learning how to set price alerts on mt5 takes about ninety seconds. Learning why it matters takes rather longer, because the feature looks like a convenience and is actually a piece of risk control. An alert is the difference between a trader who checks the market when something has happened, and a trader who sits in front of a chart for six hours so that nothing can happen without being watched. The second one is not more diligent. He is just more tired, and tired accounts make expensive decisions.

    This article covers the mechanics, which are simple, and then the part almost nobody does, which is working out where the alert should actually sit. That second question has a measurable answer, so rather than guess, we will use the published London gold benchmark and count.

    How to Set Price Alerts on MT5, the Ninety Second Version

    The alerts panel lives in the Toolbox at the bottom of the MetaTrader 5 window. If the Toolbox is hidden, View then Toolbox brings it back, or Ctrl+T does the same thing. Along the bottom of that panel is a row of tabs, and one of them is Alerts.

    Right click anywhere inside the Alerts tab and choose Create. A small dialog opens with the fields that matter:

    • Action. What the platform does when the condition is met. Sound, file, mail or notification. Notification is the one that reaches your phone.
    • Symbol. The instrument the alert watches. On most gold accounts this is XAUUSD, though brokers name it differently, so take the name from Market Watch rather than typing what you expect it to be.
    • Condition. Bid above, Bid below, Ask above, Ask below, or Time equals. Gold spreads can be wide, so it is worth being deliberate about whether you are watching Bid or Ask.
    • Value. The level. This is the field this article is really about.
    • Expiration. When the alert stops being valid. Leave this at the default and you will collect dead alerts for levels that stopped being interesting weeks ago.
    • Maximum iterations and timeout. How many times it may fire and how long it waits between firings. One iteration is usually right. Five is how you teach yourself to ignore your own alerts.

    For the alert to reach your phone, the desktop platform needs your MetaQuotes ID, which appears in the Messages tab of the mobile app under settings, and gets pasted into Tools, Options, Notifications on the desktop. MetaQuotes documents the whole notification path on its own trade alerts page, including the point that the platform will notify you by sound, email or push so that you do not have to spend hours watching price movement on a monitor.

    One caveat that costs people real money: desktop alerts are evaluated by the desktop terminal. If the machine is asleep, the terminal is closed, or the connection has dropped, the alert does not fire and nothing tells you it did not. If an alert genuinely has to fire while you are away from the computer, it needs to live somewhere that stays awake, which in practice means a phone app alert, a broker side alert, or a hosted terminal.

    Where to Put the Alert, Measured Rather Than Guessed

    Here is where most guidance stops and mine starts. An alert is only useful if it fires rarely enough to mean something and often enough to be worth setting. That is an empirical question, and gold has a public record that answers it.

    The London Bullion Market Association runs the auction that sets the world benchmark price for gold and publishes the entire history free. Taking the afternoon auction from 4 January 2000 to 18 September 2026 gives 6,698 consecutive sessions. For every one of them, I asked a simple question: if you had set an alert a given distance away from that day’s benchmark, in either direction, would it have fired within the next five sessions, meaning roughly one working week?

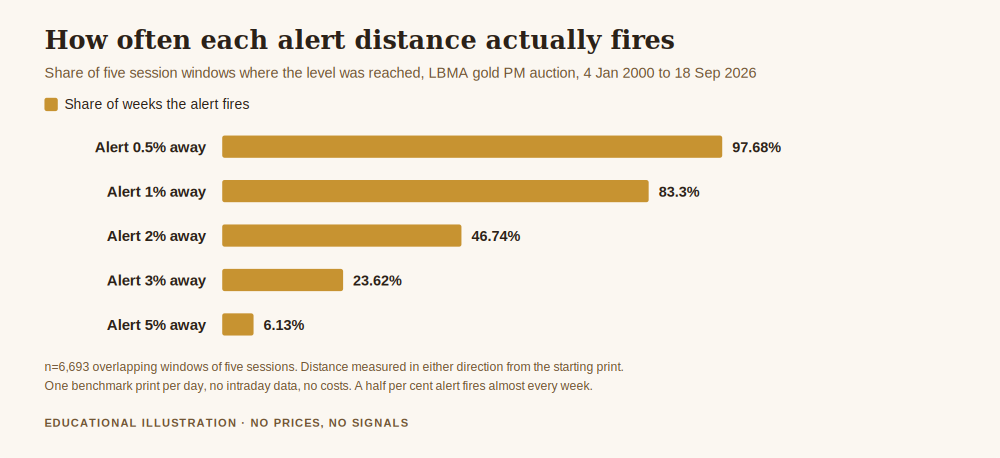
    The answer, counted across 6,693 overlapping five session windows:

    Chart showing how often each alert distance fires within a week, the core of how to set price alerts on mt5
    How often each alert distance fires within one working week, which is the number that should decide how to set price alerts on mt5.

    An alert placed half a percent away fired in 97.68 per cent of weeks. That is not an alert, that is a metronome. Gold moves through half a percent almost every week of its life, and a notification that arrives with that reliability trains you to swipe it away without reading it, which is worse than having no alert at all.

    One per cent away fired in 83.30 per cent of weeks, and when it fired, the median wait was two sessions. Two per cent away fired in 46.74 per cent of weeks, so slightly less often than a coin. Three per cent fired in 23.62 per cent, roughly one week in four. Five per cent fired in 6.13 per cent of weeks, about three times a year.

    For context on the scale, the typical single session moved 0.547 per cent from the previous benchmark, with a mean of 0.767 per cent, and there were 251 benchmark sessions in 2025. Method, so you can repeat it: one benchmark print per day, no intraday data, distance measured in either direction from the starting print, five forward sessions per window, overlapping windows, no costs, no spread, no absolute price quoted anywhere in this article.

    What Those Percentages Actually Tell You to Do

    Read the numbers as a budget for your own attention. If you set alerts at half a percent on a handful of instruments, you have signed up for several notifications a week that say nothing except that the market is open. Within a month you will stop looking at them. The alert has not failed. Your relationship with the alert has failed, and it took your trust in the whole system with it.

    Set alerts at two or three per cent instead and each notification carries information, because something has happened that does not happen most weeks. The cost is that you will sometimes wait a fortnight for one. That waiting is the product, not a defect of it.

    This is the same reasoning behind every rule in risk management for gold trading. You are deciding in advance which events deserve a reaction, and building a machine that ignores everything else on your behalf, because you will not reliably ignore it yourself at four in the afternoon on a slow Thursday.

    Four Alerts Worth Having

    These are categories rather than instructions. The levels are yours, and they should come from your own plan, not from a number in an article.

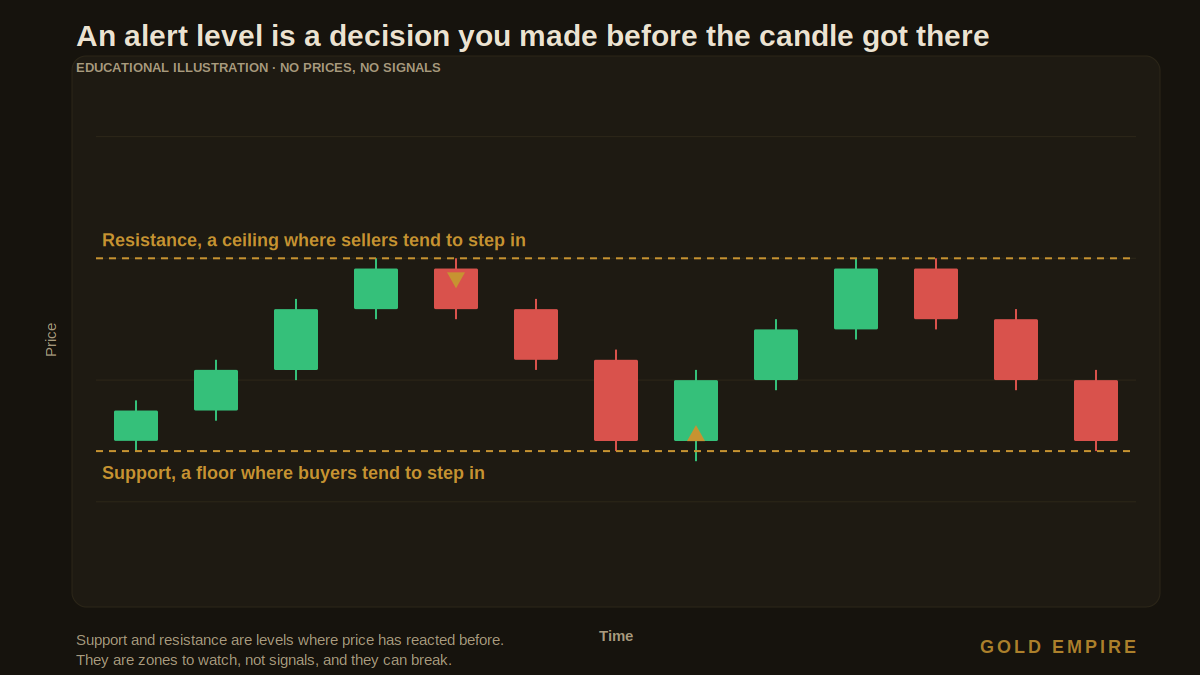
    Candle illustration of the support and resistance levels where you would set price alerts on mt5
    Levels the market has already reacted to are the usual home for an alert, which is the practical half of how to set price alerts on mt5.

    The level you already decided matters. If your analysis says a particular area is the one that would change your mind, that is an alert. Writing it into the platform converts an opinion into something the computer will remember after you have gone to bed and after you have talked yourself into a different story.

    The level that says you were wrong. Traders set alerts for the price they are hoping for and almost never for the price that invalidates the idea. The second one is the one that protects capital. If you hold a position and the market reaching a certain area would mean the reason for the trade no longer exists, that deserves a notification at least as much as the happy case.

    The time alert before a scheduled event. The Time equals condition is the least used field in the dialog. A notification fifteen minutes before a release you care about is a reminder to check your exposure while you still have a choice about it, rather than discovering it as the spread widens.

    The alert on the instrument you are not in. The whole purpose of this feature is that you can be absent. If you want to be in gold only when a particular condition appears, an alert lets you close the platform and live your life until that condition appears. People who watch a market they are not trading end up trading it.

    And one worth deleting: any alert you have snoozed twice. If you have dismissed it without acting, the level does not mean what you thought it meant when you set it. Remove it rather than leaving it to erode your attention.

    The Real Problem an Alert Solves

    I am going to be blunt about the mechanism, because it is not really a software feature at all.

    The account damage caused by screen watching is not caused by watching. It is caused by what watching leads to. A trader who is present for every tick will eventually see a move that was not in his plan, feel the pull of it, and take a position that his written rules would never have authorised. He did not abandon his method. He was just in the room when the opportunity walked past, and being in the room is most of what it takes.

    An alert removes you from the room. You are not fighting the impulse with willpower, you are arranging your day so the impulse never gets a chance to speak. That is the same design principle as a written risk limit, and it works for the same reason: rules that enforce themselves beat rules that need you to be disciplined at precisely the moment you are least able to be.

    It is also why the two or three per cent alert beats the half per cent one on more than statistical grounds. A notification you receive twice a month is an event. A notification you receive daily is wallpaper.

    What an Alert Cannot Do

    An MT5 alert is a message. It is not an order, it does not size anything, it does not close anything, and it has no opinion about whether reacting is wise. If your plan requires an action to happen at a level whether or not you are awake, that is a pending order or a stop, and the alert is at best a courtesy copy.

    It also cannot make a bad level into a good one. An alert on a number you invented while feeling impatient will fire exactly as reliably as an alert on a number you derived from your analysis, which is why the level deserves more thought than the dialog box does. If you are still building the analysis that produces those levels, reading a gold chart with a clear head is the prerequisite, and adding XAUUSD in MT5 covers the step before this one if gold is not yet in your Market Watch.

    Finally, an alert will not fire on a market that is closed. Gold does not trade continuously, weekend closures exist, and a level reached while the market was shut is a level you meet on Monday at whatever the market thinks by then. That is a gap risk problem, not an alerts problem, and no notification setting solves it.

    Free gold survival sheet

    Get the free Gold Empire survival sheet, a one-page guide to protecting your account through the kind of market this article describes. One email, no spam, unsubscribe anytime.

    Get the free survival sheet →

    Frequently asked questions

    Do MT5 price alerts work when the platform is closed?

    Desktop alerts do not. They are evaluated by the terminal on your computer, so if the machine is asleep or the platform is shut, the condition can be met without anything happening, and you will not be told afterwards. Alerts set inside the mobile app, or on a platform running on a hosted server, keep working while your computer does not.

    How many price alerts should I have running at once?

    Few enough that each one still makes you look. There is no technical limit worth worrying about, but there is an attention limit, and the measurement above shows how quickly you hit it: alerts set close to the current price fire in the great majority of weeks, and a notification stream that reliable stops being read.

    Should the alert watch Bid or Ask?

    Match it to what you would actually do. A level that matters for a buy is reached at the Ask, and a level that matters for a sell is reached at the Bid. On an instrument with a wide spread the two can be meaningfully far apart, so choosing by habit rather than by purpose will fire the alert slightly early or slightly late every time.

    Is a price alert a substitute for a stop loss?

    No, and treating it as one is a genuinely dangerous swap. A stop is an instruction sitting with the broker that executes without you. An alert is a message that requires you to be awake, holding your phone, and willing to act. Those are not the same protection.

    Why does my alert fire and then fire again immediately?

    Because maximum iterations is above one and the timeout is short. Price hovering around the level re-triggers the condition. Set iterations to one for a level you only need to hear about once, and use the timeout for the cases where you genuinely want a repeat.

    Where Gold Empire Fits

    Gold Empire is free to follow. Daily XAU/USD analysis on Telegram, with the reasoning stated before the trade rather than after it, losing days included. There is a free survival sheet for anyone who wants the capital protection material in one place, and an optional Kit for people who want the full method. Nothing here promises a profit and nothing here is a signal service.

    The pillar this sits under is risk management for gold trading, the number the alert is supposed to protect is covered in how much to risk per trade, and the platform groundwork is in how to add XAUUSD in MT5. The benchmark data behind every percentage above is published by the London Bullion Market Association, and the raw file used is the published PM auction history. More about who writes this is on the about page.

    About the author. Matthew writes Gold Empire and spends most of his attention on the boring mechanics that decide whether an account is still open in two years. He is suspicious of any setup that requires him to be at a desk, on the grounds that the desk has taken more money from him than the market ever has. Nothing in this article is a recommendation to trade, and no entry, stop or target discussed should be treated as a signal.


    Disclaimer: This article is general educational content about platform features, notifications and attention management in retail trading. It is not financial advice, not investment advice and not a recommendation to buy, sell or hold any instrument, product or firm. Platform behaviour varies by broker and by version, so verify settings in your own terminal. Figures are calculations from the stated public data and stated assumptions, not predictions or performance claims. Trading leveraged products carries a substantial risk of loss and most retail accounts lose money.


  • How to Trade in Gold Options: What the Contract Charges Before You Are Right

    How to Trade in Gold Options: What the Contract Charges Before You Are Right

    Sooner or later someone in a chat group mentions options, usually in the same breath as the words limited risk, and the question arrives: how to trade in gold options, and is it safer than what I am doing now. It is a fair question and it has a real answer, but the answer is not on the buy side of the screen. It is in the arithmetic of what the contract charges you before you are right about anything.

    Here is the short version so nobody has to read three thousand words to understand the shape of it. You pay a fee up front for the right, not the obligation, to trade gold at a fixed price by a fixed date. If gold does not move far enough in your direction before that date, the fee is gone. Your maximum loss is known on the day you buy. So is the fact that the most likely outcome is losing all of it.

    The part worth staying for is the other side of the trade, the one where somebody sells you that right. That side has no known maximum loss at all, and it is the side that retail accounts wander into by accident when a platform makes it look like collecting income.

    How to Trade in Gold Options, the Mechanical Part

    Start with the vocabulary, taken from the regulator rather than from a course, because the definitions are precise and the marketing versions are not. The US Commodity Futures Trading Commission publishes a full glossary of these terms, and it is worth reading in the original.

    • The premium is, in the CFTC’s words, “the payment an option buyer makes to the option writer for granting an option contract.” It is paid at the start and it is not refundable.
    • The exercise price, also called the strike price, is “the price, specified in the option contract, at which the underlying futures contract, security, or commodity will move from seller to buyer.”
    • The expiration date is “the date on which an option contract automatically expires.” After it the contract is worth its intrinsic value, or nothing.
    • The option writer is “the person who originates an option contract by promising to perform a certain obligation in return for the price or premium of the option.”

    Note the asymmetry in that last definition. The buyer has a right. The writer has a promise to perform.

    From those four pieces you get four possible positions. Buy a call, the right to buy gold at the strike, which pays if gold rises far enough. Buy a put, the right to sell at the strike, which pays if gold falls far enough. Or write either of those, collect the premium, and take on the promise.

    Where they trade matters more than most beginners realise. Exchange-listed gold options are options on gold futures contracts, cleared by a central counterparty, with published contract sizes and standardised terms. Everything else is a bilateral arrangement with whoever is on the other side of your account, which makes the counterparty part of the risk. Find out which of the two you are being offered before anything else.

    The Price of the Ticket, Measured

    An option’s price is not arbitrary. You can get close to it with public data and a page of arithmetic, which means you can check whether what you are being quoted is roughly sane before you pay it.

    The dominant input is volatility, so start there. Taking the London Bullion Market Association’s published gold benchmark history and measuring the daily variation of the benchmark from January 2000 to September 2026, across 6,674 observations, gold’s realised annualised volatility works out at 17.42 per cent. Over the most recent ten years it was 16.06 per cent, over five years 17.98 per cent, over three years 20.27 per cent, and over the last twelve months 27.66 per cent. The metal has been considerably livelier lately than its own long-run average.

    Feeding the long-run 17.42 per cent figure into the standard option pricing formula, with the assumptions written out below, gives the cost of a call as a percentage of the gold price:

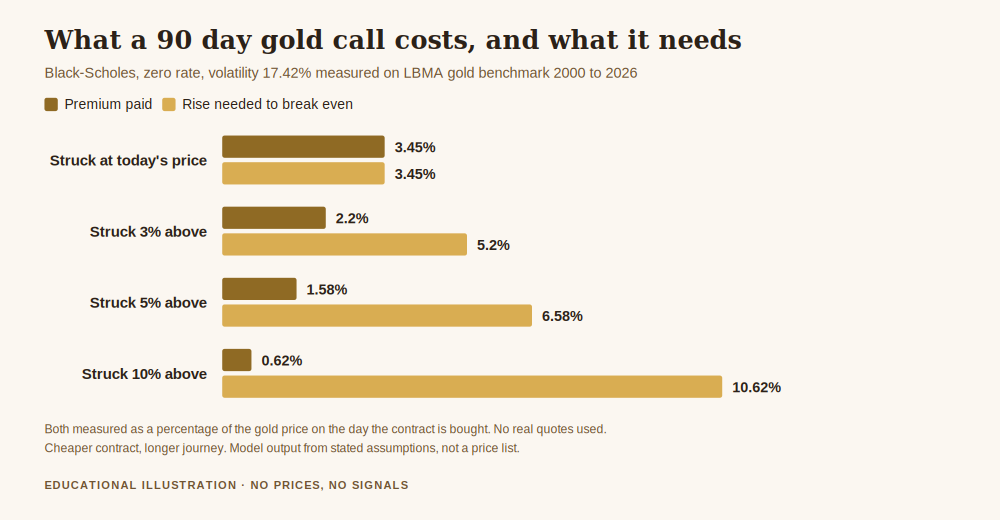
    • A call struck at today’s price, expiring in 30 days, costs about 1.99 per cent of the gold price. At 90 days, 3.45 per cent. At a year, 6.94 per cent.
    • A call struck 5 per cent above today’s price costs about 0.45 per cent at 30 days, 1.58 per cent at 90 days, and 4.89 per cent at a year.
    • A call struck 10 per cent above costs about 0.06 per cent at 30 days and 0.62 per cent at 90 days.

    The assumptions, stated openly because a number without its assumptions is a decoration: the Black-Scholes formula, a zero interest rate, no storage or lease costs, constant volatility, and price movements that follow a log-normal distribution. Real option markets have none of those things exactly. Real quotes also carry a bid-ask spread, and the far out-of-the-money contracts in the list above have the widest ones relative to their value. Treat these as the shape of the cost, not as a price list.

    The Number That Decides Everything

    Now combine the two halves, because this is the calculation almost nobody does before buying their first option.

    A call only pays at expiry if gold finishes above the strike. But you did not get the strike for free, you paid a premium for it. So the price at which you actually begin to make money is the strike plus the premium, and the move required is both of those added together.

    On the 90 day contracts priced above:

    • Struck at today’s price: premium 3.45 per cent, so gold must rise 3.45 per cent just to get your money back. Probability of finishing above that, on the same model: 33.17 per cent.
    • Struck 3 per cent above: premium 2.20 per cent, so the required rise is 5.20 per cent. Probability: 26.44 per cent.
    • Struck 5 per cent above: premium 1.58 per cent, required rise 6.58 per cent. Probability: 21.76 per cent.
    • Struck 10 per cent above: premium 0.62 per cent, required rise 10.62 per cent. Probability: 11.31 per cent.
    Chart showing how to trade in gold options, comparing the premium paid with the move gold must make before a 90 day call breaks even
    How to trade in gold options, in one picture: the cheaper the contract, the further gold has to travel before it repays you.

    Read the shape rather than the individual numbers. The cheap-looking contracts are cheap because they are unlikely to pay. The far out-of-the-money call, the one usually described as a lottery ticket, costs a tenth as much as the one struck at today’s price and needs three times the move. That is not a bargain, that is the price being approximately right.

    Note also what this does to a trader used to spot gold. On a normal position you can be roughly right about direction and slightly wrong about timing and still end up fine. On a bought option you can be exactly right about direction, watch gold rise two per cent, and lose every penny because the contract expired on a Friday and the move happened the following Tuesday.

    Time Is the Other Side of the Trade

    The CFTC glossary calls it time decay: “the tendency of an option to decline in value as the expiration date approaches, especially if the price of the underlying instrument is exhibiting low volatility.”

    Put numbers on it. Take that 90 day call struck at today’s price, and hold gold perfectly still. What is left of your premium as the clock runs?

    • With 60 days to go: 81.66 per cent of what you paid.
    • With 45 days to go, the halfway point: 70.7 per cent.
    • With 30 days to go: 57.75 per cent.
    • With 7 days to go: 27.90 per cent.
    • With 1 day to go: 10.54 per cent.

    Half the calendar gone, roughly seventy per cent of the value left, and then it falls off a cliff. Nothing has to go wrong for that to happen. The market does not have to move against you. Standing still is enough, and standing still is what markets mostly do.

    Free gold survival sheet

    Get the free Gold Empire survival sheet, a one-page guide to protecting your account through exactly the kind of decision this article describes, including how to state your maximum loss in money before you click anything. One email, no spam, unsubscribe anytime.

    Get the free survival sheet →

    The Side That Can Take More Than You Put Up

    Everything above is the buyer’s side, where the worst case is losing the premium. Now the other side, because this is where accounts actually die.

    The CFTC defines a naked option as “the sale of a call or put option without holding an equal and opposite position in the underlying instrument.” You collect the premium up front. In exchange you have promised to perform, and if gold runs, your obligation grows with it, without a ceiling.

    Here is that in numbers, using the same model and the same public price history. Sell a 30 day call struck 5 per cent above the market and you collect about 0.45 per cent of the gold price. Now look at what gold has actually done. Across every 30 calendar day window from 2000 to September 2026, the largest rise was 23.75 per cent, from 30 December 2025 to 29 January 2026, with 22.26 per cent in 2006 and 21.57 per cent during September and October 2008 close behind.

    Meet the biggest of those while short that call and you owe 18.75 per cent of the gold price against the 0.45 per cent you collected. That is 42.1 times your income on a single contract, and it did not happen in the distant past. It happened this year.

    And it is not a freak. Of all 6,679 thirty day windows in the sample, 18.16 per cent saw gold rise more than 5 per cent. Nearly one in five. The strategy that looks like collecting rent works most of the time, which is precisely why people scale it up, and then one window in the tail removes more than every premium collected before it.

    If you take nothing else from this article, take this: buying an option and writing one are not two variations of the same trade. They are opposite risk shapes wearing the same name. A platform that offers both behind the same button is not doing you a favour.

    What This Does Not Say

    It does not quote a price for any gold option. Every figure here is a model output from stated assumptions, produced to show the shape of the cost, and real quotes will differ, sometimes materially.

    It does not say the model is right. Black-Scholes with constant volatility and zero rates is a simplification. Real markets price a volatility skew, real gold has fatter tails than the log-normal distribution, and those fat tails make the sold-option case worse than the arithmetic above, not better. Where the model is wrong, it is wrong in the direction of understating the danger of writing.

    It does not predict anything, and it does not tell you to trade options or not to. Measuring the last twenty-six years describes the past, and the 23.75 per cent window is a reminder that the historical maximum was set recently rather than a forecast. What this article gives you is what the contract charges before you are right, which is information you are entitled to have before you decide.

    Five Questions to Answer Before You Trade a Gold Option

    None of these are about direction. They are the questions that decide whether a loss is survivable.

    • Is it exchange-listed and centrally cleared, or is my counterparty the firm holding my money? If it is the second, the counterparty is part of the risk.
    • What is one contract worth in my currency? Not in per cent, in money. If you cannot state the figure, you cannot size the position.
    • What is the bid-ask spread as a share of the premium? On a contract costing 0.62 per cent of the gold price, a spread worth a tenth of the premium is a large cost before anything else happens.
    • Am I buying or writing, and what is my maximum loss? If you are writing, there is no maximum, and you need to know how your broker will close you out. Leverage in gold trading covers why that close-out arrives sooner than people expect.
    • Does this instrument fix a problem I actually have? Accounts rarely blow up for lack of a second instrument. They do so for the reasons in why you keep blowing your trading account, none of which are solved by adding complexity.

    Frequently Asked Questions

    How to trade in gold options as a complete beginner?
    The honest answer is that this is the wrong first instrument. An option adds a second variable, time, to a trade you are already trying to get right on direction and size. If direction and size are not yet reliable, adding a clock does not help.

    Are gold options safer than spot gold or CFDs?
    A bought option has a known maximum loss, which is genuinely different from a leveraged spot position. A written option has no maximum loss at all. So the instrument is not safer or riskier; the side you take is what decides that.

    Why did my option lose money when gold went my way?
    Almost always time decay, sometimes a fall in priced volatility. Gold has to move far enough, and soon enough. The 90 day at-the-money contract above needs a 3.45 per cent rise simply to return the premium.

    Is selling options a reliable income strategy?
    It produces small regular receipts and rare very large payments out. On this data, 18.16 per cent of 30 day windows saw gold rise more than 5 per cent, and the worst rose 23.75 per cent, which is 42.1 times the premium a 5 per cent out-of-the-money writer would have collected. Frequency of winning is not the same as expectancy.

    Where did the numbers in this article come from?
    Volatility, the 30 day windows and the historical maximum rise were calculated from the published LBMA gold auction history linked below, downloaded before publication. Premiums, break-even moves, probabilities and decay were computed with the Black-Scholes formula under the assumptions stated in the text. The definitions are quoted from the CFTC glossary linked above. None of it is a price quote, a forecast or a performance claim.

    Where Gold Empire Fits

    Gold Empire is free to follow. Daily XAU/USD analysis on Telegram, with the reasoning stated before the trade rather than after it, losing days included. There is a free survival sheet for anyone who wants the capital protection material in one place, and an optional Kit for people who want the full method. Nothing here promises a profit and nothing here is a signal service.

    A new instrument is a risk decision before it is anything else. Risk management for gold trading is the pillar this article sits under, how much to risk per trade is the arithmetic that decides whether any of this is survivable, and the difference between gold and gold futures covers the instrument these options are usually written on. The price history comes from the London Bullion Market Association price record. More about who writes this is on the about page.

    About the author. Matthew writes Gold Empire and spends most of his attention on the boring mechanics that decide whether an account is still open in two years. He has watched more than one trader discover that the side of an option trade they were on was not the side they thought. Nothing in this article is a recommendation to trade, and no entry, stop or target discussed should be treated as a signal.


    Disclaimer: This article is general educational content about derivative instruments, option pricing mechanics and risk in retail trading. It is not financial advice, not investment advice and not a recommendation to buy, sell, write or use any product, contract, platform or firm. Availability of gold options, contract specifications, tax treatment and regulatory protections vary by jurisdiction and change over time, and current terms should be checked with your own broker and with the sources linked in the text. Options can expire worthless and writing options can produce losses greater than the premium received and greater than the capital in the account. Trading leveraged products carries a substantial risk of loss and most retail accounts lose money. Figures are calculations from the stated public data and stated assumptions, not predictions or performance claims.


  • EURUSD vs Gold Correlation: The Second Position You Did Not Know You Had

    EURUSD vs Gold Correlation: The Second Position You Did Not Know You Had

    Most traders find out about the eurusd vs gold correlation in the worst possible way: two positions in the account, sized as though they were two separate bets, and a single bad afternoon that takes both of them out together. The trade ticket said gold. The other trade ticket said EURUSD. The loss behaved as though there had only ever been one position, in slightly larger size than you would have chosen if anybody had asked you directly.

    This is a survival problem rather than a strategy problem, which is why it sits here rather than in a chart-reading article. Nobody blows an account by being wrong once. People blow accounts by being wrong once in three places at the same time, having budgeted for being wrong once in one place.

    So rather than repeat the usual line about gold and the dollar being inversely related, this article measures it, on a public data set anyone can download, and then does the arithmetic on what the measurement means for the size of your positions.

    The EURUSD vs Gold Correlation, Measured on 6,946 Days

    The London Bullion Market Association runs the auction that sets the global benchmark price for gold, and it publishes the full history of that auction free of charge. The record goes back to 1968 in dollars, and from 4 January 1999, the first business day of the euro, it also carries the same auction converted into euros. That is the useful part.

    Because each day gives the same ounce of gold priced in both currencies, dividing one by the other recovers the exchange rate used at the moment the auction settled. No second data source, no vendor feed, no assumptions about what time anybody’s day closed. One file, one moment in the day, two currencies.

    Running that from 5 January 1999 to 16 September 2026 gives 6,946 consecutive daily observations. Comparing the daily log change in the dollar gold price against the daily log change in that implied EURUSD rate produces a correlation of +0.3946.

    Split it and it stays stubbornly in the same place. The last ten years measure +0.3988. The last five measure +0.3629. Taken one calendar year at a time, from 1999 through to the incomplete 2026, the correlation is positive in all 28 years without exception, ranging from a nearly invisible +0.009 in the euro’s first year to +0.741 in 2004. There is not a single year in the record where gold and the euro pulled against each other on balance.

    That last point matters more than the headline number. A relationship that averages +0.39 but flips sign every few years is a curiosity. A relationship that has never once closed a year negative in twenty-eight tries is a structural feature of the thing you are trading, and you should size around it.

    What a Correlation of 0.39 Actually Says

    It is worth being precise here, because correlation is the most over-claimed number in retail trading.

    Squaring it gives 0.156. In plain terms, about 15.6 per cent of gold’s day-to-day variation moves together with the euro, and roughly 84 per cent of it does not. Gold is not a proxy for the euro. Anybody who tells you the two are the same trade is overselling it by a wide margin.

    Day by day, the two moved in the same direction on 4,542 of the 6,946 days, which is 65.4 per cent of the time. A coin would have given you 50. So the tilt is real, it is modest, and on any individual day it tells you close to nothing. If you were hoping for a trade signal, this is not one, and treating it as one would be a misuse of the number.

    The reason to care is not prediction. It is accounting. You are not trying to forecast tomorrow. You are trying to work out how much risk is actually in your account right now, and a mild positive relationship between two positions changes that total quietly, without ever showing up on either trade ticket.

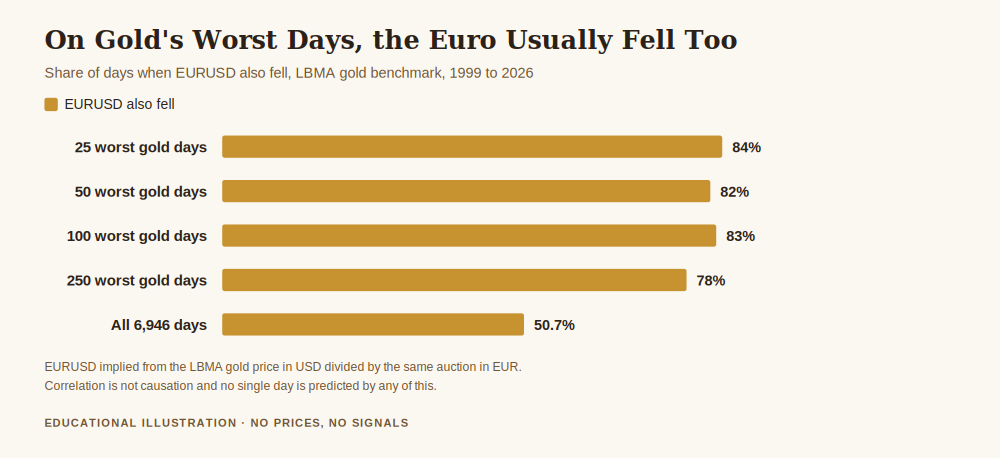
    Chart of the eurusd vs gold correlation in the tail, showing that on the 25 worst days for gold the euro also fell 84 per cent of the time
    The eurusd vs gold correlation matters most on the days you can least afford it: the worst days for gold are the days the euro is most likely to be falling too.

    The Average Is Not Where the Damage Is

    Here is the part that the headline correlation hides, and the reason a mild-sounding 0.39 is worth an article.

    Take the 25 worst days for gold in the whole 6,946-day record and ask what EURUSD did on those same days. It fell on 21 of them, 84 per cent. Widen it to the 50 worst days and the answer is 82 per cent. The 100 worst, 83 per cent. The 250 worst, still 78 per cent.

    Against that, on all 6,946 days taken together, EURUSD fell on 50.7 per cent. Essentially a coin toss.

    So on an ordinary day, knowing gold is down tells you almost nothing about the euro. On the worst days of the last twenty-seven years, it tells you a great deal. The relationship tightens exactly when your account is already under pressure, which is the single worst behaviour a relationship between two of your positions can have.

    This is not unique to gold and the euro. It is the general and unpleasant habit of correlations under stress, and it is why risk that looks diversified in calm conditions so often turns out not to be on the day it counts. The average across all days is the number that comforts you. The tail is the number that empties the account.

    What This Does to Your Position Sizing

    Now the arithmetic, which is simple enough to do on paper.

    Suppose you hold two positions, each sized to risk the same amount, and suppose you have quietly assumed they are independent. Under that assumption, the combined risk is not double a single position. It is the square root of two, about 1.41 times one position, and that is precisely why diversification is worth having in the first place.

    Feed the measured relationship in instead. The standard formula for combining two positions is the square root of the first variance plus the second variance plus twice the correlation times both standard deviations. With equal sizes and a correlation of 0.3946, that gives 1.67 times one position, not 1.41.

    Which means you are carrying about 18.1 per cent more risk than your independence assumption told you. Not catastrophic. Not nothing either. If your rule is 1 per cent of the account per trade and you are running the two together, your real exposure on that pair is closer to 1.18 per cent of what you thought, every time, silently, forever.

    For reference, if the two were perfectly correlated the combined figure would be 2.0, exactly the same as doubling one position. At zero it would be 1.41. At 0.39 you are roughly a third of the way from honest diversification toward simply trading larger.

    The fix is not to refuse to hold both. The fix is to know the number and adjust the size deliberately rather than discover it afterwards. Our note on how much to risk per trade sets the per-trade budget, and position sizing for gold turns that budget into lots. Correlation is the step people skip between the two, and it is the step that decides whether the budget you wrote down is the budget you are actually running.

    Long Gold and Long Euro Is Closer to One Trade Than Two

    Why the two should be related at all is not mysterious. Gold is quoted in dollars. The euro is quoted in dollars. When the dollar weakens against everything, the dollar price of gold tends to rise and EURUSD tends to rise, because the common term in both is the dollar and it is the one that moved. That is a mechanical link before it is an economic one.

    You can see the mechanical part in the volatility. Priced in dollars, gold’s daily moves over this period annualise to about 17.40 per cent. Priced in euros, the same ounce of the same metal annualises to about 16.16 per cent, roughly 7 per cent calmer, purely because part of what looks like gold moving is the dollar moving underneath it.

    Which gives you a cleaner way to phrase the position you are holding. Buying gold in dollars is partly a view on gold and partly a short dollar position you did not consciously open. Adding a long EURUSD on top is adding a second short dollar position. Two tickets, one underlying opinion, sized as though there were two opinions. Our piece on what moves the price of gold walks through the other drivers that make up the remaining 84 per cent.

    What This Argument Is Not

    It is not a claim that gold and the euro move together. They move together a bit, most of the time, and more reliably when things are bad.

    It is not a hedging instruction. Nothing here says to offset one position with the other, and the numbers above do not support any such rule.

    It is not a forecast. A correlation computed over twenty-seven years describes what has happened. Relationships between assets do change, sometimes quickly, and the fact that this one has been positive in every calendar year since 1999 is evidence about the past rather than a guarantee about next Tuesday.

    It is not causation either. The dollar explanation above is a plausible mechanism and a common one, and a measured correlation cannot prove a mechanism on its own.

    Free gold survival sheet

    Get the free Gold Empire survival sheet, a one-page guide to protecting your account through the kind of market this article describes, including the combined-risk arithmetic used above. One email, no spam, unsubscribe anytime.

    Get the free survival sheet →

    Four Things to Check Before You Hold Both

    Count the dollar, not the tickets. Write down every open position and mark which ones are, underneath, a view on the dollar. If more than one is, you have fewer independent bets than lines in your terminal.

    Size the pair, not each leg. If your ceiling is 2 per cent across the book, do not put 1 per cent on gold and 1 per cent on EURUSD and call it done. At the measured relationship that pair behaves like about 1.18 per cent on a single view, so decide whether you want that much.

    Assume the relationship tightens when it hurts. Plan for the tail figure, not the average. The number that matters on a bad day is 84 per cent, not 39.

    Recompute it yourself occasionally. The file is public and the calculation takes a few minutes. A relationship you measured in 2019 is not evidence about the account you are running today.

    Frequently asked questions

    What is the eurusd vs gold correlation, in one number?
    Measured on 6,946 daily observations of the LBMA gold benchmark from January 1999 to September 2026, the correlation between the daily change in dollar gold and the daily change in the implied EURUSD rate is +0.3946. It has been positive in every one of the 28 calendar years in that record.

    Does that mean gold goes up when the euro goes up?
    More often than not, and not reliably. The two moved in the same direction on 65.4 per cent of days, against 50 per cent for a coin toss. On any single day the relationship is far too weak to trade on, which is why this article treats it as a sizing input rather than a signal.

    Is gold just a short dollar position?
    Partly. About 15.6 per cent of gold’s daily variation moves with the euro, so roughly 84 per cent of what gold does has nothing to do with the dollar leg. The same ounce priced in euros is about 7 per cent less volatile than priced in dollars, which is one way of seeing how much of gold’s apparent movement is currency.

    Should I stop holding gold and EURUSD at the same time?
    This article does not tell you what to hold. It tells you that two equally sized positions at this correlation carry about 18.1 per cent more combined risk than they would if they were independent, so that you can set the size knowing that rather than finding out during a bad week.

    Why use the LBMA auction instead of a broker’s chart?
    Because it is a single published benchmark, set at one moment in the day, available in both dollars and euros from the same source, and free for anyone to download and re-check. A broker feed differs between brokers and cannot be audited by a reader.

    Where did the figures in this article come from?
    All of them are computed from the LBMA gold price history linked above, checked live before publication. The method: take the PM auction in dollars and in euros, derive the implied EURUSD rate by dividing one by the other, take natural log changes between consecutive auction days, and compute Pearson correlations over the stated windows. The combined-risk figures use the standard two-asset formula with equal position sizes. The annualised volatility figures use the standard deviation of daily log returns multiplied by the square root of 252. Assumptions are stated rather than hidden, and none of this is a price quote, a forecast or a performance claim.

    Where Gold Empire Fits

    Gold Empire is free to follow. Daily XAU/USD analysis on Telegram, with the reasoning stated before the trade rather than after it, losing days included. There is a free survival sheet for anyone who wants the capital protection material in one place, and an optional Kit for people who want the full method. Nothing here promises a profit and nothing here is a signal service.

    Knowing how much risk is really in the account is the whole job. Risk management for gold trading is the pillar this article sits under, how much to risk per trade sets the budget this arithmetic spends, and what moves the price of gold covers the drivers that the dollar leg does not explain. The underlying data is published by the London Bullion Market Association, and the raw auction history used here is the published PM auction file. More about who writes this is on the about page.

    About the author. Matthew writes Gold Empire and spends most of his attention on the boring mechanics that decide whether an account is still open in two years. He has a long-standing suspicion of any account that looks diversified on the screen and behaves like one position on the statement. Nothing in this article is a recommendation to trade, and no entry, stop or target discussed should be treated as a signal.


    Disclaimer: This article is general educational content about correlation, position sizing and portfolio risk in retail trading. It is not financial advice, not investment advice and not a recommendation to buy, sell or hold any instrument, product or firm. Statistical relationships between markets change over time and past measurement is not a guide to future behaviour. Trading leveraged products carries a substantial risk of loss and most retail accounts lose money. Figures are calculations from the stated public data and stated assumptions, not predictions or performance claims.


  • How to Sell Gold on MetaTrader 5, and the Button That Costs People Accounts

    How to Sell Gold on MetaTrader 5, and the Button That Costs People Accounts

    There is a version of this question that the manuals answer in four lines, and a version that costs people real money. The first is mechanical: which button, which box, which number. The second is the one nobody warns you about, and it is why how to sell gold on metatrader 5 is worth more than four lines of explanation.

    Here is the short version, so nobody has to read three thousand words to place a trade. Open the Market Watch, find your gold symbol, press New Order, set the volume, press Sell by Market. That is the whole mechanical answer, and if that is all you came for, you can stop reading.

    The part worth staying for is this. On MetaTrader 5, pressing Sell while you already hold a buy position does not always do what you think it does. On some accounts it closes your position. On other accounts it opens a second one, in the opposite direction, and leaves the first exactly where it was. Same platform, same button, opposite outcome, and which one you get was decided by your broker before you ever logged in.

    How to Sell Gold on MetaTrader 5, the Mechanical Part

    Assuming the symbol is already in your Market Watch, and if it is not then adding XAU/USD in MT5 is the first job, there are three routes to a sell order and they all reach the same place.

    • Right-click the symbol in Market Watch and choose New Order. The order window opens with that symbol preselected.
    • Press F9 from anywhere in the terminal. Faster, and it uses whichever chart is focused, which is exactly why it is also the way people place orders on the wrong instrument.
    • Use the one-click trading panel in the top-left corner of the chart, if your broker has it enabled. Fastest, and the least forgiving, because there is no confirmation step between your finger and the market.

    In the order window you set four things. The symbol, which you should read rather than assume. The volume, in lots. The order type, which is Market Execution for an immediate fill and Pending Order if you want it to trigger later at a level. Then you press Sell, which sits on the left and is usually red.

    A market sell fills at the bid, and the difference between bid and ask is the spread, which you have now paid. A pending sell comes in two flavours that people confuse constantly: a Sell Limit sits above the current price and triggers if price rises into it, a Sell Stop sits below and triggers if price falls through it. If that distinction is not automatic yet, the buy-side version of the same logic explains the geometry properly.

    That is the mechanics, and none of it is the hard part. The hard part is what happens on the second press.

    Sell Does Not Mean Close, and That Is Where Accounts Get Hurt

    Picture the ordinary sequence. You are long gold. The trade goes against you. You decide to get out. You look at the terminal, you see a Sell button, and selling is obviously the opposite of buying, so you press it.

    On some accounts you are now flat, which is what you wanted. On others you are now long and short at the same time, in the same instrument, for the same volume. Your net exposure is zero, so the loss stops growing, which feels like it worked. It did not work. Your original loss is still sitting there, frozen at whatever it was, and you now own two positions instead of none, both of which still cost you money to carry and both of which you will eventually have to close.

    Traders call the second outcome a lock, or a hedge. Sometimes it is done deliberately. Far more often it is done by someone who thought Sell meant close, and the difference between those two situations is entirely a matter of whether you knew which kind of account you were on.

    Netting or Hedging: Your Broker Already Chose for You

    MetaTrader 5 has two position accounting systems, and the official documentation is unusually direct about it. As the MetaTrader 5 trading help puts it, “the system used depends on the account and is set by the broker.” You do not choose it from a menu. You inherit it.

    On a netting account, the documentation states that when “a deal is executed in the opposite direction, the volume of the existing position can be decreased, the position can be closed (when the deal volume is equal to the position volume) or reversed (if the volume of the opposite deal is greater than the current position).” So on a netting account, selling the exact volume you are long does close you out. Selling more than that flips you short, which is its own surprise if you were not expecting it.

    On a hedging account, the same documentation says that if “you have an open position for a symbol, and execute a new deal (or a pending order triggers), a new position is additionally opened. Your current position does not change.” That is the lock. Your losing trade is untouched, and a second trade now sits beside it.

    Most retail forex and gold brokers hand out hedging accounts, because MetaTrader 4 only ever worked that way and the habit carried over. But you cannot rely on a habit for something this consequential. Check it before you need to know: place one small test order in the opposite direction to something you already hold, and watch the Trade tab. If the position vanishes, you are on netting. If a second line appears, you are on hedging. Two minutes, once, and then you know.

    What the Accidental Lock Actually Costs

    People tolerate the accidental lock because it looks free. The loss stopped moving, nothing was crystallised, no harm apparently done. The harm is real, it is just spread across three separate bills.

    The first bill is spread. Closing a position correctly costs you one exit. Locking costs you an extra entry now, on the unwanted second position, and an extra exit later when you finally unwind it. Two extra crossings of the spread, and the size of that bill scales exactly with your position size.

    Chart of what an accidental lock costs when learning how to sell gold on MetaTrader 5, by position size
    What an accidental lock costs by position size, when you press Sell on MetaTrader 5 expecting it to close a gold position

    Work it at a dealing spread of 0.30 US dollars per ounce, with the standard contract of 100 ounces to a lot, on a 5,000 dollar account risking one per cent, so 50 dollars, per trade. At 0.20 lot the accidental lock costs 12.00 dollars in extra spread, which is 24.0 per cent of the entire risk budget for that trade. At 1.00 lot it costs 60.00 dollars, which is 120.0 per cent, more than the whole planned risk, spent on nothing but a misunderstanding about a button.

    Now make it a habit rather than an accident. Two hundred trades in a year, with this going wrong on one in twenty of them, is ten events. At 0.20 lot that is 120.00 dollars a year, or 2.40 per cent of the account, which is 2.4 full units of risk handed over annually for no exposure and no thesis. Those are illustrative figures from the assumptions just stated, not a forecast, but the structure of the bill does not change when you substitute your own numbers.

    The second bill is swap. Both legs of a lock are financed positions, so you pay or receive the overnight charge on each of them, and on most gold accounts the two do not cancel. The net is usually a drip out rather than in, every night, for as long as the lock sits there.

    The Margin Arithmetic Nobody Shows You

    The third bill is the one that ends accounts, and it is the least obvious, because a locked pair feels safer than a naked position. It is not. It can be strictly more dangerous.

    Under the retail rules the European regulator introduced in March 2018, leverage on gold for retail clients is capped at 20 to 1, which means opening margin is 5.00 per cent of the notional value of the position. Those same measures set a margin close-out rule on a per account basis at 50 per cent of required margin, along with negative balance protection and the finding that 74 to 89 per cent of retail accounts typically lose money.

    Follow the arithmetic through a lock. One position needs 5.00 per cent of notional in margin, and the close-out rule reaches for you when equity falls to half of that, so 2.50 per cent of notional. Many brokers charge margin on both legs of a locked pair rather than netting them off. If yours does, the requirement becomes 10.00 per cent of notional, exactly twice, and the close-out level rises to 5.00 per cent of notional, also exactly twice.

    Read that last sentence again, because it inverts the intuition completely. The position that feels safe, because net exposure is zero, is the position that gets you force-closed at twice the equity level. You have not reduced your risk. You have raised the floor you fall onto, and you did it while believing you had bought yourself time. Some brokers do net the margin on locked pairs, some do not, and the platform’s own margin documentation is the place to start before you assume yours is generous.

    How to Close a Gold Position Properly on MT5

    Since Sell is not the answer, here is what is.

    • In the Toolbox at the bottom of the terminal, open the Trade tab. Every open position is listed there.
    • Find the line for your gold position and click the small × on its right-hand edge. That closes the whole position, at market.
    • To close part of it, right-click the line, choose Close Position, and set a smaller volume before confirming. Closing 0.05 of a 0.20 lot position leaves you long 0.15, not long 0.20 and short 0.05.
    • To close everything at once, right-click anywhere in the Trade tab and use Close All. Read which option you picked, because there are variants that close only profitable positions or only losing ones.

    The rule underneath all four is worth stating plainly: to reduce exposure, act on the position, not on the market. The × belongs to the position. The Sell button belongs to the market, and the market is happy to sell you something new at any hour.

    The Volume Box Is the Other Way This Goes Wrong

    The second recurring accident on MT5 is not the button, it is the number beside it. Volume is in lots, and one lot of gold is 100 ounces, so the gap between 0.10 and 1.00 is not cosmetic. It is ten times the exposure, which turns a planned one per cent risk into ten per cent on a single trade, and a ten per cent hole needs an 11.11 per cent gain to fill.

    Two habits fix this permanently. Work out the volume from your risk before the order window is open, which is what calculating lot size for gold and forex is for, and read the volume box out loud before confirming. It looks absurd, and it is the cheapest insurance in the terminal. If you need to adjust a trade rather than close it, modifying an open trade covers that logic, which is nearly identical across MT4 and MT5.

    A Short Checklist Before You Press Sell

    None of this requires a system. It requires four questions, asked in the two seconds before the click.

    • Am I opening a new short, or trying to close something I already hold? If it is the second, the Trade tab is where I should be, not the order window.
    • Is this account netting or hedging? If I do not know, I find out before I am under pressure, not during.
    • Is the volume box the number I calculated, or a number I typed quickly?
    • Is the symbol the one I meant? Gold trades under different tickers at different brokers, and F9 does not care which chart you were looking at.

    These are unglamorous questions. They also cover most of the ways a routine exit turns into an expensive afternoon, and none of them requires you to be right about where gold goes next.

    Free gold survival sheet

    Get the free Gold Empire survival sheet, a one-page guide to protecting your account through the kind of market this article describes. One email, no spam, unsubscribe anytime.

    Get the free survival sheet →

    Frequently Asked Questions

    How to sell gold on MetaTrader 5 if I do not already own any gold?
    The same way. A sell here is a contract for difference on the gold price, not a sale of metal, so nothing has to be in your possession first. You are agreeing to settle the difference in price, which is also why the position carries margin and an overnight financing charge rather than a storage cost.

    Why did pressing Sell not close my buy position?
    Because your account almost certainly uses the hedging accounting system, where a new deal opens an additional position and leaves the existing one untouched. Close positions from the Trade tab in the Toolbox instead, using the × on the position’s own line.

    Is locking a position a legitimate strategy?
    Some traders use it deliberately, usually to hold exposure through an event without closing. It is not free: you pay an extra spread to open the second leg and another to unwind it, you carry swap on both legs, and if your broker charges margin on both sides, your close-out level moves against you. Doing it on purpose after counting those costs is a decision. Doing it by accident is a bill.

    How do I tell whether my account is netting or hedging?
    Place one very small order opposite to an existing position and watch the Trade tab. One line means netting, two lines mean hedging. Your broker’s account specification page will also say, and the platform sets it from the server rather than from anything you can change locally.

    Does MetaTrader 4 work the same way?
    MT4 only ever offered the hedging model, so an opposite order there always opens a second position. MT5 supports both, which is precisely why the assumption people carry over from MT4 is no longer safe.

    Where did the figures in this article come from?
    The 20 to 1 gold leverage cap, the 50 per cent margin close-out rule and the 74 to 89 per cent retail loss range are quoted from the ESMA measures linked above, checked live before publication. The netting and hedging wording is quoted from the MetaTrader 5 help pages linked above. The cost figures are arithmetic from stated assumptions: a 0.30 dollar per ounce spread, 100 ounces to a lot, a 5,000 dollar account and one per cent risk per trade. None of them is a price quote, a forecast or a performance claim.

    Where Gold Empire Fits

    Gold Empire is free to follow. Daily XAU/USD analysis on Telegram, with the reasoning stated before the trade rather than after it, losing days included. There is a free survival sheet for anyone who wants the capital protection material in one place, and an optional Kit for people who want the full method. Nothing here promises a profit and nothing here is a signal service.

    Knowing your platform is part of risk control rather than separate from it. Risk management for gold trading is the pillar this article sits under, leverage in gold trading explains why the margin arithmetic above bites so hard, and managing a gold trade after you enter covers the decisions that come after the order is filled. More about who writes this is on the about page.

    About the author. Matthew writes Gold Empire and spends most of his attention on the boring mechanics that decide whether an account is still open in two years. He has a particular dislike of interfaces that hide a consequential decision behind an obvious-looking button. Nothing in this article is a recommendation to trade, and no entry, stop or target discussed should be treated as a signal.


    Disclaimer: This article is general educational content about trading platform mechanics, order handling and margin rules in retail trading. It is not financial advice, not investment advice and not a recommendation to buy, sell or use any product, platform or firm. Platform behaviour and broker terms vary and change, regulatory rules differ by jurisdiction, and the quoted documentation should be checked in its current form. Trading leveraged products carries a substantial risk of loss and most retail accounts lose money. Figures are illustrative calculations from stated assumptions, not predictions or performance claims.


  • How to Track My Trades: The Record That Tells You If You Are Surviving

    How to Track My Trades: The Record That Tells You If You Are Surviving

    Most people start keeping records after the damage is done. The account has had a bad month, the story they were telling themselves has stopped matching the balance, and somewhere in that gap the question arrives: how to track my trades properly, so that next time I can see it coming.

    It is the right question asked late, which is still better than not asked at all. But the usual answer, download a spreadsheet template and start filling it in, quietly misses what the record is actually for. A list of trades with a profit column is a receipt. It tells you what already happened to your money. It does not tell you whether you are surviving, and survival is the only thing that matters in the first two years.

    This article is about the second kind of record. It is shorter than most templates, it takes about four minutes a day, and it is built around a single question: is the thing I am doing going to still have an account attached to it in twelve months.

    How to Track My Trades So the Record Answers a Useful Question

    Start with the base rate, because it sets the standard the record has to meet.

    When European regulators looked at retail contracts for difference across member states, they found that 74 to 89 per cent of retail accounts typically lose money, with average losses per client ranging from 1,600 to 29,000 euros. That is the published finding from ESMA’s product intervention measures of 27 March 2018, and it is worth sitting with for a moment, because it reframes the whole exercise.

    If most accounts lose, then the interesting question about your own record is not whether you had a good week. Good weeks happen to losing accounts constantly, which is exactly why losing accounts survive long enough to become large losses. The interesting question is whether anything in your record distinguishes you from the base rate, and a profit column cannot answer that, because a profit column looks identical for the first three months in both cases.

    So the record has to track the things that separate the two groups before the balance does. There are three of them, and none is what people usually write down.

    The First Thing to Track Is What You Risked, Not What You Made

    Write down, before entry, the amount you have decided to lose on this trade if it goes wrong. Not the lot size, not the stop level, the amount. Then write down what actually happened to that amount.

    This sounds trivial and it is the single highest value line in the whole record, for a reason that shows up the first time you review a month. The number you planned to risk and the number you actually lost are different more often than anyone expects, and the gap between them is a complete description of your discipline.

    A trade where you planned to lose one unit and lost one unit is a working process producing a bad outcome, which is normal and fine. A trade where you planned to lose one unit and lost 1.7 because you moved the stop is something else entirely. It is not a losing trade, it is a broken rule, and it belongs in a different column. Recorded together, as most templates record them, the second kind hides inside the first and you lose the one signal that would have warned you.

    Keep both columns. Planned risk, realised risk. When the second starts drifting above the first, the process is degrading, and it will show up there weeks before it shows up in the balance.

    The Second Thing to Track Is Your Total Open Risk, Right Now

    Here is where most records fail silently, and it is a survival issue rather than a bookkeeping one.

    Suppose you size every position so that it risks one per cent of the account. Disciplined, consistent, exactly what the books say. Now suppose you have three positions open at once: long gold, short the dollar index, and long silver. Each one is risking one per cent, so your record shows one per cent, three times.

    Your account does not see three one per cent risks. It sees one position expressed three ways, because those three instruments respond to the same driver. If that driver moves against you, all three lose together. The arithmetic depends on how related they really are:

    • If the three trades were genuinely independent, combined risk works out at about 1.73 per cent of the account, because independent risks add along the diagonal rather than in a straight line.
    • If they are effectively the same trade, combined risk is the full 3.00 per cent, three times what your record claims.
    • Four correlated positions, sized the same way, put 4.00 per cent on a single decision while every line of the record still reads one per cent.

    Those are computed from the stated assumption that each position risks exactly one per cent and that correlation is either zero or one. Real positions sit between the two, which is the point: you cannot know where without writing the number down.

    So the record needs one live line, updated whenever a position opens or closes, that says what your worst realistic day looks like right now if everything currently open goes wrong at the same time. Not the sum of the individual risks, the honest answer. Most people who start keeping this line discover their worst day is two to three times what they believed, and they discover it on a quiet afternoon rather than during the event.

    Chart of annual trading cost in units of risk, part of learning how to track my trades honestly
    Learning how to track my trades starts with the cost that is charged whatever the outcome: activity itself is an expense, and it scales exactly with how often you trade.

    The Third Thing to Track Is How Often You Trade

    Activity has a price, and it is charged before anyone finds out whether you were right.

    Assume each round trip costs you 0.08R, where R is the amount you risk per trade, and that 0.08 covers spread, commission and slippage together. It is an assumption, not a measurement, and your own number will differ. Hold it fixed and count:

    • 50 trades a year costs 4.0R annually.
    • 100 trades costs 8.0R.
    • 200 trades costs 16.0R.
    • 400 trades costs 32.0R.

    If one R is one per cent of the account, the four hundred trade year has spent 32 per cent of the account on the privilege of participating. The method now has to clear that hurdle before it produces anything, and the two hundred trade year has to clear sixteen per cent. Nothing about the quality of the trades changed. Only the count did.

    This is not a new observation. Terrance Odean’s paper “Do Investors Trade Too Much?”, published in the American Economic Review in 1999, examined exactly this relationship between trading frequency and outcomes, and the reference is given here so you can look it up rather than take it on trust. What is new, for most people, is having their own number instead of the general finding. The count is the easiest thing in the world to track and almost nobody tracks it, which is why almost nobody notices the year their trade count doubled.

    Put a running count in the record, weekly and yearly. When it climbs, something has changed in your behaviour, and the change happened for a reason worth knowing.

    Why a Short Record Cannot Tell You Anything Yet

    There is a trap on the other side of this, and it catches the people who take record keeping seriously.

    After twenty trades, the record exists, the columns are filled in, and the temptation is to start drawing conclusions from it. Twenty trades cannot support a conclusion. Here is the arithmetic, assuming the standard deviation of the result of a single trade is 1.0R, which is a reasonable working figure for a method risking a fixed amount:

    • To detect a change of 0.30R per trade in your average result, you need about 43 trades recorded properly.
    • To detect a change of 0.20R, about 96 trades.
    • To detect a change of 0.10R, about 384 trades.
    • To detect a change of 0.05R, about 1,537 trades.

    Those come from the usual confidence interval width, 1.96 standard errors, and they assume trades are independent, which flatters the result because real trades cluster. The honest reading is that small edges are invisible in small samples, and that a person reviewing twenty trades is reading noise and calling it evidence.

    This is not an argument against keeping the record. It is an argument for keeping it long, and for being extremely reluctant to change your method on the strength of a short one. The most expensive thing a new record does is give someone the confidence to abandon a working approach after a run of bad luck, or to scale up a broken one after a run of good luck.

    Free gold survival sheet

    Get the free Gold Empire survival sheet, a one-page guide to protecting your account through the kind of market this article describes. One email, no spam, unsubscribe anytime.

    Get the free survival sheet →

    What the Record Looks Like in Practice

    Six columns, filled in at the time rather than at the weekend, because memory edits.

    1. Date and instrument. Obvious, and it is what lets you spot the clustering later.
    2. Planned risk, in money. Decided before entry, written before entry.
    3. Realised result, in units of planned risk. Minus one, plus 2.3, plus 0.4. Using units rather than money keeps a year of trades comparable while the account changes size.
    4. Rule broken, yes or no. One word. This is the column people leave out and then wonder why the record taught them nothing.
    5. Total open risk at the moment of entry. Including everything else already open.
    6. Why, in one line. Written before the outcome is known, otherwise it is not a reason, it is a justification.

    That is the whole thing. A spreadsheet, a notes app, a paper notebook, the tool does not matter and arguing about the tool is a common way of not starting. What matters is that columns two, four and five exist, because those are the three the profit column cannot reconstruct afterwards.

    Reviewing It Without Fooling Yourself

    Once a month, not once a day. Daily review of a record this short turns into score watching, which is the behaviour the record is supposed to correct.

    Ask four questions of the month, in this order. How many times did column four say yes, and is that number rising or falling? What was the largest total open risk I carried, and did I decide to carry it or drift into it? How many trades did I take, against my own average? And only then: what did the results look like, remembering that a month is far too short to mean anything on its own.

    The order is deliberate. Results last, because results are the part you control least and the part most likely to make you rewrite the story of everything above them.

    Frequently Asked Questions

    How to track my trades if I only place two or three a week?
    The same way, and the low count is an advantage rather than a problem. Fewer trades means less cost drag and more attention available for each entry in the record. It also means the sample builds slowly, so be correspondingly slower to draw conclusions from it.

    Should I record demo trades in the same place?
    Record them, but keep them separate and never merge the two. A demo record is a record of your process under conditions where nothing is at stake, and the gap between the demo record and the live record is itself one of the more useful measurements you can have.

    Do I need special journalling software?
    No. Software that imports your trade history automatically will fill in columns one and three, which are the two columns you could reconstruct anyway from the account statement. The columns that matter, planned risk, rule broken and total open risk, all have to be typed by a human at the moment of the decision, because no platform records intent.

    What if I already have months of trades and no record of them?
    Start from today rather than reconstructing backwards. Reconstructed records are unreliable in a specific direction: people remember the reasoning of their winners and forget the reasoning of their losers, so a backfilled record systematically flatters the process it is supposed to audit.

    How long before the record is useful?
    The discipline columns are useful immediately, because a broken rule is a fact rather than a statistic. The performance columns need the sample sizes above, which for most people means a year or more before the numbers carry weight.

    Where did the numbers in this article come from?
    The retail loss range is quoted from the ESMA measures linked in the text, checked live before publication. The correlation figures are the square root of the number of positions for independent risks and the plain sum for identical ones. The cost figures are the trade count multiplied by an assumed 0.08R per round trip. The sample sizes are 1.96 squared, times the assumed variance of 1.0R squared, divided by the effect size squared. Odean’s 1999 paper is cited by title and journal so it can be checked directly. None of these is a forecast or a performance claim.

    Where Gold Empire Fits

    Gold Empire is free to follow. Daily XAU/USD analysis on Telegram with the reasoning stated before the trade rather than after it, losing days included. There is a free survival sheet for anyone who wants the capital protection material in one place, and an optional Kit for people who want the full method. Nothing here promises a profit and nothing here is a signal service.

    Record keeping belongs to survival before it belongs to improvement. Risk management for gold trading is the pillar this article sits under, how much to risk per trade is where the planned risk column gets its number, why you keep blowing your trading account covers what the discipline column is designed to catch, and how to calculate lot size for gold and forex turns the planned risk into a position. More about who writes this is on the about page.

    About the author. Matthew writes Gold Empire and is mainly interested in the unglamorous half of this business, the part that decides whether anyone is still trading in two years. He has a long-standing suspicion of any record that only contains outcomes. Nothing in this article is a recommendation to trade, and no entry, stop or target discussed should be treated as a signal.


    Disclaimer: This article is general educational content about record keeping, risk measurement and review process in retail trading. It is not financial advice, not investment advice and not a recommendation to buy, sell or use any product, platform or firm. Regulatory wording is quoted from the source linked in the text and may change, and rules vary by jurisdiction. Trading leveraged products carries a substantial risk of loss and most retail accounts lose money. Figures are illustrative calculations from stated assumptions, not predictions or performance claims.


  • Are Forex Signal Groups Legit? How to Tell the Real From the Fraud

    Are Forex Signal Groups Legit? How to Tell the Real From the Fraud

    This question arrives in the Gold Empire group most weeks, and it usually arrives quietly, from someone who has just paid for something and has started to feel uneasy about it. The search they typed was are forex signal groups legit, and they were hoping for a simple yes or no. The honest answer is that the category contains both real operations and organised fraud, and the two are deliberately made to look identical from the outside. That is the whole problem, and it is solvable, but not by looking at screenshots.

    So this article is not going to tell you that every signal group is a scam, which would be untrue and would also be a strange thing for us to say. It is going to show you what the fraud statistics actually look like, walk through two pieces of arithmetic that expose most fake track records in about a minute, and give you a checklist you can run before any money leaves your account. The maths is the important part, because it does not care how convincing the marketing is.

    Chart of reported investment fraud losses and complaint counts behind the question are forex signal groups legit
    Asking are forex signal groups legit is reasonable: reported investment fraud losses have nearly doubled in two years.

    Are forex signal groups legit, or is the whole category a fraud?

    Both things are true at once, which is what makes this hard. There are people who publish their reasoning openly, charge nothing or charge for education, and are upfront that they cannot promise outcomes. There are also criminal operations that use the same vocabulary, the same Telegram layout and the same chart screenshots, and whose actual business model is taking deposits and disappearing.

    The difference is almost never visible in the marketing, because the fraudulent operation has a much bigger budget for marketing than the honest one does. What separates them is structural: where your money sits, what they claim, and what happens when you ask to take money out. We will get to all three.

    What the fraud numbers actually say

    It helps to know the scale of what you are protecting yourself from, and for that there is a primary source rather than a guess. The FBI’s Internet Crime Complaint Center publishes an annual report of complaints filed by the public in the United States. The 2025 IC3 Annual Report records 72,984 investment fraud complaints, with reported losses of 8,648,617,756 US dollars.

    Two things about that figure are worth sitting with. The first is that investment fraud was the single largest loss category of every crime type IC3 tracks that year, ahead of business email compromise and tech support scams. The second is the direction of travel. Reported investment losses were 4,570,275,683 dollars in 2023 and 6,570,639,864 in 2024, so the 2025 figure is an increase of about 89 per cent in two years. Complaint counts went from 39,570 to 72,984 over the same period, an increase of about 84 per cent. Dividing the 2025 loss total by the 2025 complaint count gives an average reported loss of roughly 118,500 dollars per complaint, which tells you these are not small sums from people with money to spare.

    There is a second number in that report that changed how I talk about this. Through an operation that identifies victims of cryptocurrency investment fraud and contacts them, the FBI reported that 78 per cent of the victims it notified were unaware they were being scammed at the moment of contact. Not suspicious and ignoring it. Unaware. These were people who, if you had asked them that morning whether they had been defrauded, would have said no.

    That is the part to take personally. The instinct most people rely on, the feeling that they would know, is precisely the thing the numbers say does not work. So the checks below are deliberately mechanical, because a procedure you run regardless of how you feel is worth more than a feeling.

    One more trend is worth naming. The same report counts 4,356 investment fraud complaints with an artificial intelligence element, carrying 632,041,188 dollars in losses. The United States derivatives regulator has published its own advisory on criminals increasing their use of generative AI to commit fraud. In practice this means the voice on the call, the face in the video, the testimonials and the equity curve can all now be manufactured cheaply. Any check that relies on the content looking professional is already obsolete.

    Why a perfect track record proves almost nothing

    Here is the first piece of arithmetic, and it is the one I wish someone had shown me early. Suppose a promoter wants to produce a genuinely perfect ten-call record without any skill whatsoever.

    They start with 1,024 people. They tell half of them gold goes up this week and the other half that it goes down. One of those groups was right, and there are 512 people in it. They drop the others and split the remaining group again, and again. After ten rounds of this, the arithmetic is simply 1,024 divided by two ten times over, which leaves exactly one person. That person has watched ten consecutive calls land correctly. From inside their own experience, the evidence is overwhelming.

    Nothing was predicted. No skill was involved. The promoter simply discarded the people who saw the misses, and the survivor’s screenshots are completely authentic, which is why asking to see the wins never resolves anything. A pure coin flip lands ten in a row roughly once every 1,024 attempts, or about 0.098 per cent of the time, and a promoter with a large audience gets a great many attempts.

    The defence is not to distrust screenshots. It is to ask a different question: show me the complete record, every call, in the order it was made, including the ones that lost. A real operation can produce that because it keeps it. A fake one cannot, and will explain why the request is unreasonable.

    The arithmetic a signal seller hopes you never do

    The second piece of arithmetic deals with the most common claim in this entire industry, the high win rate. Win rate on its own is close to meaningless, and here is why.

    What matters is the size of the wins relative to the size of the losses. Traders measure this in R, where one R is the amount risked on a trade. If your risk on a trade is one R and the trade makes two and a half times that, it was a plus 2.5R result. Expressed that way, a strategy’s expectancy per trade is the win rate times the average win in R, minus the loss rate times the average loss in R.

    Run that on a service advertising a 90 per cent win rate, where each win takes a small profit of 0.1R and each loss runs a full 1R. The expectancy is 0.9 times 0.1, minus 0.1 times 1, which comes to minus 0.01R per trade. Nine wins out of ten, and the account still bleeds. Now run it on a service that wins 45 per cent of the time but makes 2R on winners: 0.45 times 2, minus 0.55 times 1, gives plus 0.35R per trade on those assumptions.

    The numbers above are arithmetic on assumed inputs, not results anyone achieved and not a prediction of what any method will do. That is exactly the point. The advertised win rate told you nothing in either direction, so a group that quotes a win rate and will not tell you the average size of its losses has not given you information at all. It has given you a number chosen because it sounds good.

    Worth adding: the calculation above ignores costs. Spread, swap and slippage come out of every real result, which is why a method that looks marginally positive on paper often is not once it meets an actual broker.

    Seven checks to run before any money moves

    None of these require you to judge whether someone seems trustworthy. They are all things you can verify from the outside.

    • Where does your money sit? This is the single biggest divider. A legitimate educational channel or signal service never holds your funds. Your money stays with a regulated broker in an account in your name. The moment someone asks you to deposit with them, send funds to a personal wallet, or use a specific unregulated platform they recommend, you are no longer looking at a signal service.
    • Check the regulator’s register yourself. Not the licence number printed on their website, which costs nothing to invent. Go to the regulator’s own site, search the name, and confirm the entity and the permissions match. If the answer is confusing, that is your answer.
    • Ask for the complete record. Every call, in sequence, including losses, with dates. Watch what happens when you ask. A defensive response to a reasonable request is information.
    • Look for a guarantee. Any promise of a specific return, any claim of a risk free trade, any phrase like guaranteed profit, is disqualifying on its own. Nobody can promise market outcomes, so anyone who does is either lying or does not understand their own product.
    • Test the withdrawal early, and small. If funds are with a broker, withdraw a small amount within the first weeks, before there is anything meaningful at stake. Frauds are built to accept deposits smoothly. Problems appear on the way out, often as a surprise tax or fee that must be paid first.
    • Notice the pressure. Limited spots, prices rising tonight, a private group closing at midnight. Urgency exists to stop you completing the other six checks. That is its only function.
    • Watch for the second approach. People who have lost money are frequently contacted again by someone offering to recover it for an upfront fee. This is the same operation or one that bought the list. There is no legitimate service that recovers defrauded funds for a fee paid in advance.

    What an honest channel looks like, including this one

    It would be convenient for us to end with a warning about everyone else, so let me be direct about where Gold Empire sits, because you should apply the same checks here.

    Signals are part of what this channel offers. We also publish our results openly, including the bad stretches, and we do not promise profits, because no honest channel can. We never hold anyone’s money. We have no mechanism to and no interest in acquiring one. The free material is genuinely free and most people use the channel that way permanently, which is a completely normal way to use it.

    What you should take from any group, including this one, is not a trade to copy. It is the reasoning behind it, so that eventually you do not need the group. A service whose model depends on you never becoming independent has an incentive that quietly works against you, and that is true even when the people running it are entirely sincere.

    This is also why position size matters more than the source of an idea. If a single trade can hurt your account badly, then the quality of your signal provider becomes the most important thing in your life, which is a fragile way to operate. If your risk per trade is small and consistent, a bad call from anyone is survivable, and the question of whether to trust a group stops being existential. That is the actual defence, and it works against fraud, bad advice and your own mistakes equally well.

    If you have already paid one

    Stop sending money immediately, including any fee presented as the thing standing between you and your balance. Those fees are the fraud continuing, not the resolution of it.

    Write down everything while it is fresh: names, handles, platform, dates, amounts, wallet addresses or account numbers, and screenshots of the conversations before they are deleted. If you are in the United States, file with IC3. Elsewhere, report to your national financial regulator and to the police. Your report may not recover your money, and it is fair to know that in advance. It does feed the data that identifies these operations, and that is the mechanism behind the notification work mentioned earlier.

    Then, and this matters more than people expect, tell someone. Shame is what keeps victims quiet, and silence is precisely what allows the same operation to run the same script on the next person. Being defrauded by a professional criminal organisation is not a character flaw, and given the numbers above, it is not a rare one either.

    Free gold survival sheet

    Get the free Gold Empire survival sheet, a one-page guide to protecting your account from the kind of losses this article describes, including the position sizing that makes any single bad call survivable. One email, no spam, unsubscribe anytime.

    Get the free survival sheet →

    Frequently asked questions

    Are forex signal groups legit if they are free?

    Free removes one risk, the subscription itself, and leaves the others in place. Free groups are often funded by broker referral arrangements, which means the group earns when you deposit or trade, whether or not you do well. That is not automatically dishonest, and plenty of channels disclose it openly. It is something you should know, and a group that hides it has told you something about how it operates.

    What is the clearest single warning sign?

    Being asked to send money to the group rather than to a regulated broker account in your own name. Almost every large loss follows from that one step, and it is the easiest thing on the list to check.

    Does a verified track record on a third-party site settle it?

    It helps, and it is better than screenshots, but verify what is actually being tracked. A verified account can still be a small demo account, a different account from the one being sold, or a real account run at risk levels nobody would survive. Look for the complete history with losses included, and check the dates line up with the claims.

    Can I just follow signals without understanding them?

    You can, and many people do. The cost is that you cannot tell a bad run from a broken method, because you have no way to evaluate the reasoning. When the losing stretch arrives, and it will, you will be making the most important decision of your trading life with no information. That is the real argument for learning the reasoning, quite apart from fraud.

    Is the whole industry getting worse?

    The reported numbers are rising, and the tools available to fraudsters have improved sharply, as the regulator’s advisory on generative AI sets out. The checks in this article are mostly structural, which is the reason they hold up: where your money sits and whether outcomes are guaranteed are facts that better video quality cannot change.

    What Gold Empire actually does

    Gold Empire is a free education channel for people trading gold, and the order is deliberate: survive first, then grow. We publish the mechanics of this market, the ways accounts get destroyed, and the habits that keep people around long enough to get good. The free gold survival sheet is the one page version of that, and it costs nothing.

    Everything here is free to read. There is an optional kit for people who want the material organised into a working system, and following along without ever buying it is a completely normal way to use this channel. We share our own results openly, and signals are part of what the channel offers, but we do not promise profits, because no honest channel can. If you want the next steps in order, start with risk management in gold trading, then read how to get signals for forex trading for what a sensible relationship with any signal source looks like, and how to avoid losing money in forex trading for the mistakes that cost more than any subscription. If you are still choosing where to trade, how to pick a broker for gold trading covers what to look for.

    About the author

    Matthew writes the Gold Empire material. He spent his first years in this market learning the expensive way that the size of a position matters more than the direction of it, and most of what he publishes now is the article he wishes had existed then. He reads every message in the group and answers the ones about risk first. You can read more about the Gold Empire approach here.


    This article is educational content, not financial advice. It does not account for your personal circumstances, your tax position, or your risk tolerance, and nothing in it is a recommendation to buy or sell any instrument. Trading leveraged products carries a high risk of losing money rapidly, and no entry, stop or target discussed should be treated as a signal. Consider speaking to a licensed professional in your jurisdiction before making decisions about your money.


  • What Is an ECN Account, and What the Label Legally Means

    What Is an ECN Account, and What the Label Legally Means

    Somebody opens a broker’s account comparison page, sees three columns, and asks the reasonable question: what is an ECN account, and is it the one a serious person picks? The page usually answers with a tighter spread, a commission per lot, and a phrase like direct market access or no dealing desk.

    That answer describes a price list. It does not describe what the three letters mean, and the gap between those two things is where the money quietly goes. So this article does both. First what an ECN actually is in the only place the term has a legal definition, which will surprise most people. Then what an ECN account is in practice at a gold broker, which is a different thing entirely. Then the arithmetic that decides whether it is cheaper for you, which is the only part you can actually act on.

    What Is an ECN Account: Start With What the Letters Mean

    ECN stands for electronic communications network. The term is not marketing language in origin. It has a definition in United States securities regulation, and you can read it yourself in the definitions section of Regulation NMS at 17 CFR 242.600.

    The definition says an electronic communications network is any electronic system that widely disseminates to third parties orders entered in it by an exchange market maker or an OTC market maker, and permits those orders to be executed against in whole or in part.

    Read that once more, because every clause is load bearing. Orders are widely disseminated to third parties, so other participants can see them. Those orders come from market makers in a regulated quoting system. And other participants can execute against them directly.

    Then the definition does something that almost nobody quoting the term mentions. It carves two things out. The first exclusion is a system that crosses orders at set times at a single price and does not let participants execute against each other outside those times. The second exclusion is the one that matters here: a system operated by, or on behalf of, an OTC or exchange market maker that executes customer orders primarily against the account of that market maker as principal, other than riskless principal.

    In plain terms, the regulation explicitly says that a venue where your order is filled mainly by the operator taking the other side is not an electronic communications network. That is not my interpretation. It is the text of the carve out.

    The Word Has a Home, and It Is Not Retail Gold

    Here is the part that reframes the whole question. That definition lives in Regulation NMS, which governs the national market system for United States equities. It applies to shares quoted and traded on American exchanges. It is a term of art from stock market structure.

    Spot gold is not an equity. XAUUSD is not listed on a national securities exchange. Neither is a currency pair, and neither is a contract for difference on any of them. So when a gold broker offers you an ECN account, it is not claiming a regulatory status under that rule, because that rule does not reach the product at all.

    You can see how seriously the real thing is regulated by looking one section over. Under 17 CFR 242.301, an alternative trading system, the broader category ECNs belong to, has to register as a broker dealer and file a Form ATS with the Commission at least 20 days before it starts operating, plus an amendment at least 20 days before any material change to how it works. That is a filing regime with a paper trail, and it exists precisely because who matches your order matters.

    None of that machinery applies to the label on a retail gold account. Which leads to the honest answer to the headline question: ECN account is a product name, not a regulated status. It might describe an excellent execution arrangement. It might describe a marked down spread with a commission bolted on. The three letters do not tell you which, and no amount of staring at the comparison table will.

    So What Is an ECN Account in Practice?

    Strip the label away and what a broker is usually offering is a pricing model, not a venue. Two models exist and every account type is one of them wearing a different name.

    The all in spread model. One number quoted, wider than the underlying market, no separate charge. The broker’s revenue is inside the spread, so you never see it itemised. Usually called standard or classic.

    The raw spread plus commission model. A much tighter quoted spread, plus an explicit commission per lot. The broker’s revenue is now on the invoice. Usually called ECN, raw, or zero.

    The second one feels more honest and often is, in the narrow sense that you can see what you are paying. But visible is not the same as cheap, and this is the trap the label sets. People read the commission as the cost of the account, compare commissions across brokers, and pick the lowest. The commission is the smaller half of the bill and it is the half that does not change.

    The Arithmetic That Actually Decides It

    Let us put a number on it. Assume a standard gold contract of 100 troy ounces per lot. I will express the spread in dollars per ounce rather than pips, because every broker defines a gold pip differently and that ambiguity is where comparison errors breed. No gold price appears anywhere in what follows, and none is needed.

    The cost of a round turn on one lot is the spread times 100 for the standard account, and the spread times 100 plus the commission for the raw account. Set them equal and you get the break even condition, which is pleasingly simple:

    The standard account has to be quoting a spread wider by the commission divided by 100, measured in dollars per ounce.

    So at a commission of 7.00 dollars round turn per lot, the standard account must be at least 0.07 dollars per ounce wider before the raw account is genuinely cheaper. At 10.00 dollars it needs to be 0.10 wider, at 14.00 dollars, 0.14 wider. That is the entire comparison, and you can run it in your head at the broker’s page instead of trusting the layout of the table.

    Now the part that matters more, and that the comparison page will never show you.

    Chart for what is an ECN account, showing the commission falling from 36.8 percent of total trading cost in a quiet market to 3.5 percent when the spread widens sixteen times
    What is an ECN account worth in a fast market: with the commission fixed at 7.00 dollars a lot, its share of your total cost collapses from 36.8 percent to 3.5 percent as the spread widens, because the spread is the part that moves.

    Hold the commission at 7.00 dollars and start the raw spread at 0.12 dollars an ounce in a quiet market. Total cost per lot is 19.00 dollars, and the commission is 36.8 percent of it. Now let the spread widen the way spreads do around a scheduled release or a thin hour. At twice as wide, total cost is 31.00 and the commission is 22.6 percent. At four times, 55.00 and 12.7 percent. At eight times, 103.00 and 6.8 percent. At sixteen times, 199.00 dollars and the commission is 3.5 percent of what you just paid.

    The total bill went up 10.47 times. The commission did not move at all.

    Which tells you something the account names actively obscure. The number printed on the comparison page, the fixed and knowable one, is the part that barely matters when it hurts. The variable one, the spread, is the part that does all the damage, and it is largest exactly when you most need to get in or out. Choosing an account by its commission is optimising the component that does not vary while ignoring the one that does.

    Free gold survival sheet

    Get the free Gold Empire survival sheet, a one page guide to protecting your account from the costs that only show up when the market is moving. One email, no spam, unsubscribe anytime.

    Get the free survival sheet →

    What to Check Instead of the Label

    If the three letters carry no guarantee, the useful move is to replace the label with questions that have verifiable answers. Five of them, in the order I would run them.

    One of those questions is large enough to have its own article: who is legally the other side of your trade. What is an ECN broker takes that up from the firm side, using the CFTC rulebook for retail forex rather than the equity definition used above, and shows what ordinary cost does to an account before any of these checks are made.

    Who regulates the entity you are actually contracting with? Not the group, not the brand on the website, the specific legal entity named in the client agreement. Then look it up on that regulator’s own public register, not on the broker’s page about its regulation.

    What does the order execution policy document say? Regulated firms publish one. It describes how orders are handled and whether the firm may act as principal. That document is the answer to the question the account name is pretending to answer, and almost nobody reads it.

    Is slippage symmetric? Ask whether price improvement is passed on as readily as adverse slippage. A firm that fills you worse when the market moves against you and never better when it moves for you has told you something about its model that no acronym will.

    What is the total cost per lot, in one number? Spread times contract size plus commission, calculated by you, for the hour you actually trade. Two numbers cannot be compared across brokers. One can.

    What does the spread do in the minutes that matter? Watch it yourself around a scheduled release on a demo or a small live account before you commit size. This is the only one of the five that takes patience rather than reading, and it is the one that tells you the most.

    Notice that none of those five questions mentions ECN. That is the point. The label was never the variable, and treating it as one is how people end up paying more at the account that advertised paying less.

    Frequently Asked Questions

    What is an ECN account in forex or gold trading?
    In practice it is a pricing model: a tighter raw spread plus an explicit commission per lot, as opposed to an all in wider spread with no separate charge. The term itself comes from United States equity market structure, where 17 CFR 242.600 defines an electronic communications network, and that definition does not apply to spot gold or currency pairs. So the name describes the price list, not a regulated status.

    Is an ECN account better than a standard account?
    Only if the standard account’s spread is wider than the raw spread by more than the commission divided by the contract size. With a 7.00 dollar round turn commission on a 100 ounce lot, that gap has to be at least 0.07 dollars an ounce. Below that, the standard account is cheaper. It is a calculation, not a tier.

    Does an ECN account mean my orders go to the real market?
    The name does not establish that. The regulatory definition of an electronic communications network specifically excludes a system that fills customer orders primarily against the operator’s own account as principal. Whether that applies to your provider is answered by its order execution policy and its regulator’s register, not by the account label.

    Why does my ECN account still cost more on news?
    Because the commission is fixed and the spread is not. In the illustration above, the commission holds at 7.00 dollars while total cost per lot runs from 19.00 to 199.00 as the spread widens, so the commission’s share of the bill falls from 36.8 percent to 3.5 percent. The account type does not change what happens to a spread in a fast market.

    Is a lower commission the right thing to compare?
    It is the easiest thing to compare and the least decisive. Compare one total cost per lot for the hour you actually trade instead, and check the spread’s behaviour around scheduled releases before you commit size.

    Where did the numbers in this article come from?
    The definition of an electronic communications network and its two exclusions are the text of 17 CFR 242.600, and the broker dealer registration and 20 day Form ATS filing requirements are 17 CFR 242.301, both linked above. Every cost figure is my own arithmetic under the assumptions stated in the text: 100 troy ounces per lot, a 7.00 dollar round turn commission, and a 0.12 dollar per ounce raw spread in a quiet market. Commission levels and spreads vary by firm and by hour, so run the calculation on your own numbers. No gold price appears anywhere in this article.

    Where Gold Empire fits

    Gold Empire is free to follow. Daily gold analysis with the reasoning written out, losing days included, plus an optional Kit for people who want the method in one place. There is no promise of profit here, because nobody honest can make one.

    What an account costs you is a survival question before it is a preference, which is why this sits under risk management in gold trading. Raw spread account vs standard account takes the same comparison further into the two pricing models, what the spread is in gold trading covers the component that does all the moving, and how to choose a broker for gold trading puts the account type back in its place as one line among several. If you have not opened an account yet, how to open a gold trading account is the step before this one.

    About the author

    Matthew has spent a long time around gold, most of it learning things the slow way, and now writes them down so other people can learn them the fast way. He is more interested in the mechanics that quietly drain accounts than in the setups that fill timelines. Nothing in this article is personal advice, and no entry, stop or target discussed should be treated as a signal.


    This article is educational content about account types, order handling terminology and trading costs. It is not investment advice, not a recommendation of any broker, account type or platform, and not a solicitation to trade. The definition of an electronic communications network and its exclusions are quoted from 17 CFR 242.600, and the alternative trading system requirements from 17 CFR 242.301. Those are United States securities rules summarised here rather than reproduced in full, they are amended from time to time, and they do not govern retail spot gold or foreign exchange in most jurisdictions; nothing here is legal advice and account naming conventions differ by firm and by country. No statement is made about the execution model of any particular broker, and readers should check the client agreement, the order execution policy and the relevant public register themselves. Every cost figure is my own arithmetic under the assumptions written out in the text, using illustrative commission and spread values rather than any firm’s actual pricing, and no gold price level is quoted. Trading gold carries a real risk of losing money, including more than you deposit in some account types. Nothing accounts for your personal circumstances, and no entry, stop or target discussed should be treated as a signal. If you are unsure, speak to someone properly qualified in your own jurisdiction before you risk anything.